
Remember me
The cohort for this study consisted of all individuals from the SickKids Genome Clinic for whom a primary blood sample was available (84/100 from Stavropoulos et al. 201616 and 50/103 from Lionel et al.17). This provided us with a cohort of 134 participants (75 males and 59 females) between 0 and 18 years of age at the time of sample collection (median 6 years; Supplementary Data 1). These individuals displayed a wide array of symptoms described by 453 unique HPO terms across the cohort. The most observed phenotypes were epilepsy (29%), global developmental delay (25%), multiple congenital abnormalities (19%), connective tissue (5%), eye (6%), behavior/cognition - other (3%), neurological - other (2%), immune (2%), cardiovascular (1%) and metabolic including mitochondrial (9%); Table 1 and Supplementary Data 2).
Table 1 Transcriptional impact of disease genes detected in bloodBased on prior published analyses, we split this cohort into two groups: Group 1 consisted of 61 individuals (35 male and 26 female) who received a diagnostic DNA variant(s) in the initial GS-based studies16,17,18. These variants were classified as pathogenic/likely pathogenic as per ACMG guidelines19 and were considered causative of the patient’s clinical phenotype. Group 2 consisted of the remaining 73 individuals (40 male and 33 female), who had yet to receive a molecular genetic diagnosis. The logic behind partitioning this well studied cohort into two groups was that it would allow us to: (a) assess the relevance of RNA-seq alone in identifying/corroborating existing diagnoses (Group 1); and (b) suggest genes and possible pathogenic variants related to the primary indication for referral in the unsolved cases (Group 2).
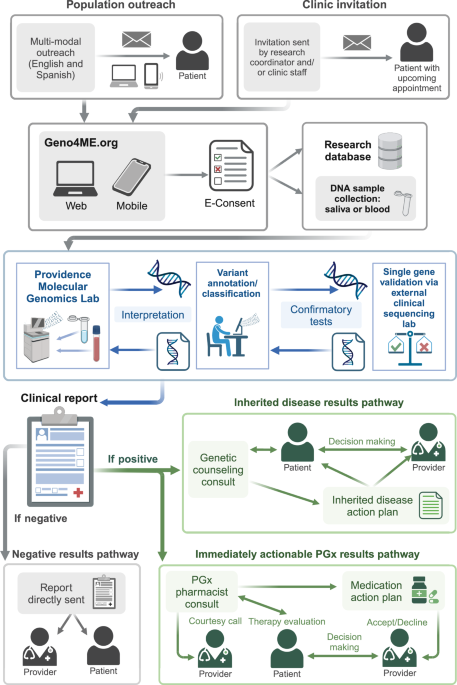
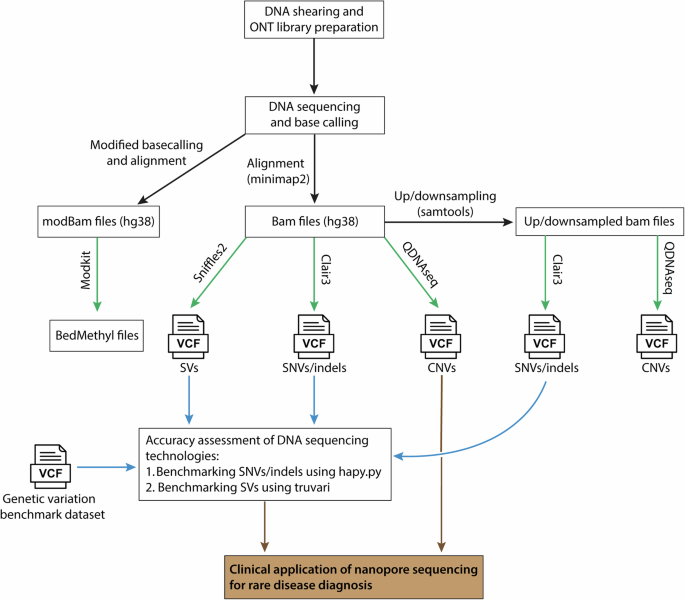
Developing and applying a scalable and reproducible RNA-seq library preparation method to 134 whole blood samplesCompared to genome sequencing, considerable technical variability can occur when performing RNA-seq. Our long-term objective is to establish a clinically validated RNA-seq procedure that can run in our clinical lab so that RNA-seq samples prepared over extended periods of time will show minimal batch effects. We established a semi-automated RNA-seq library preparation protocol with a workflow suitable for clinical laboratory testing. The sample preparation protocol included synthetic spike-in controls that allow us to assess the quality of the library preparation (ERCC + SIRV controls; see Methods and Fig. 1A). We chose not to pursue globin depletion strategies with the rationale that this would increase the variability in the library preparation step. Instead, we implemented deeper sequencing of libraries to ensure sufficient gene detection in samples where globin mRNA is high.
Using RNA-seq to reveal the impact of variants detected in disease genes obtained through prior genomic testingDespite blood samples having been archived for 3-5 years, we obtained RNA libraries suitable for subsequent sequencing for all samples. The resulting RNA-seq libraries were sequenced to a median of 116 million reads with a median of 78% of the reads mapped uniquely to the hg19 genome. We detected a median of 12,071 genes (TPM > 1) and 176,284 junctions (>=5 reads supporting a junction) per sample across our cohort. A full list of quality control metrics for each sample can be found in Supplementary Data 1.
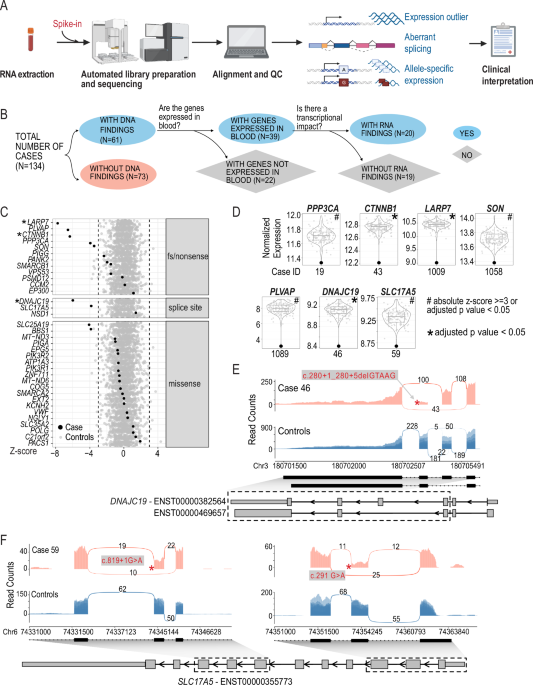
Fig. 1: Effects of pathogenic or likely pathogenic SNVs and indels on gene expression.
A RNA-seq-based clinical diagnosis workflow. B Flowchart showing the breakdown of samples. Created in BioRender. Wilson, M. (2025) https://BioRender.com/y35t706. C Detection of genes with diagnostic variants as expression outliers. Each row represents one gene. Each dot represents the z-scores of the corresponding gene in all samples. Black: cases in which the corresponding gene had a diagnostic variant; Grey: rest of the cohort as control samples. Asterisks indicate that the candidate gene is also detected as significant (adjusted p value < 0.05). Dashed lines indicated z-score of –3 or 3. Genes are separated into different panels based on the type of mutations they harbor. D Violin and boxplot showing normalized gene expression of selected candidate genes across the cohort. Y axis: log2 normalized read counts of the target gene in all samples in the cohort. Each dot represents one sample. Highlighted dot represents the case of interest. Case IDs are shown below each plot. The gene is considered an outlier in the analysis is designated by ‘#’ when absolute z-score >=3 or adjusted p value < 0.05) or by ‘*’ when the gene is detected as significant outlier with an adjusted p value < 0.05. E Impact of pathogenic variants in DNAJC19 on splicing and gene expression. F. Impact of pathogenic variants in SLC17A5 on splicing and gene expression. Sashimi plots show reads and junctions in the affected region for case (red track) and control samples (blue track, n = 10, randomly selected from the cohort) with the DNA variant labeled with an asterisk. Structures of relevant transcripts are shown with UTRs shown as thinner boxes. Only UTRs of transcripts annotated as “protein-coding” are shown. Exons shown in the sashimi plots are highlighted with a dashed box.
We focused on the 61 individuals for whom genomic variants in the initial studies and subsequent re-analysis had been considered as receiving a diagnosis16,17,18 (Group 1). These 61 cases were comprised of 52 cases with SNVs or indels, six cases with structural variants (SVs)/copy number variants (CNVs), and three cases with both candidate SNVs/indels and SV/CNVs. In 39 of the 61 cases, the disease-causing genes underlying the diagnosis were detectable in our blood RNA-seq data. RNA-seq revealed that in 20/39 cases the variants influenced transcription (altered expression, splicing, or allele-specific expression; Table 1, Fig. 1B) and the pathogenic classification of the DNA variants, as per ACMG guidelines, remains unchanged.
RNA expression changes in previously identified disease genesWe examined the effect of SNVs or indels on gene expression for genes that we detected by whole blood RNA-seq. This variation included missense variants, splice site variants, frameshift or nonsense variants (Fig. 1C, Table 1, Supplementary Data 2). We found decreased gene expression levels in genes from 9 cases, including 5 cases with nonsense or frameshift variants associated with autosomal dominant (AD) Infantile Epileptic Encephalopathy with Severe Global Developmental delay (PPP3CA), autosomal recessive (AR) Alazami syndrome (LARP7), AD Mental Retardation Autosomal Dominant 19 (CTNNB1) and AR Diarrhea 10, protein-losing enteropathy type (PLVAP), AD ZTTK syndrome (SON) (Fig. 1C–F, Table 1).
RNA-seq also gave us an opportunity to assess the gene expression consequences of missense variants. While it is typically assumed that missense variants would not overtly influence gene expression levels, genome sequencing alone cannot determine this. We found that 19/21 of the diagnosed cases with a missense variant showed no obvious effect on gene expression. The genes from the two participants with a diagnostic missense variant showed decreased gene expression (z-score < -3) were SLC25A19 (Case 11) and BBS1 (Case 38) (Fig. 1C, Table 1). The SLC25A19 result can be explained by the fact that in addition to a missense variant, the individual also possessed a heterozygous deletion that removes part of the last intron and the last exon of SLC25A19 (Table 1). Case 38 did not have an initial explanation for the observed reduced BBS1 expression, and the clinical data we used16,17,18 only reported the heterozygous pathogenic missense variant (NM_024649.5) c.1169 T > G (p.Met390Arg). However, additional consultation revealed that a subsequent genome reanalysis study at SickKids independently determined that a retrotransposon insertion occurred in trans to the heterozygous pathogenic missense variant, resulting in a premature termination codon20. Our RNA-seq analysis pipeline does not readily allow for the automated detection of such insertions and deletions. We did not initially flag these reads for further inspection due to the low expression of BBS1 in blood. Manual inspection of the RNA-seq reads identified reads mapping to the exon and the retrotransposon sequence (Supplementary Fig. 2).
Evidence for RNA splicing changes in previously identified disease genesWe observed splicing-related consequences in five individuals:
Case 46: aberrant splicing was present in an individual with a suspected mitochondrial disorder carrying a homozygous deletion occurring in the splice donor site of exon 5 of the DNAJC19 gene (NM_145261.3) c.280+1_280+5delGTAAG which is associated with 3-Methylglutaconic Aciduria Type V. Interestingly, this variant results in two novel junctions, one causing the skipping of exon 5 and the other causing the skipping of both exon 4 and 5 (Fig. 1E). Both events are predicted to result in a frameshift. In addition, reduced expression of DNAJC19 gene was also observed (Fig. 1D). While this variant was predicted to affect a canonical splice site, RNA-seq demonstrates a functional consequence of this deletion in vivo.
Case 59: aberrant splicing was confirmed in a case of Infantile Sialic Acid Storage disease where two rare variants in trans (confirmed by parental studies) were identified in the SLC17A5 gene (NM_012434.4) c.819+1 G > A; c.291 G > A p.(Thr97 = ). Both variants were predicted to influence splicing by in silico predictions. RNA-seq analyses also confirm that aberrant splicing occurs and showed skipping of exon 2 (c.291 G > A p.Thr97 = ) and exon 6 (c.819+1 G > A p.?) (Fig. 1F). Both events are predicted to result in a frameshift. Moreover, these aberrant splicing events were associated with reduced levels of the SLC17A5 transcripts suggesting the occurrence of nonsense mediated decay (NMD) (Table 1; Fig. 1D).
Case 1008: a rare heterozygous variant in the SMARCB1 gene (NM_003073.3) c.364del (p.Glu122Asnfs*21) was previously identified in an individual clinically diagnosed with Coffin-Siris syndrome. This variant was predicted to cause a frameshift in this haploinsufficient gene. Our RNA-seq analysis did not reveal a significantly reduced expression of this gene (z-score: -1.53, fold change: 0.89, p value: 0.12). However, RNA splicing analysis showed a decreased usage of exon 4 via exon skipping (Supplementary Fig. 3A). Importantly c.364del (p.Glu122Asnfs*21) occurs adjacent to the splice acceptor site, two base pairs from the start of exon 4. Skipping of exon 4 results in an in-frame truncation of the SMARCB1 protein, the functional consequences of which remain unknown.
Case 1016: a homozygous frameshift deletion was identified in exon 2 of the PANK2 gene (NM_153638.2) c.824_825del (p.Cys276Trpfs*15)) in an individual diagnosed with Neurodegeneration with Brain Iron Accumulation-1. We observed 88% (65/74 reads) of transcripts spliced to the short exon 2 of ENST00000336066, compared to only an average of 55% (152/272 reads) in ten randomly selected controls. Although short-read RNA-seq does not allow accurate measurement of isoform expression, estimation using RSEM suggested an increased usage of ENST00000336066 (65% vs. 52% cohort median). Long-read RNA-seq would likely help resolve the change in isoform usage21. While we only observed a small effect on the overall gene expression level (z-score: -1.97, fold change: 0.88, p value: 0.07; Supplementary Fig. 3B), the decreased usage of the transcript expressing the frameshift is likely due to NMD. The shift in usage to an isoform that skips the frameshift may be a compensatory mechanism for maintaining levels of PANK2 expression. The impact at the protein level remains to be seen.
Case 1049: a heterozygous canonical splice site variant was identified in intron 6 of the NSD1 gene (NM_022455.4) c.3922-1 G > C (p.?), which is associated with Sotos Syndrome. Our RNA-seq analysis detects two aberrant splicing events: The first involves skipping of exon 7 and increased usage of the resulting isoform (ENST00000375350), which is a frameshift splice isoform annotated as an ‘NMD transcript’ in the Ensembl database. However, our data shows that the NSD1 variant increased the fraction of this isoform. Overall, the levels of NSD1 expression were slightly higher in the proband relative to controls. Supporting this observation, a recent genome-wide screen for NMD escaping transcripts also identified ENST000000375350 as a NMD escaping frameshift variant20. The second splicing event involves the use of an alternative splice acceptor site 5 bp into exon 7 and is predicted to result in a frameshift (Supplementary Fig. 3C). The detection of the two aberrant transcripts suggests that they may be stable enough to be translated into a truncated protein with little residual or altered function.
Evidence for allele-biased gene expression in previously assigned disease genesWe observed allele-biased expression in two individuals:
Case 86: A heterozygous missense variant in gene SLC35A2 (NM_005660.1: c.991 G > A (p.Val331Ile)), associated with X-linked dominant Congenital disorder of glycosylation type I, showing allelic imbalance favoring the reference allele (45/69 reads, 76%). This could be due to skewed X-inactivation in different tissues, as has been previously reported22.
Case 1103: The two variants in trans in the VPS53 gene (NM_018289.3) a c.1429 C > T (p.Arg477*) and a c.1716 T > G (p.Ser572Arg), are associated with Pontocerebellar hypoplasia, type 2E. We observed allelic bias towards the p.Arg477 reference residue 392/51 reads; 76%) and the p.Ser572Arg alternative allele (39/51 reads; 76%), respectively. This suggests that NMD of transcripts harboring the nonsense variant is occurring.
Detecting gene expression outliers at disease-associated CNVsCNVs contribute significantly to rare diseases in human (e.g.23,24,25,26 and the effect of a CNV on gene expression can be detected in the general population, cancer and in rare diseases27,28,29,30,31,32,33,34. We examined the nine cases that carried diagnostic or partially diagnostic CNVs and asked if genes overlapping these CNVs show expression changes. In seven cases, these CNVs overlap one or more genes that are sufficiently detected in our cohort. Among these cases, six harbored heterozygous deletions that range from 4 kb to 1.3 Mb, overlapping 3 to 42 genes expressed in blood. In all six cases, we observed decreased expression of genes within the deleted regions as indicated by the decreased average z-score (compared to the rest of the cohort) of their expression (Fig. 2A). However, despite the consistent gene dosage change, the expression of genes within the same CNVs were not impacted uniformly (see Supplementary Data 3 for a list of outlier genes within CNVs for each sample). One individual with 22q11.2 deletion syndrome harbors the well-characterized heterozygous ~3MB deletion on chromosome 22 overlapping 137 genes. We focused on the expression of 34 protein-coding genes in this region and found that 24 of them showed decreased expression (z-score <= -3) with fold changes ranging from 0.37 to 0.69 (Fig. 2B, C, Supplementary Data 3).
Fig. 2: Modulation of gene expression by CNVs.
A Z-score summary of genes within pathogenic CNVs. Y axis: average z-score of genes in pathogenic CNVs. Each dot represents one sample. Red: sample in which the pathogenic CNV is detected. Genomic locations of CNVs are shown as panel headers and case IDs are shown below. B Z-scores of all genes on chromosome 22 in case 1034. An ideogram of human chromosome 22 is shown. The heterozygous deleted region is highlighted in grey. Gene start is used as the proxy for gene location. Genes with an absolute z-score >= 3 are highlighted in red. C Expression changes of genes within the CNV. Dot plots show z-scores and fold-changes of detected protein-coding genes within the deleted region. Color represents the expression level (log2 normalized counts) of genes in this sample. Genes are ordered by genomic coordinates.
Finally, the last CNV case (Case 1090) is an individual that carried complex X chromosome rearrangements (arr Xp22.33q21.32(60,701-91,873,757)x3, Xq21.32q28(91,877,172-155,174,078)x1) shows congenital anomalies, global developmental delay, severe intellectual disability, seizures, blindness, and deafness (Table 1). Additional clinical testing (G-banding and FISH analyses) performed on this individual indicates the presence of one normal X chromosome and one abnormal X chromosome. The abnormal X chromosome is an isodicentric X, which contains two copies of Xp22.33 to Xq21.3 with deletion of Xq21.3 to Xq28. No X chromosome material was located on another chromosome in the genome. Previous studies have shown that despite X chromosome copy number variations, most differentially expressed genes in individuals with Turner Syndrome are on autosomes (reviewed in ref. 35). To control for X chromosome copy number, we performed gene expression outlier analysis with OUTRIDER using female samples (n = 58) only. We first confirmed that this reanalysis did not change the observation of CNV-overlapping genes in the other cases (Supplementary Fig. 4A). Next, we re-examined gene expression changes in this individual. Consistent with previous reports, most genes with expression changes in case 1090 are not X-linked (7 X-linked genes /127 genes with absolute z-score > =3 or adjusted p value < 0.05, Supplementary Data 4). We found that X-linked genes within the duplicated region showed higher expression relative to the rest of the cohort, especially for p-arm genes distal to the centromere (Supplementary Fig. 4B, C). In contrast, the expression of genes within the deleted region is comparable to controls (Supplementary Fig. 4B, C), which could be explained by skewed X inactivation, which is known to occur with large structural changes on X chromosome36.
Identifying splicing and expression outliers in a cohort with no previous molecular findingsThere were 73 participants who despite traditional testing and reanalysis remained undiagnosed16,17,18. The clinical findings in this cohort included global developmental delay, epilepsy, and multiple congenital anomalies, connective tissue abnormalities, cardiomyopathy, suspected metabolic disorder, and ophthalmological or immune system abnormalities (see Supplementary Data 2). Using the information obtained from our RNA-seq analyses and discussions with clinicians, we identified plausible candidate genes related to the phenotype in five cases (Table 2):
Table 2 Candidate genes and additional variants detected in 7 caseCase 18: Decreased expression of the UGDH gene, which is associated with AR Developmental and Epileptic Encephalopathy 84, was identified as an extreme outlier (z-score –4.15, fold change 0.62, p value 7.50e−05) in a male with global developmental delay and epileptic encephalopathy (Fig. 3A). The UGDH protein is involved in the biosynthesis of extracellular matrix components and loss-of-function variants result in epileptic encephalopathy with variable degrees of developmental delay37. No variant was detected in the GS data.
Fig. 3: Aberrant splicing events and expression of candidate genes identified using RNA-seq.
A. Violin and boxplot showing normalized gene expression of selected candidate genes across the cohort. Y axis: log2 normalized read counts of the target gene in all samples in the cohort. Each dot represents one sample. Highlighted dot represents the case of interest. Case IDs are shown below each plot. Number sign: the gene is considered an outlier in the analysis (absolute z-score >=3 or adjusted p value < 0.05); asterisk: the gene is detected as a significant outlier (adjusted p value < 0.05). B. Case 1035. Sashimi plot showing an increased exon usage event in NFIX in case (red track) and control samples (blue track, n = 10, randomly selected from the cohort). Bottom left: Structures of relevant transcripts. Exons shown in the sashimi plots are highlighted with a dashed box. Bottom right: Boxplot showing the percent isoform usage (“IsoPct” from RSEM output) of the corresponding transcript across the cohort. Each dot represents a sample. Isoform usage of the case is highlighted as a triangle. Only the transcripts detected in the case are shown. C Case 1085. Sashimi plot showing an intron retention event in PTK2B. The DNA variant is shown with an asterisk.
Case 91: Decreased expression of the PPP2CA gene (Protein Phosphatase 2, Catalytic Subunit, Alpha Isoform associated with AD Houge-Janssens syndrome 3) was identified as an outlier (z-score: −3.51, FC: 0.88, p value: 6.97e−4) in a female with global developmental delay, autism spectrum disorder, epilepsy, atrial septal defects (Fig. 3A). No variant was detected in the GS data.
Case 1035: Splicing outlier analysis identified increased usage of exon 9 of the NFIX gene (NM_002501) in the blood sample obtained from a male with constitutional overgrowth, autistic spectrum disorder, pectus excavatum, and advanced bone age (Fig. 3A,B). NFIX encodes a transcription factor and is associated with AD Marshall-Smith syndrome and Malan syndrome (Sotos syndrome 2), and is highly expressed in the brain cerebellum. No variant was detected in the GS data.
Case 1085: Splicing and expression analysis identified the PTK2B gene as a candidate gene due to an intron retention event in intron 27 in a male with features of autism, behavioral issues, obesity, epilepsy and growth hormone deficiency. This intron retention is predicted to result in a frameshift (NM_004103.4) (Fig. 3A, C). The PTK2B gene showed significantly increased expression (z-score 5.97, fold change 1.68, p value 1.56e−10). A re-examination of the GS data revealed a novel variant at +1 splice donor site of intron 27 (c.2523+1 G > A) that explains the intron retention. The function of the PTK2B gene is associated with signaling neuropeptide-activated receptors or neurotransmitters and may also provide a mechanism for a variety of short- and long-term calcium-dependent signaling events in the nervous system38,39. PTK2B has been identified as a risk factor for Alzheimer’s disease by multiple studies, and the mechanism of some susceptibility alleles has been attributed to splicing alterations40,41,42. One Alzheimer’s Disease-risk allele (rs28834970-C) present in this individual is associated with higher protein expression of PTK2B in monocytes43. In the GTEx whole blood expression dataset, rs28834970-C is also associated with moderately increased expression of PTK2B44. This raises the possibility that the individual’s phenotype is the result of two independent molecular events where the common disease-associated SNV (rs28834970-C) upregulates the expression of the aberrant frameshift containing transcript. Since it was not possible to phase these variants, the relevance of this proposed mechanism remains to be seen.
Case 1101: Decreased expression of the B4GALT2 gene (UDP-GAL: beta-GlcNac beta-1,4-galactosyltransferase, polypeptide 2) gene was found in blood isolated from a male with profound global developmental delay, spastic quadriplegia and acute rhabdomyolysis (z-score: −3.40, FC: 0.45, p value: 8.30e−4) (Fig. 3A). Although the B4GALT2 gene shares 55% amino acid identity with the B4GALT1 gene, which is associated with Congenital disorder of glycosylation, type IId, the role of B4GALT2 in disease is not known, and further analysis will be required to understand the possible role of the aberrant expression of the gene and the role it may play in relation to the phenotype of this individual. No variant was detected in the GS data. Overall, the application of RNA-seq to cases with no DNA findings resulted in candidate genes related to participant phenotypes in 5 out of the 73 cases.
We identified two cases where RNA-seq provided an alternative diagnosis or additional variants of interest:
Case 87: In a male with history of hypertrophic cardiomyopathy, short stature, developmental delay, and distinctive facies in keeping with Noonan syndrome, we detected increased usage of a 117 bp exon within intron 16 of the LZTR1 gene which is predicted to result in an in-frame insertion of 36 amino acids (NM_006767.4; Fig. 4A). Within this exon, we also detected an alternative splice acceptor site that is predicted to result in a premature stop site (Fig. A). We identified a homozygous rare deep intronic variant c.1943-351 G > C that is likely the cause of these two aberrant splicing events. All of the RNA-seq reads aligning to this exon originated from this variant. Although an EPG5 variant had been detected by GS (Supplementary Data 2), this LZTR1 finding was a stronger match to the individual’s clinical presentation and was considered diagnostic.
Fig. 4: Aberrant splicing events and expression of candidate genes identified using RNA-seq.
A Case 87. Sashimi plot showing the inclusion of a rarely used exon within intron 16 in LZTR1 and violin plot showing the decreased expression of LZTR1. Models of relevant isoforms are shown below. B Case 1058. Sashimi plot showing an exon inclusion event in CEP120 and a violin plot showing decreased expression of CEP120.
Case 1058: We detected a significant decrease in the expression of the SON gene (z-score −3.50, fold change 0.80, p value 6.00e−04) and no effect on splicing in blood obtained from a male who presented with global developmental delay, hypoplastic toes, syndactyly and macrocephaly (Fig. 4B). We also detected the SON (NM_138927.2) c.3476del (p.Pro1159Arg*9) variant, associated with AD ZTTK syndrome, which was independently identified during DNA re-analysis of the case18. This demonstrates the ability of an RNA-first approach to detect clinically relevant RNA events even if the DNA variant is not known at the time of analysis. We also identified another candidate gene CEP120, which is associated with Joubert syndrome45, with a novel exon between exons 18 and 19 (Fig. 4B) and decreased expression (z-score −4.54, fold change 0.76, p value 4.15e−7). No DNA variants were identified in the GS analysis. However, it has been demonstrated that a 57 bp deletion overlapping a pair of Tigger4 transposons within intron 17 causes expression of this novel exon46. We see evidence of this deletion in the RNA-seq data, but the zygosity is unclear (Supplementary Fig. 5). The SON protein regulates the splicing of centriolar protein genes, including CEP13147. It is possible that SON also regulates the splicing of CEP120, together with the CEP120 intronic deletion, resulting in the observed reduction in gene expression and potentially contributing to the complexity of the individual’s phenotype.
Comments (0)