
Remember me
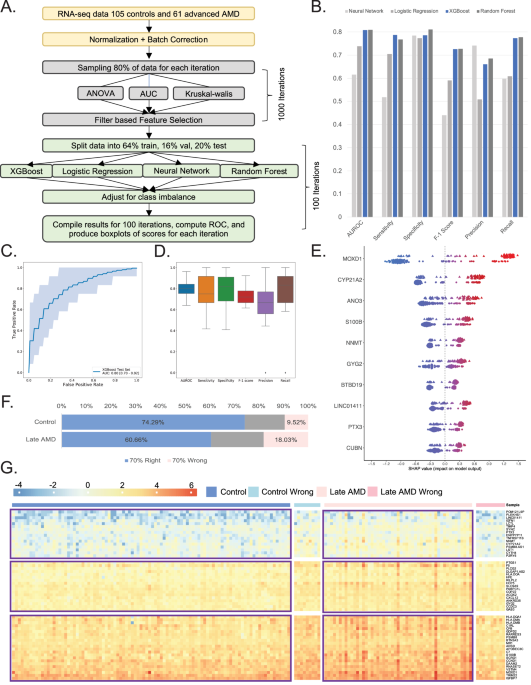
Transcriptome data often suffers from the “curse of dimensionality” as tens of thousands of genes can be profiled in a single RNA-seq experiment vs the limited number of subjects. Thus, we developed a pipeline (Fig. 1A) to reduce the dimension and improve the efficiency and interpretability of downstream analyses using 105 controls and 61 advanced AMD samples13. We implemented three feature selection methods, ANOVA (analysis of variance) F-test, AUC (area under the curve), and Kruskal-Wallis test to identify the most relevant features. We divided the dataset into an 80% training set and a 20% testing set. We used the training set to identify the most influential features within the training data and evaluated the model’s performance on the separate 20% testing data, employing appropriate evaluation metrics. Comparing the features of top the 100 features identified across 1000 iterations selected by each method, we identified 81 genes (referred as ML-genes) that were common across three methods (Supplementary Fig. 1).
Fig. 1: A flow-chart of ML-pipeline, models performance and results of late AMD classification.
A Schematic representation of Machine Learning pipeline, consisting of three main parts: normalization and batch correction, feature selection, and model building. B Bar plot comparing each model’s statistics when used to classify between AMD cases and controls. Different colors represent the models built using logistic regression, random forest, neural networks, and XGBoost separately. C An ROC plot showing the performance of the XGBoost model using default parameters. The closer the curve is to the top left corner, the more accurate the model will be at classifying cases and controls. The numbers presented at the bottom right represent the averages of 100 iterations of XGBoost models. D Boxplot showing the distribution of statistics (AUC, Sensitivity, Specificity, F-1 score Precision and Recall) generated across the 100 iterations. E Feature importance plot using SHAP analysis swarm plot showing the underlying weights of the top 10 genes for each sample. For each gene, the top swarm line shows the distribution of weights for AMD samples, while the bottom lines show the same information for Controls. The x-axis represents the SHAP value score each observation has within a gene. Observations are assigned colors corresponding to the range of gene expression, with dots (controls) and triangles (cases) closer to blue indicating lower gene expression values and those closer to red signifying higher gene expression values. F Bar plot showing the distribution of samples being classified correctly 70% or more of the time, or samples being classified wrongly 70% or more of the time. The sections are identified as blue and pink respectively. Grey sections are for samples not making the right and wrong predictions cutoff. G Heatmap showing the gene expression of selected ML-genes (as rows) and 166 samples (as columns) divided into 4 groups: Controls, Controls being predicted wrong 70% or more of the time, Cases, Cases being predicted wrong 70% or more of the time.
Next, we applied four ML-based models: neural network, logistic regression, eXtreme Gradient Boosting (XGB), and random forest for the classification model for AMD based on 81 ML-genes. We randomly portioned the data into 64% training (to learn potential underlying patterns), 16% validation (to tune the model’s performance across different hyperparameter choices) and 20% (to evaluate our model’s prediction performance) external test sets. The optimal threshold for classification was determined by Youden’s J statistic20. We evaluated classifier training and discrimination performance in 100 iterations of repeated randomized data splitting to ensure the robustness of the model and obtain confidence intervals. The AUC-ROC of other methods varied from 0.61 (CI 0.5–0.73) for Neural Network to 0.81 (CI 0.71–0.92) for random Forest (Fig. 1B) (Supplementary Fig. 2). XGB was found to perform the best with AUC-ROC statistic (0.80, CI 0.70–0.92) (Fig. 1C) and highest sensitivity (0.78) (Fig. 1D). Thus, we applied XGB for all further analyses.
To test the robustness of the 81 ML-genes identified in our study, we conducted comparisons of model performance using four additional gene lists: (1) Genes within 500KB of the 34 AMD-GWAS loci9 (2) High confidence AMD genes, comprising genes from the 34 loci with established connections to AMD through rare variant discovery or eQTL analysis (3) Genes deemed relevant to macular degeneration pathogenesis in the literature that emerged from extensive PubMed searched as previously described13 and (4) 48 genes identified through 1000 iterations of label shuffling, with control and AMD labels randomized. The performance of 81 features was superior compared to the genes within GWAS loci (AUC-ROC = 0.72, CI 0.58–0.84), high-confidence genes (AUC-ROC = 0.64, CI 0.50–0.77), literature (AUC-ROC = 0.69, CI 0.56–0.84) and, shuffled, i.e., permutation testing (AUC-ROC = 0.60, CI 0.45–0.75) (Supplementary Fig. 3A–D). 48 genes identified in the permutation testing showed no overlap with the set of 81 genes and performed poorly on both the true and shuffled labels (Supplementary Fig. 4). These results further emphasize the specificity of the 81 genes associated with AMD.
We next used SHAP (Shapley Additive exPlanations)21 to explain our best transcriptome-based AMD predictions by computing the contributions of each feature (gene) to that prediction (i.e., rank feature importance on classification). Shapley values indicate the contribution of every feature, i.e., gene expression value, towards the prediction for every individual sample, i.e., patient or control, vis-a-vis an average prediction. A positive Shapley value for a feature in each sample indicates that the feature value is favoring the prediction of the sample as the disease class with the magnitude of the Shapley value indicating the strength of how much it favors the prediction. A negative Shapley value for a feature in each sample can be considered vice versa. The results showed that high gene expression of MOXD1 in AMD (red, triangle) and low gene expression of MOXD1 in controls (blue, dots) contributed most to the model prediction. The trend was similar for the top 10 genes (Fig. 1E).
Gene expression variation within humans arises from a complex interplay of genetic, environmental, and epigenetic factors. Furthermore, AMD manifests with a wide array of clinical presentations, encompassing both dry and wet forms, each exhibiting varying rates of disease progression and degrees of visual impairment. Thus, we next set out to identify whether such heterogeneity existed at the molecular (transcriptome) level. To achieve this, we harnessed the predictive capacity of the XGB model, training it on our dataset through 100 iterations of repeated randomized data splits. We compared the predicted labels against the actual ground truth (disease vs. control status) to uncover patterns. We systematically identified samples for which the predicted labels consistently aligned or deviated with the true labels in over 70% of instances. We categorize these samples into two groups: the “70% right” group, comprising instances where predictions align with true labels, and the “70% wrong” group, encompassing instances where predictions deviate from true labels. Notably, our analysis revealed a distinct pattern: a higher proportion of control samples (74%) exhibited accurate labeling compared to AMD samples (60%) (Fig. 1F). This discrepancy was further highlighted by the observation that nearly twice as many AMD patients were subject to mislabeling (18%) compared to only 9% of control subjects (Fig. 1F). Additionally, the performance of XGB was significantly improved (AUC-ROC = 0.94, CI 0.86–0.91) when 70% wrong samples were excluded from the analysis (Supplementary Fig. 5). This suggests that while heterogeneity exists within both groups, its manifestation is notably more pronounced within the disease population. These differences could not be attributed to age as within the same age range, there were several normal and AMD patients that were predicted accurately (Supplementary Fig. 6A). Next, we compared the top 2 risk alleles for AMD in CFH (Y402H; rs1061170) and ARMS2 (A69S;rs10490924) as well as the polygenic risk scores (PRS) based on 52 known common risk factors across 34 loci9 (Supplementary Fig. 6C, D). We observed an expected, significant difference in CFH and ARMS2 risk alleles and PRS in all samples, and 70% right group. This difference was notably absent in the 70% wrong group (Supplementary Fig. 6E). These results suggest a potential involvement of genetic risk factors in shaping the molecular landscape of the disease in AMD. It’s important to note that the sample size remains small within the 70% wrong group (consisting of 10 controls and 11 AMD cases), underscoring the need for validation within larger cohorts. A heatmap of 81 ML-genes when plotted in these four groups (70% right AMD and controls, and 70% wrong AMD and controls) highlights the distinct gene expression patterns with the gene expression profiles within the 70% wrong group aligning closely with their predicted labels (Fig. 1G).
Gene co-expression network-based analysis connect the ML-genes to AMD-relevant pathwaysTo gain further insight into the biological significance and relationships among the 81 genes, we utilized Weighted Gene Co-expression Network Analysis (WGCNA), known for its ability to associate gene co-expression modules with specific biological functions and pathways22. WGCNA analysis was done using transcriptome data from 453 human retina and identified 44 modules and used GO analysis to identify the top biological pathways associated with these modules. We observed that majority of the (62/81) ML-genes were enriched within three modules associated with immune response (turquoise, p-value = 2.07 × 10⁻⁶), extracellular matrix organization (ECM) (tan, p-value = 5.16 × 10⁻¹⁹), and complement (magenta, p-value = 3.45 × 10⁻¹⁹) pathways (Fig. 2A). These results are particularly interesting because of the putative role for these pathways in the pathogenesis of AMD12,23. Additionally, these modules also harbor three known AMD-GWAS genes, C3 and COL8A1 (tan) and CFB (magenta)23. FBLN124 and MOXD113 were particularly interesting for their implicated role in AMD. Additionally, we find several ML-genes involved in complement pathway such as C7, C1S, C1R and C1RL that have not been associated with AMD. Next, we assessed the module trait correlation across normal and AMD patients to identify the gene networks associated with the disease (Supplementary Fig. 7). Notably, all three ML-enriched modules exhibited a positive correlation with AMD and the eigengene for these modules demonstrated increased expression levels between normal and AMD (Fig. 2B).
Fig. 2: Gene co-expression network analysis to connect ML-genes to disease pathways.
A Table representing the number of ML genes included in the modules, the p-value of the enrichment, the correlation value between the module’s eigengene expression profile and the AMD status of the samples, and the correlation p-value. The color in each correlation cell corresponds to the correlation value on the scale provided at the top of the table. Notable, immune Response ranks highest in correlation to a patient being diagnosed with AMD. B Boxplot showing the eigengene value of each module between cases and controls. Next to the boxplots are the subset of 81 ML-genes that were identified as part of the top 10 hub genes within those modules. C Heat maps illustrating the correlation values between 81 ML-genes and known AMD-GWAS genes, categorized into control and AMD groups. ML-genes with a correlation value ≥ 0.7 with any known AMD genes in the AMD sample group are included. That list of genes was used to generate the heatmap for the Control group. D Module Preservation plot showing the preservation of gene composition in immune response and ECM modules from the control network in the late AMD network. The module enriched for complement pathways was weakly preserved in the AMD network. E Hierarchical cluster dendrogram of control and AMD co-expression networks. Each black branch (vertical line) corresponds to one gene. The color rows below the dendrogram indicate module membership showing the labels of genes in the Immune Response (Black), ECM (pink), and Complement (lightgreen) from the AMD network when matching with their labels in control network. F A Cytoscape visualization of the top 20 hub genes and their top 10 connections to other genes. Round nodes are the top 20 hub genes while rectangular nodes depict connected genes. ML-genes are highlighted in pink, and known AMD-GWAS genes are highlighted in green. Connections between genes are color-coded, with purple indicating stronger connections, while blue represents weaker connections.
Expression correlations are often used to infer functionality and regulatory relationships within specific biological contexts. As we did not observe many known AMD-GWAS genes in 81 ML-genes, we further explored the functional relationship between known AMD-GWAS genes with the ML-genes identified in this study between controls and AMD patients’ transcriptome data. We observed a strong correlation (r2 > 0.7) in cases compared to controls with eight known AMD-GWAS genes correlated with 70/81 ML-genes (Fig. 2C, Supplementary Fig. 8) in late AMD whereas in controls only 2 known AMD-GWAS genes were correlated with 7/81 ML-genes (Supplementary Fig. 9). Additionally, these correlations exhibited statistical differences between cases and controls for most ML-genes (Supplementary Fig. 8). In comparison, in random set of 81 genes, a much smaller number of genes showed correlation, and they were comparable in cases (20/81) and controls (25/81) (Supplementary Fig. 10). Furthermore, and even fewer of these correlations were statistically different between cases and controls (Supplementary Fig. 11). Taken together, these findings demonstrate that there is an enhanced positive correlation and thus by extension functional relationship between the expression ML-genes with known AMD-GWAS genes in AMD transcriptomes.
Next, we analyzed the preservation of the three modules enriched for ML-genes in normal and AMD networks using the density and connectivity-based preservation statistics available within the modulePreservation in WGCNA. The overall measure of preservation was defined as Zsummary (Fig. 2D, E). The two modules that functionally annotate to immune response and ECM were well preserved between controls and AMD (Zsummary >10). However, the module enriched for complement pathway genes was found to be weakly preserved (Zsummary = 4.47)25. Next, we identified the top 20 most connected genes (hub genes) and their top 10 connections within the complement module from controls and AMD using WGCNA. We identified two ML-genes (C1R and C1RL) as hub genes in controls, whereas AMD network has six ML-genes (PSMB8, PSMB9, PSMB8-AS1, B2M, HPC5, HLA-B) as hub genes (Fig. 2F). These findings suggest these genes within complement pathways are modulators of immune activity in the retina that play an important role in pathogenesis in AMD.
AMD disease progression has shared and unique gene signaturesAMD is a progressive disease with early, intermediate, and late stages of the disease. Early/intermediate AMD is the most common and asymptomatic form, characterized by pigmentary abnormalities in RPE of the macular region and accumulation of extracellular aggregates of proteins, lipids and cellular components (called drusen). Vision loss happens in the late stage, which is usually subdivided into dry (geographic atrophy, or GA) and wet (choroidal neovascularization, or CNV) forms26. The symptoms of AMD worsen over time, although the rate at which the disease progresses varies and not all patients with early/intermediate AMD develop late disease. In the United States alone, over 1.75 million people have late stages of AMD, and 7.3 million people are affected with intermediate stages which are at the risk of developing late AMD6. However, there is a paucity of studies on the early and intermediate stages of AMD, and as a result, there are no reliable biomarkers for predicting the disease progression. Thus, we next applied the ML pipeline developed for late AMD in early (n = 175) and intermediate (n = 112) AMD to identify the molecular events that lead to AMD. We identified a set of 57 genes for early AMD that provided AUC-ROC statistic of 0.62 (CI 0.51–0.74) (Fig. 3A), whereas a set of 62 genes gave AUC-ROC statistic of 0.71 (CI 0.59–0.83) for intermediate AMD (Fig. 3B). The relatively modest performance of these models can be attributed to subtle alternations in gene expression during these initial stages, where vision loss or cell death in early and intermediate stages is not yet prominent. Thus, we next tested the performance of the features identified in early and intermediate AMD in late AMD. This analysis showed notable enhancement in predictive power with the 57 early AMD-associated genes, leading to an AUC-ROC statistic of 0.74 (CI 0.58–0.86) (Fig. 3C). Conversely, the performance remained comparable for the intermediate stage (AUC-ROC = 0.72, CI 0.58–0.89) (Fig. 3D). For both stages, the performance of the features selected based on shuffled label did not perform well (Supplementary Fig. 12). These findings are also consistent with a lower sensitivity as well as a higher proportion of early (29%) (Fig. 3E) and intermediate AMD (27%) (Fig. 3F) deviating from their ground truth prediction. Thus, it is likely that intermediate AMD might have distinct molecular underpinning that does not represent a transitional stage between early and late AMD. This was also reflected in the expression correlation of the candidate genes with known AMD-GWAS genes. 81 ML-genes identified in the late AMD showed higher correlation in early AMD compared to the intermediate AMD (Supplementary Fig. 13). Similarly, early AMD 57 gene signatures also showed higher correlation with late AMD and not intermediate AMD (Supplementary Fig. 14). However, the gene identified in intermediate does not show correlation with known AMD genes in any stages (Supplementary Fig. 15). Importantly, genes identified across both early and intermediate stages were enriched within modules associated with immune response and ECM pathways (Fig. 3G, H). While there exists a limited overlap in genes identified among the three disease stages of AMD, they manifest enrichment within identical modules associated with AMD-relevant pathways. This underscores that majority of AMD-progression response includes signatures reflecting immune response dysregulation, indicating a shared biological basis.
Fig. 3: Performance ML methods in classifying early and intermediate-stage AMD.
A ROC and box plots illustrating the outcomes of classifying control and early AMD samples across 100 iterations using a set of 57 genes generated by the XGBoost model. B ROC and box plots display the outcomes of classifying control and Intermediate AMD samples across 100 iterations using a set of 62 genes generated by the XGBoost model. C ROC and box plots illustrate the notable enhancement in predicting late AMD outcomes by employing the XGBoost model across 100 iterations with 57 genes selected for Early AMD and control samples but applied to distinguish late AMD samples from the controls. D ROC and box plots demonstrate that utilizing the XGBoost model across 100 iterations with 62 genes associated with intermediate AMD did not improve performance in predicting late AMD outcomes. E A bar plot displays the distribution of early AMD and controls classified correctly 70% or more of the time (blue), or samples classified wrongly 70% or more of the time (pink). Grey sections represent samples that do not meet the criteria for either correct or wrong predictions. F Bar plots distribution for the intermediate AMD. Only ~40% of the intermediate AMD samples are predicted right compared to the ~70% of the controls. G Table demonstrating the enrichment of 57 early AMD genes within co-expression network modules associated with immune response and extracellular matrix (ECM) pathways, as determined by userListEnrichment within WGCNA. H A table depicting the enrichment of the same pathways for the 62 intermediate AMD genes.
ML-genes are expressed within specific cell types in retina that are impacted in AMDOur RNA-seq data was performed at the tissue level and yielded an average of gene transcript abundance that reflects the average signal from mixtures of cell-type-specific gene expression levels. This is particularly relevant for tissues characterized by a highly heterogeneous cell type composition, such as the retina, which is made of six different cell types27. To understand the role of AMD-relevant cell type, we built a reference for the average expression of retinal cell types using cell-type specific markers28 from six human retinas across three different studies29,30,31 (Supplementary Table 1). Next, we implemented three distinct methods- CIBERSORTx32, dTangle33, and BayesPrism34—to deconvolute the cellular composition of both control and AMD samples. Subsequently, we applied student t-test to identify the cell types exhibiting significant changes associated with the disease, revealing astrocyte, microglia, Müller glia, and rods proportion to be significantly different between normal and late AMD (Supplementary Fig. 16). Microglia, astrocyte, and Müller glia proportion increase in the disease whereas the proportion of rods decreases (Fig. 4A). The decrease in the rods is observed only in the late stage, which could be the results of aging35,36 as well as disease-related photoreceptor degeneration37. Notably, microglia were the only cell type that significantly changed in cell proportion across all stages of AMD, while alterations in astrocyte proportion were confined to early and late AMD stages. (Fig. 4A). The three tools used differ in their underlying algorithms, input requirements, and output formats. However, all of them point to the involvement of microglia in AMD, suggesting microglial activation and increased immune activity begin in early AMD much before the onset of photoreceptor loss in late AMD.
Fig. 4: Expression of ML-genes across various retinal cell types and their alterations in AMD.
A Violin plots illustrating the cell fraction of various cell types in deconvolution results from 453 bulk RNA samples, utilizing a single-cell RNA dataset as a reference. P-values are annotated to indicate significant differences in cell fraction ranges between Control and different AMD stages. P-values are omitted when they exceed 0.05, indicating a lack of statistical significance. B A heatmap illustrating the average gene expression of 81 ML-genes (as rows) across 11 retinal cell types (as columns). The color gradient indicates whether genes are predominantly expressed (positive value, yellow) or minimally expressed (negative value, purple) in a particular cell type. Most ML-genes are expressed in astrocytes, microglia and Müller glia. C Box plots showing the differences in ML-gene expression between 20 normal and 20 AMD single nuclei data across astrocytes, microglia, and Müller glia. The selected genes are those that have successfully passed Differential Expression analysis utilizing DESeq2 with a false discovery rate (FDR) threshold of 5%. D Volcano plot showing differentially expressed ML-genes within microglia, with eleven genes (one upregulated, ten downregulated) passing the DE threshold of Log2 fold change of 0.25 or higher and FDR 5%. E Volcano plot showing differentially expressed genes within astrocytes. Two upregulated and two downregulated passing the DE threshold of Log2 fold change of 0.25 or higher and FDR 5%. F Volcano plot displaying significant ML-genes within Müller Glia (three upregulated and six downregulated) using the same threshold as mentioned above.
To validate the results of the deconvolution, we analyzed single-nuclei data from 20 controls and 20 late AMD patients from four published studies (Zenodo 753211538, GSE22104239, GSE20843440 and GSE203499) (Supplementary Table 2, Supplementary Fig. 17). Microglia cluster was further subdivided into microglia, perivascular macrophages, monocyte-derived macrophages and monocytes based on the top differentially expressed genes identified in human donor retina data from a recently published study40, as well as cell-type specific markers genes40,41,42,43,44 (Supplementary Fig. 18). A heatmap of 81 ML-genes across retinal cell types showed that majority of them were enriched in their expression in microglia, astrocytes, Müller glia (Fig. 4B). In addition, identified several ML-genes (21/81) that were differentially expressed across microglia, astrocyte and Müller glia (Fig. 4C). In microglia, 11 genes were differentially expressed (one upregulated, ten downregulated (Fig. 4D). In astrocytes, four gene were differentially expressed (two upregulated and two downregulated) (Fig. 4E). For Müller glia, three genes were upregulated and six were downregulated (Fig. 4F). In addition, several known AMD genes including APOE and VEGFA were also found to be differentially expressed within glial population of normal and AMD patients (Supplementary Table 3). These findings collectively provide support for the consistency and validity of the genes identified using the ML approach and cell types identified using the deconvolution method in an independent dataset, reinforcing the relevance of the identified gene expression alterations in the context of AMD.
AMD signature genes are enriched for AMD associated variantsComparing transcript levels between healthy and diseased individuals cannot separate the cause vs consequences of the disease under scrutiny. Thus, we resorted to the published AMD-GWAS data on late AMD, comprising 16,144 patients and 17,832 controls9 as well as early AMD data consisting of 14,034 cases and 91,214 controls45 to access the potential association of genetic variants within ML-genes with AMD. The Quantile-Quantile (Q-Q) plot in late AMD-GWAS data (Fig. 5A) showed the largest deviation from the null p-value of the ML-genes identified in late AMD (red line) followed by early AMD (green line) suggesting that a subset of the ML-genes had genetic variants associated with AMD. In early AMD data, the gene identified in early AMD showed the largest deviation (green line) succeeded by late AMD (Fig. 5B). Interestingly, neither dataset exhibited apparent deviation for intermediate AMD (indicated by the blue line) (Fig. 5A, B). Furthermore, the ML-genes within the WGCNA modules enriched for complement and ECM organization individually also showed enrichment within late AMD-GWAS (Fig. 5C). By applying a suggestive association threshold (p-value < 5 × 10⁻⁵), we identified two candidates, PLCG2; rs4133124, p-value = 2.59 × 10⁻⁶ (Fig. 5D) and IGFBP7; rs1718877, p-value = 2.83 × 10⁻⁶ (Supplementary Fig. 19A) for late AMD and USP7; rs1471435, p-value = 7.27 × 10⁻⁶ (Supplementary Fig. 19B) and NEIL1; rs11634109, p-value = 4.27 × 10⁻⁵ (Supplementary Fig. 19C) for early AMD.
Fig. 5: ML-genes are enriched for AMD-associated variants.
A Quantile-quantile (Q-Q) plot using summary statistics data from late AMD demonstrates a greater deviation from the null distribution (solid black line) for ML-genes identified in early (green dots) and late AMD (red dots) compared to intermediate AMD (blue dots). B Q-Q plot using the early AMD data reveals similar but less pronounced trends across early, intermediate, and late AMD. C Q-Q plot for the 81 ML-genes, further segregated into 3 groups based on the modules identified in the WGCNA network, also demonstrates deviation for the complement (purple dots) and ECM pathways (tan dots), but not for the immune response (turquoise dots). D Regional association plot generated using LocusZoom plots displays the most strongly associated SNP, rs4133124 (purple diamond), along with other suggestively associated SNPs (p-value < 5 × 10⁻⁵) within the intron of PLCG2. E A schematic representation of the luciferase assay, and the relative locations of the six SNPs around PLCG2 that were tested in the assays. F The luciferase assay results for four constructs (E30-E33) indicate that construct E31, which contains rs4133124, exhibits a 3.5-fold increase in luciferase activity compared to the empty vector in HMC3 and a 2.2-fold increase in ARPE19. Error bars represent the standard error of the mean (SEM) calculated from three independent experiments. G eQTL violin plots sourced from GTEx to illustrate the correlation between the SNP rs4133124 and PLCG2 gene expression specifically within the hippocampus region of the brain. H The UCSC Genome Browser graph displaying custom tracks from human retina, astrocytes, and ARPE19 cells shows the overlap of rs4133124 with open chromatin regions of AMD-relevant tissues and cell types. Additionally, the genomic region spanning rs4133124 shows conservation in primates as highlighted through multi-species alignment.
Next, we accessed the functional relevance of the suggestive associated SNPs, we selected four genomic regions spanning six SNPs around PLCG2 and six genomics regions spanning seven SNPs around IGFBP7 (Supplementary Table 4). We cloned these elements upstream of a minimal promoter-driven firefly luciferase gene in pGL4.23 (Fig. 5E) and tested for enhancer activity of the elements in the human microglia cell line, HMC3 and human RPE cell line, ARPE19. We identified that one element spanning rs4133124 within PLCG2 showed 3.5- and 2.2-fold higher luciferase activity compared to the empty vector in HMC3 and ARPE19, respectively (Fig. 5F). We also tested the effect of reference T allele with the alternative G allele but found no change in enhancer activity in the rs4133124 region (data not shown). Additionally, this variant has been identified as an eQTL for PLCG2 in hippocampus in the GTEx data (Fig. 5G)4. We did not find this eQTL in the retina (data not shown), which could be attributed to small proportion of glial cell in the bulk retina data13. The variant, rs4133124 reside in the intronic region, which is highly conserved in primates, but not in mice (Fig. 5H). It is noteworthy that macular degeneration is also caused by the degeneration of photoreceptors and underlying RPE in the central region called macula, which is a primate specific structure46. Additionally, this variant resides within the open chromatin region in retina, ARPE19 and astrocyte shown as custom track, suggesting a regulatory role (Fig. 5H). These results suggest that including the biological context of the genes can reveal additional genetic association within current GWAS datasets.
Comments (0)