
Remember me
All phenotype data used in our initial publications12,13 was generated from patient clinic notes using the CNLP software CLiX. CLiX is a proprietary clinical NLP technology developed by the commercial healthcare analytics company Clinithink18. Given the ultimate goal of developing MPSE for adoption by diverse hospital and clinic systems, we sought to determine MPSE’s performance using phenotype data produced by other tools as well. We conducted a series of analyses on 5 different CNLP tools to compare their relative utility for use with MPSE: ClinPhen19, CLiX, cTAKES20, MedLEE21, and MetaMapLite22. A brief description of these tools is given in Supplementary Table 1. Before assessing MPSE’s performance using phenotype data produced by these different CNLP tools, we first compared the phenotype descriptions (HPO term sets) generated by these tools using the same sets of clinic notes—in this case, the notes from 1838 University of Utah NICU admits.
Term countsSummary statistics for unique HPO term counts generated by each CNLP tool as well as the “manual” term sets identified by expert physicians are given in Supplementary Table 2. The HPO term sets used throughout this work were pre-processed by removing parent terms to keep only the most specific phenotype terms. In every case, the CNLP tools all produced larger HPO term sets per patient than did expert review. Among HPO term sets for the University of Utah NeoSeq patients, MedLEE yielded the fewest terms (average 31.4 terms per patient) while CLiX yielded the most terms (average 111.2 terms per patient), nearly twice as many as the next most prolific tool cTAKES (70.5 terms per patient). Unsequenced University of Utah NICU patients had significantly fewer terms in their phenotype descriptions than NeoSeq patients, consistent with our observations from other patient cohorts12.
Semantic similarityWe also calculated pairwise semantic similarity coefficients across all the NeoSeq phenotype sets. Semantic similarity is different from strict identity-based similarity measures, such as unweighted Jaccard similarity, in that two terms can be non-identical but still contribute positively to the similarity coefficient if they are neighbors, i.e., they lie near one another in the HPO directed acyclic graph. To estimate the probability that the semantic similarities of the term sets produced by the tools are statistically different from a null or random distribution, for each pairwise comparison, we sampled the HPO to yield two random term sets with sizes identical to the original sets. Semantic similarity coefficients were then calculated for these randomized sets and plotted alongside the real data in Supplementary Fig. 1. The pronounced separation between semantic similarity distributions of real and simulated data suggests the HPO term sets produced by the tools reflects a common underlying phenotypic reality that is being identified to a greater or lesser degree by all the tools. Consistent with this, the difference in mean similarity between real and simulated datasets is highly statistically significant for every tool by Student’s paired T-test, even after multiple test corrections (data not shown).
NLP sensitivity and accuracyNext, we performed an orthogonal test of CNLP tool sensitivity and accuracy by calculating the overlap between the CNLP-generated phenotype sets and two distinct “ground truth” reference sets: expert-generated phenotypes and OMIM disease-associated phenotypes. The expert reference sets constituted the HPO term lists manually curated by physicians for the 65 sequenced University of Utah NICU patients23. The OMIM disease reference sets were restricted to the HPO phenotype terms associated with the OMIM disease diagnosis for the subset of 26 WGS-diagnosed Utah NICU patients. For these analyses, a CNLP term is considered a “true positive” if it or any of its parent terms are found in the ground truth set. This approach is justified by the ontological relationship between parent and child terms in HPO, where a child term inherently implies the presence of its parent term(s). Since HPO is structured in a manner where more specific terms (i.e., child terms) represent refined phenotypic descriptions, they subsume the more general terms (i.e., parent terms). For example, having Thrombocytosis (HP:0001894) necessarily indicates the presence of the parent phenotype Abnormal platelet count (HP:0011873).
Supplementary Fig. 2 shows sensitivity and accuracy distributions for CNLP terms sets compared with physician manual terms and OMIM disease-associated terms. The relative sensitivity among the CNLP tools roughly correlates with the tools’ average term counts (see Supplementary Table 2), which isn’t surprising; the more terms a tool generates, the more likely it will capture terms in the reference set. CLiX had the highest average sensitivity among the tools (manual terms sensitivity: 63%; OMIM terms sensitivity: 21%), while MetaMapLite had the lowest (manual terms sensitivity: 15%; OMIM terms sensitivity: 9%). The accuracy measure differs from sensitivity by controlling for the variable sizes of the CNLP term sets. Thus, a CNLP tool with high sensitivity may have a low relative accuracy if it has many more terms than another tool with lower sensitivity. ClinPhen had the highest average accuracy among the tools (manual terms sensitivity: 13%; OMIM terms sensitivity: 11%), while MetaMapLite had the lowest (manual terms sensitivity: 2%; OMIM terms sensitivity: 4%). Despite the modest sensitivity and accuracy of these CNLP tools compared to the “ground truth” sets, MPSE and other phenotype-driven clinical diagnostics tools such as GEM11, appear to be very robust against “noisy” phenotype data inputs (see next results for justification).
MPSE flexibly handles input data from a variety of sourcesTo further evaluate the practical utility of the MPSE algorithm, we conducted a comparative analysis of different CNLP tools and data types as inputs to MPSE. This analysis addresses several critical considerations for the deployment of MPSE in diverse clinical environments. First, we explored the interoperability of MPSE by assessing whether a model trained with data from one CNLP tool could reliably predict outcomes using data generated by a different tool. Second, we investigated the feasibility of using non-phenotype data with MPSE. Given the ultimate goal of developing MPSE for adoption by diverse hospital and clinic systems, the overarching purpose of these analyses is to better understand MPSE’s flexibility, robustness, and broader applicability in real-world clinical settings.
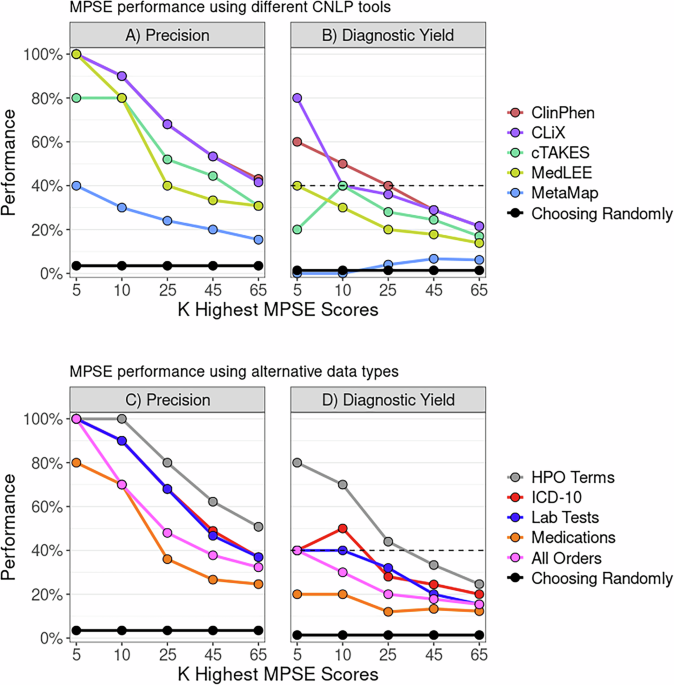
MPSE performance using different CNLP toolsTo determine whether MPSE, trained with data from one CNLP tool, can reliably predict outcomes using data generated by a different CNLP tool, we began with the original MPSE model trained using CLiX-generated phenotype data from the RCHSD cohort. This model was used to make predictions on external phenotype data from the Utah cohort generated with ClinPhen, CLiX, cTAKES, MedLEE, and MetaMapLite. MPSE’s precision and diagnostic yield among top-scoring probands is plotted in panel A of Fig. 1. Apart from MetaMapLite, all the CNLP tools’ outputs work well when used as inputs for MPSE, a fact made clear by the high recovery rates of sequenced and diagnosed patients compared to choosing patients randomly for WGS. If MPSE was used to automatically select a volume of NICU patients for sequencing identical in size to the Utah NeoSeq study (n = 65) from among the 1838 total patients screened, CLiX and ClinPhen would maintain the NeoSeq study’s physician-mediated diagnostic yield (40%) throughout the top 50% of MPSE scores. This finding accords well with our previous publication, which showed high projected diagnostic yields from MPSE prioritization12.
Fig. 1: MPSE can ingest different CNLP tool outputs and use alternative data types.
Panels A, B display MPSE precision rates of patients manually selected for WGS (Panel A) and diagnostic yield for the subset of cases diagnosed by WGS (Panel B) using different CNLP tools. A CLiX-trained MPSE model from the RCHSD cohort was applied to phenotype data from 1838 University of Utah NICU patients generated by five different CNLP tools. Panels C, D display precision and diagnostic yield using MPSE models trained on four alternative data types (diagnosis codes, lab tests, medications, and all orders), compared to the corresponding HPO-based (CLiX) model trained on the same Utah cohort. A solid black reference line in each panel represents the precision or diagnostic yield expected from a model that chooses candidates at random, while the black dashed line in the diagnostic yield graphs (Panels B, D) indicates the NeoSeq study’s 40% total diagnostic yield. Figure generated with R ggplot2 software.
In addition to assessing yield among top-scoring probands, we also calculated cohort-wide performance metrics (see Supplementary Table 3). After the “native” CLiX data, ClinPhen yields the next-best overall predictions, with an average 20.7-point difference in MPSE score between cases and controls (p = 2.2e−14), the highest area under the ROC curve (AUROC = 0.91), and the highest area under the PRC curve (AUPRC = 0.45). MetaMapLite exhibited the lowest performance, likely caused by the relative dissimilarity between CLiX and MetaMapLite as seen in the low semantic similarity coefficients of CLiX-MetaMapLite term sets (Supplementary Fig. 1).
MPSE performance using alternative data typesTo determine whether non-phenotype data types could be used with MPSE, we tested MPSE models built using diagnosis codes, lab tests, and medications and compared their predictive ability to phenotype-based models. A short description of these data types is given in Supplementary Table 4, and summary statistics of observation counts for each alternative data type are shown in Supplementary Table 5. MPSE models trained with alternative data types recovered fewer sequenced cases and diagnostic cases (Fig. 1B) among top-scoring probands than a corresponding phenotype-based model but still performed much better than a random model. Among the alternative data types, the ICD-10 based model yielded the best overall predictions, approaching the performance of the CLiX-based model (Supplementary Table 3). Our analysis suggests that non-phenotype structured data from patient EHRs is less effective than CNLP-derived phenotype data at identifying NICU sequencing candidates, but is a useful and valid substitute for CNLP phenotype descriptions if these are not available. However, it should be noted that this analysis was limited to only using the presence/absence of a lab test, medication order, etc. (see Methods) and not the test result or order specifications. An analysis using more precise laboratory and medication data may reveal higher MPSE performance when using these alternative data types.
Diagnostic performance using different CNLP toolsLastly, we assayed the ultimate utility of the CNLP-derived phenotype term sets generated by each tool for clinical molecular diagnostic activities. For these analyses, we used an Artificial Intelligence (AI)-based gene prioritization tool called GEM11. Licensed from Fabric Genomics, by both RCHSD and the University of Utah, GEM is a commercial tool that combines HPO-based phenotype descriptions with WES and WGS sequences for rapid, AI-based diagnostic decision support. GEM was used by both RCHSD and the University of Utah for the original diagnosis of every sequenced proband in the datasets analyzed here.
Comparison of GEM’s previously published diagnostic performance to the prospective Utah data reported here provides a unique opportunity both to reexamine GEM’s performance using new, orthogonal data, and to assay the impact of using different CNLP tools on GEM’s diagnostic performance. These data are shown in Fig. 2. For reference, the original GEM benchmark results using manually curated HPO term sets for 119 RCHSD probands11 have been added for ease of comparison. Figure 2 shows the percentage of diagnosed Utah NeoSeq23 probands where the clinical molecular diagnostic genotype was reported by GEM among its top 1st, 2nd, 5th, and 10th gene candidates.
Fig. 2: GEM AI performance is agnostic with respect to CNLP tool.
Bars show the proportion of diagnosed NeoSeq probands where the true causal genes were identified by GEM among the top 1st, 2nd, 5th, and 10th gene candidates. Each GEM run differed by the input HPO term lists, which were made by extracting phenotypes from patient clinical notes using CNLP (ClinPhen, CLiX, cTAKES, MedLEE, MetaMapLite) or manual physician review. The RCHSD benchmark (n = 119 patients) results from the original GEM paper are included for reference (redrawn with authors’ permission). Figure generated with R ggplot2 software.
Two major conclusions emerge from these data. First, diagnostic performance using CNLP-derived HPO data, regardless of the tool used to generate them, is nearly identical to the performance obtained using manual term sets, and second, the results shown here are highly concordant with the original published benchmarking results11. Moreover, the University of Utah data provides an entirely prospective orthogonal dataset, demonstrating transportability. These results demonstrate a powerful synergy between the MPSE approach and GEM. Namely, that the same HPO term sets used by MPSE for WGS prioritization can be directly consumed by GEM for downstream diagnoses. Moreover, Fig. 2 makes it clear that GEM can use HPO term sets, manually curated or CNLP derived, regardless of tool, without compromising downstream diagnostic accuracy.
MPSE can identify patients who would benefit from WGS within the first 48 h of NICU admissionOur initial work and that presented here has demonstrated MPSE’s ability to accurately identify sequencing candidates by aggregating information from the entirety of the patient’s NICU stay. These findings underscore the tool’s effectiveness in a retrospective context, using all notes up to the date at which the attending physicians place the order for WGS. However, the ultimate test of value lies in validating the real-time utility of MPSE. Early identification of patients who would benefit from WGS, as soon as possible after NICU admission, could significantly enhance care, enabling earlier disease diagnosis and more timely interventions2,14,15.
To measure MPSE’s real-time utility, we calculated daily MPSE scores for each patient in our Utah cohort using only HPO terms extracted with CLiX from clinical notes present in the EHR at 24-h intervals, beginning at the moment of their admission. Thus, each patient had a series of MPSE scores for each day spent in the NICU from admission to discharge. Longitudinal MPSE scores for patients who received a molecular diagnosis by WGS (diagnostic), those for whom WGS did not identify a molecular diagnosis (non-diagnostic), and patients who were not selected for WGS (unsequenced) are summarized in Supplementary Table 6 and plotted in Fig. 3 to help visualize the change in MPSE score over time among these groups. By the end of the first day (0–24 h) in the NICU, both diagnostic and non-diagnostic sequenced cases had statistically significantly higher MPSE scores than did those who were not selected for sequencing (unsequenced mean: −48.4; diagnostic mean: −32.1, p = 1.4e−5; non-diagnostic mean: −28.2, p = 9.3e−6). Additionally, diagnostic cases had significantly higher average MPSE scores than non-diagnostic sequenced cases beginning 48 h post-admission (non-diagnostic mean: −24.7; diagnostic mean: −9.0; p = 0.018) and continuing thereafter.
Fig. 3: MPSE enables automated WGS candidate identification within the first 24 h in the NICU.
Panel A shows MPSE score distributions across the first 96 h in the NICU for diagnostic (red) and sequenced but non-diagnostic (blue) patients as well as unsequenced NICU patients (green). Diagnostic and non-diagnostic sequenced patients had significantly higher MPSE scores than unsequenced patients beginning 0–24 h after admission. Diagnostic patients had significantly higher MPSE scores than non-diagnostic patients beginning at 48 h post-admission. Boxplot comparison significance levels: *** (p < 1e−5); * (p < 0.05). Panel B shows MPSE score trajectories for these groups across the first 30 days in the NICU. Solid lines show the mean MPSE score per group and the shaded regions cover one standard deviation from each mean. Panel C shows the probability of at-risk patients being classified as a WGS candidate by MPSE (i.e., MPSE score >2 standard deviations above the unsequenced mean score) as a function of time. Cox proportional hazards regression analysis confirmed the significantly increased rate of MPSE candidate selection for diagnostic and non-diagnostic patients selected for WGS compared to unsequenced patients, with hazards ratios of 18.8 (95% CI 11.6–30.6; p = 1.9e−32) and 9.8 (95% CI 6.2–15.3; p = 2.8e−23) respectively. Diagnostic patients were also selected by MPSE at a higher rate than sequenced but non-diagnostic patients (HR = 2.0; 95% CI 1.1–3.9; p = 0.03). Figure generated with R ggplot2 software.
In addition to differences in MPSE scores between unsequenced, non-diagnostic, and diagnostic patients, there are also significant differences in the daily change in MPSE score (day-N delta) between these groups. Both diagnostic and non-diagnostic sequenced cases saw greater average day-N delta than unsequenced controls throughout the first 30 days post-admission (Supplementary Table 6). Importantly, the greatest difference in MPSE score increase was observed for the day-one delta, i.e. the change in MPSE score during the first 24 h post-admission, with average diagnostic MPSE score rising by 18.4 points, average non-diagnostic MPSE score rising by 7.7 points, and average unsequenced MPSE score rising by only 2.7 points. These day-one delta differences were statistically significant for each subgroup comparison (diagnostic vs unsequenced p-value = 0.0015; non-diagnostic vs unsequenced p-value = 0.004; diagnostic vs non-diagnostic p-value = 0.027).
To gain further insight into the temporal dynamics of MPSE’s predictive capabilities across the NICU stay, we estimated the proportional risk of being identified as a WGS candidate by MPSE using Cox proportional hazards regression analysis24. The estimated probability and 95% CI of candidate selection by MPSE for diagnostic, non-diagnostic, and unsequenced patients is plotted in Panel C of Fig. 3. Using a rule-of-thumb MPSE score threshold (calculated individually for each day) of 2 standard deviations above the mean score of unsequenced control patients, diagnostic patients were flagged by MPSE at a significantly higher frequency and speed than both unsequenced patients (HR = 18.8, p = 1.9e−32) and non-diagnostic sequenced patients (HR = 2.0, p = 0.03). At 48 h post-admission, MPSE had already flagged 74% (17 of 23) of diagnostic patients, 47% (17 of 36) of non-diagnostic sequenced patients, and only 6% (100 of 1773) of unsequenced patients. Furthermore, by 9 days post-admission all diagnostic patients had been flagged by MPSE or were censored as a result of death or NICU discharge, highlighting the speed at which MPSE was able to determine correct clinical action for this group of patients. Supplementary Table 7 contains the daily score threshold, the number of candidates assessed by MPSE, and the cumulative number of patients who reached the score threshold as part of this longitudinal analysis.
Comments (0)