
Remember me
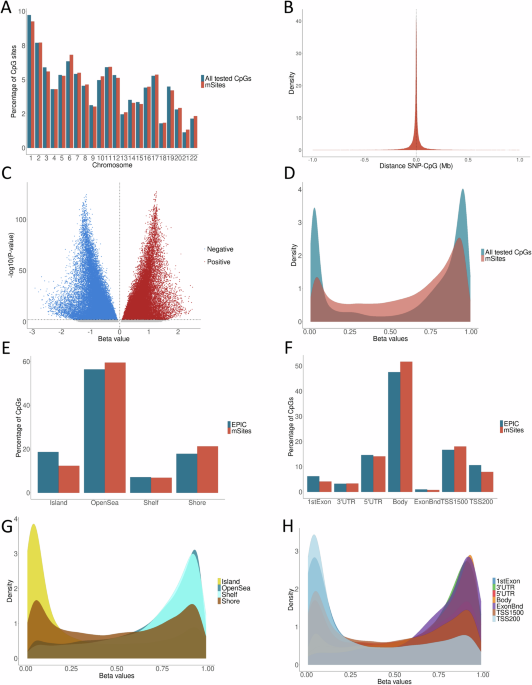
With the aim of characterizing DNAm variation in saliva, we performed a cis-mQTL analysis (n = 345), to test the association of 5,052,978 genetic variants and 736,680 CpGs in cis windows of 2 Mb. We used the APEX software23 to perform a linear mixed model including sex, age, 5 gPCs and 13 mPCs as covariates, in addition to a kinship matrix to correct for the genetic relatedness between individuals. We identified mQTLs (FDR < 0.05) for 123,451 mSites amounting to 16.76% of the CpGs included in the cis-mQTL analysis and 96,585 unique variants (SNPs and INDELs) as their top mQTLs, while 26,866 were the top mQTLs of at least two mSites. The distribution of the mSites across the autosomes did not differ significantly from that of all the CpGs tested in the cis-mQTL analysis (Fig. 1A). The mVariants were mostly located close to their corresponding mSites. Specifically, the absolute median distance between the SNPs and the CpG positions participating in mQTLs was 12.61 Kb (Fig. 1B). The percentage of mSites influenced by mVariants located 0.5 to 1 Mb upstream or downstream was 3.96%, suggesting that a larger window would not notably increase the number of the mSites discovered. In addition, 68,569 mSites were affected by an upstream mVariant and 54,883 by a downstream mVariant. Regarding the effect of the mQTLs, the DNAm of 60,264 mSites showed a positive additive effect of the 1000G24 alternative allele of their associated mVariant, while 63,187 were negatively correlated (Fig. 1C). We also plotted the mean distribution of beta DNAm values ranging from 0 to 1 for the mSites across samples. As expected, we observed a bimodal pattern, but with a higher proportion of intermediate values compared to all CpGs included in the EPIC array (Fig. 1D).
Fig. 1: Characterization of the saliva mQTL database.
A Percentage of mSites across autosomes compared to all CpGs included in the mQTL analysis. B Distance between the genetic variant and the associated CpG site. Positive values indicate that the SNP is located downstream of the CpG, while negative values indicate that it is upstream. C Volcano plot showing all tested CpGs, with effect sizes on the x-axis and -log10 P-values on the y-axis. Red dots represent positive beta effect sizes, blue dots indicate negative beta effect sizes, and gray dots represent non-significant associations. D Distribution of the mean DNAm values of mSites across samples, compared to all CpGs included in the EPIC array. E Percentage of mSites in relation to CpG islands, compared to all CpGs in the EPIC array. F Percentage of mSites related to gene-associated genomic features, compared to the CpGs included in the EPIC array. G Distribution of the mean DNAm values of mSites, color-coded by their relation to CpG islands. H Distribution of the mean DNAm values of mSites, color-coded by gene-associated genomic features. All graphs used to represent QTL characteristics were created with the open-source ggplot2 R package (https://ggplot2.tidyverse.org).
To determine whether the mSites were enriched or underrepresented in different types of genomic regions, we assessed their distribution with respect to the location of CpG islands and genes and compared this to the distribution of all CpG sites included in the Illumina array. In particular, mSites were enriched in open sea (P-value = 3.09 × 10−97), CpG island shores (P-value = 1.44 × 10−182), gene bodies (P-value = 5.87 × 10−133), and TSS1500 (P-value = 4.35 × 10⁻²⁶), while were depleted in CpG islands (P-value < 2.20 × 10⁻¹⁶) and shelves (P-value = 0.003), first exons (P-value = 6.24 × 10−156), 5’UTR (P-value = 3.98 × 10−06), exon boundaries (P-value = 5.65 × 10⁻¹⁰) and TSS200 (P-value = 9.67 × 10−152) (Fig. 1E, F). Furthermore, the lowly methylated CpG sites were mainly located in CpG islands, first exons and TSS200, while the highly methylated sites were significantly increased in open sea, shelves, gene bodies, exon boundaries and 3’UTR (Fig. 1G, H).
In addition to the mSite database with multiple testing corrections applied at both CpG and variant levels, a nominal cis-mQTL database including all CpG-variant associations was also generated for use in downstream analyses. Finally, we constructed nominal sex-stratified mQTL databases (140 males and 205 females) to perform downstream analyses with sex-specific traits. All databases are available at the following link: https://irlab.shinyapps.io/salivaQTL/.
The saliva eQTL databasesWe also constructed eQTL databases at both gene and transcript levels. Briefly, 277 samples were included, and the associations between genotype (5,052,978 variants) and expression data (38,040 genes and 84,112 transcripts) were tested using APEX in a cis window of 2 Mb. The linear mixed model included sex, age, RNA-seq batch, 5 gPCs, 45 PEER factors and the kinship matrix. We identified eQTLs (FDR < 0.05) for 1717 eGenes, accounting for 4.51% of the tested genes, and 1770 eTranscripts, comprising 2.10% of the tested transcripts, associated with 1425 and 1484 unique variants, respectively.
As in the case of the mSites, the chromosomal distribution of eGenes and eTranscripts did not differ significantly from that of all the genes and transcripts included in the analysis (Fig. S2A, B).
As in the case of mVariants, eVariants were located near their eGenes and eTranscripts, with an absolute median distance of 63.00 Kb and 54.86 Kb, respectively. Out of the 1717 eGenes, 733 were influenced by an eVariant located upstream the gene start site, while 984 were regulated by a downstream eVariant (with 144 affected by an eVariant in the gene body) (Fig. S2C). Regarding the eTranscripts, 737 were regulated by an eVariant located upstream of the transcript start site, while 1033 were regulated by a downstream eVariant, including 138 cases where the eVariant was within the transcript body (Fig. S2D). The direction of the effect of the eVariant alternative allele was positive for 525 eGenes and 541 eTranscripts, while it was negative for 1192 eGenes and 1229 eTranscripts (Fig. S2E, F). We grouped all the eGenes and eTranscripts into four categories (protein coding, pseudogene, long non-coding RNA and short non-coding RNA) based on Ensembl biotypes (Fig. S2G, H), and found an increase of eGenes in the protein coding and pseudogene categories25, as expected.
We also constructed nominal cis-eQTL databases including all gene and transcript-variant associations, and sex-stratified eQTL databases (116 males and 161 females), all of which are publicly accessible along with our other datasets at the following link: https://irlab.shinyapps.io/salivaQTL/.
Validation of the mSites and eGenes identified in saliva in other tissuesTo determine whether the mSites identified in saliva were tissue-specific, we examined how many of these CpG sites also acted as mSites in whole blood, brain, and placenta. For whole blood, we used the mQTL dataset published by Hannon et al.26, which included 1,175 samples. This study, conducted using the Illumina EPIC array and a cis-window of ±500 Kb, reported 12,689,548 significant cis-mQTLs (P < 6.52 × 10⁻¹⁴), involving 2,907,234 genetic variants and 93,268 DNAm sites. Of the 123,451 mSites identified in saliva, 65,662 (53.19%) were also reported in blood. Brain mQTL data were obtained from Ng et al.27, a study conducted in 468 samples using the Illumina 450 K array and a cis-window of ±5 Kb. This study reported 693,696 significant CpG–SNP pairs (P < 5 × 10−09), involving 56,973 CpG sites and 383,920 SNPs. Of the saliva mSites, 23,285 (18.87%) were also found in brain tissue. Placenta mQTLs (n = 368) were generated and published by our group in a previous study28. Using the Illumina EPIC array and a 500 ±Kb cis-window, we identified 214,830 CpG sites with significant associations (FDR-adjusted P-value from beta distribution <0.05). Among the mSites detected in saliva, 66,249 (53.66%) were also present in placenta. The cross-tissue analysis of saliva eGenes followed the same rationale as for the mSites. In this case, we consulted eQTL datasets for blood and brain published by the GTEx Consortium in 20204. These datasets included 13,903 samples for blood and 25,594 for brain, generated using the Illumina TruSeq™ platform. In the case of brain tissue, eQTLs were calculated separately for 13 distinct regions, with sample sizes ranging from 181 to 300 individuals. We considered a gene to be a brain eGene if it was identified in at least one of these regions (FDR-adjusted P-value from the beta distribution <0.05). Of the 1717 eGenes identified in saliva, 452 (26.32%) were also reported in blood, and 738 (42.98%) were detected in at least one brain region.
Multiomic SMR to unravel potential biomarkers of complex diseasesWe employed a multi-SNP SMR approach8 to integrate the mQTL and eQTL databases with the summary statistics of the largest GWAS of several adult cancers, and of cardiometabolic and neurodegenerative traits, in order to identify mSites and eGenes that are pleiotropically associated with those diseases and could potentially serve as diagnostic or risk biomarkers. We considered significant those mSites/eGenes with a Bonferroni-corrected PSMR-multi < 0.05 and a PHEIDI > 0.05. For sex-specific diseases such as prostate cancer, breast cancer, and endometrial cancer, SMR analyses were conducted using sex-specific m/eQTL data. We extended sex-stratified analyses to Parkinson’s disease and type 2 diabetes, where sex-combined and sex-specific SMR analyses were performed.
We identified a total of 501 unique CpGs that were associated with at least one disorder; of these, 54 CpGs with more than one disease and 456 only with one, adding up to a total of 555 CpG-disease combinations: 207 in cancer, and 292 and 56 in cardiometabolic and neurodegenerative diseases, respectively (Supplementary Data 1). The number of mSites identified for each disease is shown in Fig. 2. The diseases with the largest number of pleiotropically associated CpGs within each disease group were prostate cancer (n = 61), despite the reduced statistical power of the smaller male mQTL database, type 2 diabetes (n = 130) and Parkinson’s disease (n = 28). Of the 54 CpG identified in more than one disease, 47 were associated with diseases from the same group and had the same effect direction, such as cg24350568, cg23752985, and cg27208248, identified in coronary atherosclerosis, myocardial infarction, and coronary artery disease. In contrast, 7 CpGs appeared in diseases from different groups: for instance, cg23902361 was associated with myocardial infarction and coronary atherosclerosis, but also with prostate cancer (albeit with the opposite effect direction); and cg20817941 was identified in coronary artery disease and squamous cell carcinoma with the same direction.
Fig. 2: Multi-SNP SMR analyses integrating mQTL and eQTL data across various complex traits.
The top barplot shows the number of mSites pleiotropically associated with each complex disease, color-coded by disease group and pattern-coded by sex, while the bottom plot displays the number of eGenes identified for the same diseases. The figure was created with the publicly available ggplot2 R package (https://ggplot2.tidyverse.org).
In the identification of candidate eGenes, we detected 28 gene-disease associations in different categories: 16 in cancer, 9 in cardiometabolic conditions, and 3 in neurodegenerative disorders (Fig. 2, Supplementary Data 2). Among them, 2 genes (TRIM64EP and RP11-641A6.3) were associated with both basal cell and squamous cell carcinoma, while another 2 genes (FAM90A8P and DEFB108P3) were associated with both type 2 diabetes and squamous cell carcinoma.
As expected, the smaller sample size of the expression dataset and the lower number of elements analyzed compared to CpGs led to a much smaller number of instrumental variables in the SMR analysis—115,583 gene–SNP eQTL pairs (PeQTL <5 × 10⁻⁸) versus 6,402,887 CpG–SNP mQTL pairs (PmQTL <5 × 10⁻⁸). This led to a lower resolution in the SMR analysis, and several diseases with identified CpGs did not show pleiotropically associated eGenes. Squamous cell carcinoma had the highest number of identified eGenes (n = 9), followed by type 2 diabetes (n = 5) and basal cell carcinoma (n = 4).
Furthermore, eight diseases (3 cancers, 3 cardiometabolic diseases and 2 neurodegenerative disorders) showed positive results at both the CpG and the gene levels, opening opportunities for the development of diagnostic or risk biomarkers across multiple omics layers, and for the understanding of the molecular mechanisms underlying these complex diseases. The SMR results, both at the CpG and the gene levels, with at least one positive result are shown in Fig. S3. Of note, sex-stratified analyses revealed unique mQTLs and eQTLs that highlight potential biomarkers for sex-specific diseases such as prostate cancer and breast cancer as well as diseases with sex differences in prevalence, such as Parkinson’ disease and type 2 diabetes. For instance, mQTLs identified in males show distinct patterns when compared to females, reflecting sex-specific genetic and epigenetic regulation. These findings underscore the importance of considering sex as a biological variable in biomarker discovery and could inform tailored diagnostic and therapeutic approaches
Having obtained the SMR results for both DNAm and gene expression, with the idea that genetic variants may be associated with complex diseases by modifying gene expression through changes in DNAm, we conducted an eQTM analysis (n = 271) using a cis-window of 1 Mb upstream or downstream each gene start site. Of the 24 unique candidate SMR genes, we found that 8 (FDR < 0.05) had their expression associated with 46 unique candidate SMR CpGs, resulting in a total of 72 CpG-gene combinations.
Of the 72 significant eQTMs, 56 were pleiotropically associated with the same diseases as the CpGs linked to their expression levels, supporting the hypothesis that gene expression serves as an intermediary between CpG methylation and complex traits (Supplementary Data 3). In particular, this was observed in Parkinson’s disease (Fig. 3) (with 22 CpGs correlated with RPS26P8 expression, including 15 CpGs correlated with RP11-259G18.1), squamous cell carcinoma (Fig. 4) (with the combination cg07373298-TRIM64EP), prostate cancer (Fig. S4) (with 3 CpGs associated with the expression of the HLA-DRB5 gene), coronary artery disease (Fig. S5) (with cg13609457-RP11-33B1.4), and type 2 diabetes (with cg14692781-MANSC4 and 13 CpGs correlating with HLA-DQB1-AS1 expression). The total of the 56 eQTMs presented a concordance in the effect direction: the correlation between DNAm and expression, the effect of CpG methylation on disease, and the effect of gene expression on the same trait, all pointed in the same direction. This was the case even though the SNP acting as the instrumental variable was not the same in the mQTL and eQTL-based SMR approaches. For example, in the case of Parkinson’s disease (Fig. 3), cg23202277 was identified as an mSite pleiotropically associated with the disease (BSMR = −0.407, PSMR-multi = 9.85 × 10⁻¹⁰), and DNAm was negatively correlated with higher risk. This CpG is located on chromosome 17, downstream of the gene RPS26P8 start site, at a distance of 286.00 Kb. Notably, lower expression of this gene is also pleiotropically associated with Parkinson’s disease (BSMR = −0.272, PSMR-multi = 1.11 × 10−09). Decreased DNAm of cg23202277 leads to decreased expression of RPS26P8 in saliva (BeQTM = 0.615, PeQTM = 9.57 × 10⁻¹²), reinforcing the hypothesis that this gene could be potentially causal, and a putative candidate for early diagnosis or treatment of Parkinson’s disease. The instrumental variables used in the mQTL- and eQTL-based (Fig. 3E, F) SMR analyses were rs1635298 and rs2696497, which are in strong LD (r² = 0.761) in the 1000 G Iberian Spanish population24. Interestingly, in other cases, the instrumental variables used to identify the CpG and the gene were independent, as demonstrated by eQTM cg07373298-TRIM64EP in squamous cell carcinoma (Fig. 4), where LD r² = 0.032. We identified other examples of independence between instrumental variables, such as cg05182583-HLA-DRB5 in prostate cancer (r² = 0.065) (Fig. S4), and cg13609457-RP11-33B1.4 in coronary artery disease (r² = 0.507) (Fig. S5). Particularly, in the case of squamous cell carcinoma (Fig. 4), decreased DNAm of cg07373298 was associated with higher risk (BSMR = -0.034, PSMR-multi = 1.41 × 10−07). This CpG is located on chromosome 11, 648.62 Kb downstream of the TRIM64EP start site. Interestingly, higher expression of TRIM64EP was also pleiotropically associated with squamous cell carcinoma (BSMR = 0.051, PSMR-multi = 9.12 × 10−06). Furthermore, reduced DNAm of cg07373298 correlates with increased TRIM64EP expression in saliva (BeQTM = −0.222, PeQTM = 3.11 × 10−06).
Fig. 3: Multi-omics SMR analysis of Parkinson’s disease.
A Mirror Manhattan plot illustrating the SMR results at both the CpG level (top) and the gene level (bottom). The x-axis indicates the position of the molecular trait (either CpG position or gene start site), while the y-axis represents the -log10 P-value from the multi-SNP SMR test. Horizontal dashed lines denote the multiple testing threshold based on Bonferroni correction, and CpGs and genes that pass the HEIDI test are highlighted in red. Red dashed boxes indicate the CpG and gene that form an eQTM. LocusZoom plots displaying the instrumental variables used to identify the CpG and gene highlighted in (A), across the breast cancer GWAS (B), the mQTL analysis (C), and the eQTL analysis (D). The colors indicate the level of LD between the mVariant (rs1635298) and surrounding SNPs in the region based on the 1000 G reference panel. E, F Boxplot showing the mQTL (rs1635298-cg23202277) and the eQTL (rs2696497-RPS26P8) used as instrumental variables in the SMR analyses, respectively. G Representation of the eQTM cg23202277-RPS26P8. The x-axis indicates the DNAm levels, and the y-axis represents the gene expression levels. Mirror Manhattan plots were created with the open-source Hudson R script (https://github.com/anastasia-lucas/hudson). Regional genomic plots were created with the LocusZoom web application (http://locuszoom.org). Other graphs used to represent QTL characteristics were created with the open-source ggplot2 R package (https://ggplot2.tidyverse.org).
Fig. 4: Multi-omics SMR analysis of squamous cell carcinoma.
A Mirror Manhattan plot illustrating the SMR results at both the CpG level (top) and the gene level (bottom). The x-axis indicates the position of the molecular trait (either CpG position or gene start site), while the y-axis represents the -log10 P-value from the multi-SNP SMR test. Horizontal dashed lines denote the multiple testing threshold based on Bonferroni correction, and CpGs and genes that pass the HEIDI test are highlighted in red. Red dashed boxes indicate the CpG and gene that form an eQTM. LocusZoom plots displaying the instrumental variables used to identify the CpG and gene highlighted in (A), across the squamous cell carcinoma GWAS (B), the mQTL analysis (C), and the eQTL analysis (D). The colors indicate the level of LD between the mVariant (rs2511313) and surrounding SNPs in the region based on the 1000 G reference panel. E, F Boxplot showing the mQTL (rs2511313-cg07373298) and the eQTL (rs10741323-TRIM64EP) used as instrumental variables in the SMR analyses, respectively. G Representation of the eQTM cg07373298-TRIM64EP. The x-axis indicates the DNAm levels, and the y-axis represents the gene expression levels. Mirror Manhattan plots were created with the open-source Hudson R script (https://github.com/anastasia-lucas/hudson). Regional genomic plots were created with the LocusZoom web application (http://locuszoom.org). Other graphs used to represent QTL characteristics were created with the open-source ggplot2 R package (https://ggplot2.tidyverse.org).
Heritability partitioningWe used the LDAK framework to estimate the proportion of SNP heritability explained by saliva-derived mQTLs and eQTLs across 32 binary complex traits. Partitioned heritability analyses were conducted using GWAS summary statistics and SNP annotations derived from our saliva QTL datasets. For most traits, mQTLs explained a substantially larger share of heritability than eQTLs. For example, in coronary artery disease, mQTLs accounted for 70.5% of SNP heritability (95% CI: 65.9–75.1%) versus 2.9% for eQTLs; in type 2 diabetes, the respective contributions were 50.6% (95% CI: 45.1–56.1%) and 1.5% (95% CI: 0.7–2.2%). Similarly elevated mQTL contributions were observed in other diseases such as Alzheimer’s (40.2% vs. 4.7%) and colorectal cancer (28.1% vs. 2.8%). In several instances, mQTLs explained more than 100% of estimated SNP heritability, likely due to overlapping signals or collinearity in the model. In contrast, eQTL contributions rarely exceeded 10%, consistent with their lower numbers and potentially narrower regulatory scope. Full heritability estimates, confidence intervals, and the number of predictors used in each partition are provided in Supplementary Data 4.
Comments (0)