
Remember me
To evaluate the performance of splicing tools, we generated a training dataset comprising by 1535 pathogenic variants and 2102 benign variants (Fig. 1). This dataset was divided into five distinct categories of splicing variants (details provided in Methods): canonical splice site (CSS), non-canonical splice site (NCSS), deep intronic (DI), exonic splicing (ES), and branch point (BP) (Fig. 1).
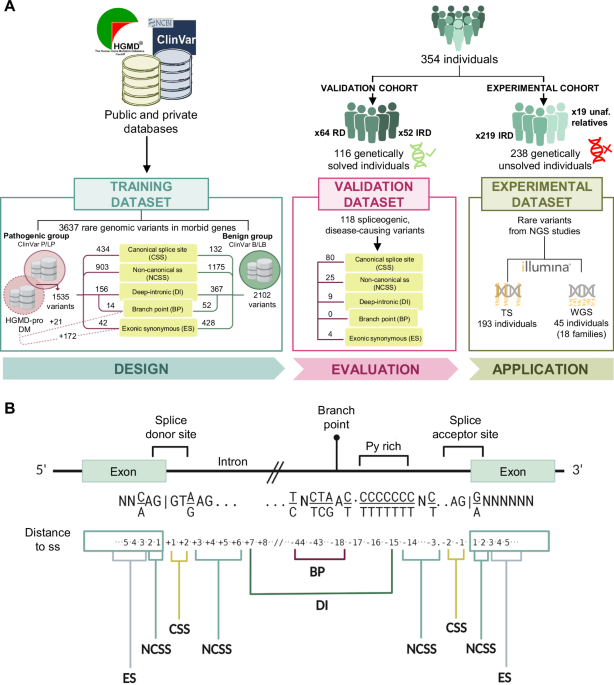
Fig. 1: Overview of cohorts, datasets, and classification of splicing variants analyzed in this study.
A Schematic representation of the study design. The training dataset includes 3637 curated variants sourced from public and private databases, classified into pathogenic (P) or likely pathogenic (LP) and benign (B) or likely benign (LB) groups based on ClinVar and HGMD-pro annotations. The validation cohort consists of 116 genetically diagnosed individuals with rare diseases (RD), carriers of 118 spliceogenic causal variants. The experimental cohort comprises 238 unsolved cases from 211 families with inherited retinal disease (IRD), analyzed using either targeted sequencing (TS) or whole-genome sequencing (WGS). Patients analyzed by WGS included 19 unaffected (unaf.) relatives. B Eukaryotic gene structure showing consensus exon and intron sites for gene splicing mechanisms at DNA level. According to the distance to the splice site (ss), five distinct categories of variants were established: canonical splice site (CSS), non-canonical splice site (NCSS), exonic synonymous (ES), deep intronic (DI), and branch point (BP).
The performance of thirteen splicing predictors was assessed using the entire training dataset (overall) and across the five variant categories separately (Supplementary Fig. 1). Regarding the receiver operating characteristic (ROC) curves, the overall dataset and NCSS variant groups showed an AUC > 0.8 for most tools, except for BPP and BP Alamut. Notably, BP Alamut perfomed best when applied exclusively to BP variants, suggesting tool specialization in BP motifs (Supplementary Table 1).
As Matthews Correlation Coefficient (MCC) provides a more informative and truthful score in evaluating binary classifications36, the tool performance was assessed taken into account the MCC value for a sensitivity of 90%. In this sense, SpliceAI and MaxEnt showed the highest overall performance using the overall dataset (Supplementary Table 1). Of note, SpliceAI also displayed a MCC > 0.5 in five out of six variant groups, except for the CSS group (MCC = 0.48), reflecting the difficulty in collecting benign variants located at the canonical splice sites.
The ROC data allowed us to determine the optimal threshold for each tool, both overall and within each variant group. These threshold varied widely depending on the specific variant dataset analyzed (Supplementary Table 1). To simplify further analysis, the optimal thresholds for each tool were selected based on the ROC results from the overall dataset, except for the BP variants. Due to the difficulty in predicting branch sites, a different approach was required for this category.
The optimal thresholds of the best performing prediction tools, determined based on the maximum MCC for each variant group, are shown in Table 1.
Table 1 Overview of the recommended thresholds of the best-performing prediction tools in each variant groupCombinatorial analysisAs tool performance depends on the type of splice-altering variant, we hypothesize that combining multiple prediction tools could lead to a consensus on the splice-altering potential of the variant. Furthermore, these combinations could also reduce the false positive rate (%FP) of each tool compared to its sole application (Supplementary Table 1).
Bases on the ROC curve analysis of the overall dataset, the tools that met the established criteria for good performance (MCC > 0.5, %FP < 35%, and %NA < 5%) were identified and selected (Supplementary Table 1). As a result, the prediction tools SpliceAI, MaxEnt, SSF, CADD, SQUIRLS, and NNS were chosen for further combinatorial study. Out of the 63 models generated by combining the six tools, a focused analysis was conducted on the 32 models that included the SpliceAI, as this tool demonstrated strong performance in five of the six variant groups under study.
The training dataset was filtered using each of the 32 models, which were applied using the optimal threshold (Supplementary Table 1) calculated for each tool from the overall dataset. Subsequent to this, a series of statistical parameters were calculated (Supplementary Table 2) to identify the most efficient combination of tools. Among the combinatorial models, “SpliceAI+MaxEnt” combination showed the best performance with the highest area value of the radar plot polygon (Supplementary Fig. 2). Compared to using SpliceAI alone, the combination of these two tools halved the %FP, and increased the MCC and PPV values, allowing a better prioritization of the splice-altering variants (Fig. 2).
Fig. 2: Assessment of the combinatorial models.
A Bar chart showing the results obtained for sensitivity, MCC, %FP and PPV in pathogenic variants when applying SpliceAI alone or the optimal SpliceAI+MaxEnt model. Statistically significant differences are indicated by asterisks (***p-value < 0.05). B Graph showing the comparison between the application of the SpliceAI+MaxEnt model using the thresholds already described (literature) or those proposed in this study (custom). The graphs were created with RStudio 2022.02.3. %FP false positive rate, MCC Matthew’s correlation coefficient, NPV Negative predictive value, PPV Positive predictive value, SEN sensitivity, SPE specificity.
In addition, we highlighted that our optimized model significantly increased sensitivity (p-value = 1.543·10−5, Chi-squared test) and MCC (p-value = 3.357·10−14, Chi-squared test) compared to the combination with the thresholds suggested by the tools developers, whereas the %FP remained similar; therefore, our model showed a higher area value of the radar plot polygon (Fig. 2).
Validation of the pipelineTo assess the effectiveness of the proposed splicing filter, a validation dataset comprising 118 previously known spliceogenic variants (Supplementary Data 1) was generated from the genomic data of 116 genetically diagnosed individuals (Fig. 1). The application of frequency-based filtering (MAF ≤ 0.01) in combination with the “SpliceAI+MaxEnt” filter successfully prioritized 88.98% of the spliceogenic, disease-causing variants (105 out of 118). The addition of the ClinVar update pathway to the workflow improved the prioritization rate of disease-causing variants to 97.46% (115 out of 118), without increasing the %FP. This “ClinVar update” step aims to prioritize variants classified as pathogenic (P), likely pathogenic (LP), or conflicting but with at least one P or LP entry in ClinVar (CIPP/LP), regardless of whether they pass the rest of the filters or not.
We also assessed the type of splice-altering variants validated by our workflow (Fig. 3). Remarkably, all CSS and synonymous variants in the validation dataset were correctly identified. However, two NCSS and one DI variants failed to pass any of the applied filters (Supplementary Data 1). It is important to note that the validation dataset lacked variants in branch sites, as none of our patients harbored disease-causing branch point variants. Therefore, the prioritization potential of BP Alamut for these variants could not be evaluated.
Fig. 3: Evaluation and application of the splicing pipeline.
A The histogram shows the percentage of recovered and missing variants using the developed workflow in the validation cohort. The graph comprises annotations that indicate the number of variants corresponding to the size of each bar. The graph was created with RStudio 2022.02.3. B Overview of the 211 families of the experimental cohort analyzed using the developed pipeline. P/LP pathogenic/liley pathogenic.
The performance assessment of the optimized splicing tool combination in the validation cohort demonstrated the efficacy of this approach to prioritize spliceogenic variants. As a result, we added the “SpliceAI+MaxEnt” and “BP Alamut” pathways to our recently published in-house algorithm for analyzing NGS data37 (Fig. 4).
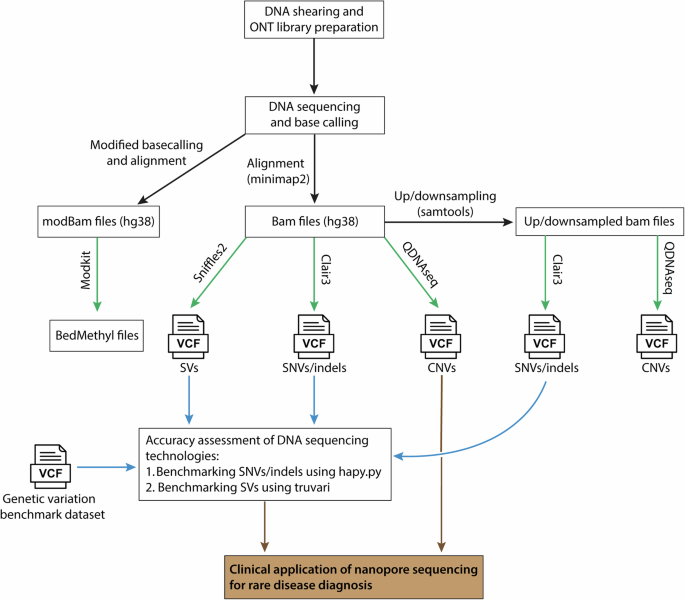
Fig. 4: NGS data analysis workflow used for the identification of potentially pathogenic or splicing disrupting variants in the 211 families from the experimental cohort, including 193 analyzed by targeted sequencing (TS) and 18 by whole-genome sequencing (WGS).
Genomic data from unsolved families are jointly combined, annotated and filtered. During the process, the data is also annotated with an updated ClinVar database file (2023.01.21), with the aim of identifying variants that were recently classified as pathogenic (“P”), likely pathogenic (“LP”), or as conflicting interpretations of pathogenicity (“CIP”) variants with at least one “P” or “LP” entry. In parallel, quality, recurrence, frequency, multiallelic and coding genes filterings were applied to SNVs and CNVs. After this, SNVs were filtered by CADD + MAPP+ Grantham+SIFT37, SpliceAI+MaxEnt and BP Alamut resulting in a number of likely pathogenic and spliceogenic variants. Moreover, to evaluate variants consistent with a compound heterozygous model, we also took into account other coding non-synonymous variants located in the same genes where another variant was prioritized by our filtering steps. The different paths of analysis converge into the pedigree filtering that focused on the variants consistent with the disease in each family pedigree considering the distinct modes of inheritance and the status of the different sequenced members. Subsequently, the candidate variants are manually prioritized and segregated in additional family members. In diagnosed cases, an experimental validation can be conducted, while the remaining unsolved cases, can be susceptible to re-enter in a new round of analysis. AF allele frequency, CIP conflicting interpretations of pathogenicity, Het heterozygous, Hom homozygous, LP likely pathogenic, P pathogenic, SNVs single nucleotide variations, SVs structural variants, TS targeted sequencing, WGS whole-genome sequencing.
Application of the splicing pipelineRare SNVs were prioritized applying the filters “CADD+MAPP+Grantham+SIFT”, “SpliceAI+MaxEnt” and BP Alamut according to the developed pipeline (Fig. 4). Variants meeting one of these filters were integrated into the pedigree filtering alongside SV variants, and the variants prioritized by the ClinVar update. Finally, a manual curation was carried out.
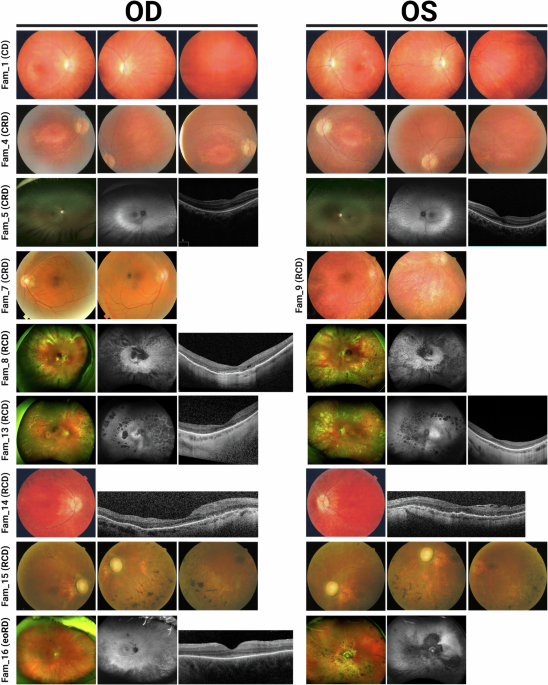
The application of the optimized algorithm in the experimental cohort (Fig. 1) resulted in the identification of 30 different variants (12 novel) that may explain the phenotype in 20 IRD families (Table 2). In addition, 23 monoallelic variants reported as pathogenic or likely pathogenic in the ClinVar database for recessive genes were identified in 25 families, which could contribute to the phenotype (Fig. 3). No candidate variants were found in the remaining families (n = 166).
Table 2 Variants identified by the in-house pipeline in IRD families from the experimental cohortFamily segregation studies for 21 genetic variants showed segregation with the disease in 13 pedigrees (Supplementary Fig. 3). A total of 13 families (65% of prioritized families and 6.2% of all targeted/WGS-negative samples) were “solved”, “very likely solved” or “possibly solved”, while others (n = 7) were “uncertain” (Fig. 3). For clarity: i) “solved” families included all those in which the identified variants could explain the disease without the need for further studies; ii) “very likely solved” families include two families (Fam 16 and Fam 9) in which minor further studies would be required, as both families met an additional pathogenicity criterion (marked “a” in Table 2), based on the fact that the same pairs of variants were detected in trans in more than one unrelated family of our IRD cohort, strengthening their causal role; iii) “Possibly solved” families included two families (Fam 1 and Fam 15) that were harboring variants in genes previously associated with the reported phenotype in which further studies would be required; and iv) “Uncertain” families included those with a novel genotype-phenotype correlation in which major further studies are needed. Specific recommendations are shown on Table 2.
According to ACMG/AMP criteria5,38, the 30 prioritized variants were classified as pathogenic (n = 9), likely pathogenic (n = 7), or variants of uncertain significance (n = 14) (Table 2). Seventeen out of the 30 variants were predicted to be spliceogenic, including 2 CSS, 4 NCSS, 3 DI, 3 BP, 4 ES and 1 missense variants (Table 3). Of these, the “SpliceAI+MaxEnt” filter prioritized 13 variants, 4 of which also passed the “CADD+MAPP+Grantham+SIFT” filter. “BP Alamut” and manual curation recovered 3 and 2 variants, respectively (Table 3). Of the 13 non-splicing variants, 9 had been previously identified but were not prioritized due to the absence of a second pathogenic allele in recessive genes or uncertain clinical significance at the time of initial analysis (Fam 7). Conversely, the duplications identified in families 11 and 12 were missed in targeted sequencing studies, as was the homozygous PLA2G5 variant in family 18 or the deletion detected in family 4, since these genomic regions were excluded from the panel design.
Table 3 Overview of likely spliceogenic variants identified in the discovery cohortInterestingly, we identified two variants, one in BBS1 and one in CDH23, whose effect on the protein may vary according to the different isoforms described in Ensembl (GRCh37) (Table 2). For the canonical isoform of BBS1 (NM_024649.5), the variant is synonymous (c.339T>C; p.(Tyr113 = )), whereas for the non-canonical ENST00000537537.1 isoform, it is missense (c.50T>C; p.(Met17Thr)). Similarly, for the canonical isoform of CDH23 (NM_022124.6) the identified SV affects only the non-coding 5’ UTR region (c.-427_-30del; p.?), but for the alternative isoform NM_001171931.1 it implies the deletion of the first coding exon (c.-293_106del). RT-PCR using ready-to-use cDNA from different human tissues suggested that, in both cases, although the canonical isoform exhibits higher expression levels in the analyzed tissues, the alternative isoforms of interest are also expressed in the retina (Supplementary Fig. 4). The results indicated that the canonical isoforms display a ubiquitous expression pattern, while the non-canonical isoforms analyzed appear to exhibit a more tissue-specific expression profile. Remarkably, the second hit (c.808G>A; p.(Gly270Arg)) identified in the index patient of family 1 also affected the coding sequence of the ENST00000537537.1 isoform (c.472G>A; p.(Gly158Arg)) (Supplementary Fig. 5). The three-dimensional modeling for BBS1 alternative protein (UnitProt B4DYY3) using PyMOL Molecular Graphics System showed that Met17, a non-polar amino acid, may interact with two other amino acids through hydrogen bonding (Supplementary Fig. 5). Specifically, Met17 would form one hydrogen bond with Leu13, and with Ala14. In silico mutagenesis at position 17 to threonine, a polar amino acid, predicted the gain of a new hydrogen bonding interaction point with p.Ala14 (Supplementary Fig. 5). Likewise, the mutagenesis at position 158 from glycine to arginine showed the likely formation of a new hydrogen bonding interaction point with p.Arg156. These results suggest that the two BBS1 variants identified in family 1 may be exerting their pathogenic effect by altering the protein folding of the alternative isoform (Supplementary Fig. 5).
Genotype-phenotype correlationsThe clinical characterization of the 20 families with candidate genetic variants identified in this study is summarized in Supplementary Data 2. The main clinical diagnosis was retinitis pigmentosa (n = 10), followed by Usher syndrome (n = 4), cone dystrophy (n = 3), and other 3 phenotypes (fundus albipunctatus, anophthalmia with familial exudative vitreoretinopathy, and unspecified retinal dystrophy). Of note, in six families with nonsyndromic IRD, variants were identified in genes that, according to the OMIM database (accessed October 2023), are primarily, although not exclusively, associated with syndromic human phenotypes, but which may include IRD among their associated symptoms: BBS1, MIM:*209901; CHD7, MIM:*608892; ERCC2, MIM:*126340; GRN, MIM:*138945; MED12, MIM:*300188; PRPS1, MIM:*311850. Further studies, including extended segregation analysis, are needed to evaluate the role of these variants in the etiopathogenesis of the IRD in these families.
Splicing analysis of CDH23 variants in patient RNAOur limited availability of patient-derived blood samples and the inaccessibility of the target tissue (the retina), significantly constrain the functional validation of splicing variants. Of the 17 spliceogenic variants identified in this study, we were able to validate only two. To further characterize the potential effect on splicing for the novel branch point (c.5924-21A>C) and deep intronic (c.6713-1062G>A) variants in CDH23 gene, we performed RT-PCR experiments on patient RNA in families 2 and 5.
The proband of family 2 received a clinical diagnosis of Usher syndrome type I (USH1) showing a profound sensorineural hearing loss that required a cochlear implantation (Supplementary Data 2). Previous panel sequencing identified one pathogenic heterozygous variant in CDH23 (Table 2). The application of the splicing pipeline led to the identification of a second variant located in intron 45 (c.5924-21A>C), predicted to disrupt a putative BP site. For the analysis of this variant, we performed RT-PCR amplification of CDH23 exons 44–46 in individuals I:1, I:2 and II:1 from family 2. Heterozygous carriers of the c.5924-21A>C variant (I:2 and II:1) yielded, apart from the wild-type RT-PCR product (335 bp), an aberrant larger product of 540 bp (Fig. 5). Further Sanger sequencing of this product revealed the exonification of 205 bp of intron 45 (Fig. 5). The aberrant transcript would lead, if translated, to frameshift variant consisting of the insertion of three discrepant amino acids followed by a premature termination codon. This results allowed to classify the CDH23 c.5924-21A>C variant as likely pathogenic that, in combination with c.1087del, causes USH1 in family 2 (Supplementary Fig. 3). Full penetrant phenotype in this family is supported by the relative abundance of correctly (49.6%) versus aberrantly (50.4%) spliced isoforms.
Fig. 5: Functional validation of the CDH23 branch point variant (c.5924-21A>C) and deep intronic variant (c.6713-1062G>A).
A Schematic representation of CDH23 gene (NM_022124.6; GRCh37) and the location of the variants c.5924-21A>C and c.6713-1062G>A. B Agarose gel electrophoresis of RT-PCR products for CDH23 exons 44–46 using total RNA from frozen whole blood samples of the available individuals in family 2 (Fam 2). The individuals harboring the variant c.5924-21A>C (II:1 and I:2) showed a double band, one of which was ~200 nucleotides larger. Sanger sequencing of the reference (REF) and alternative (ALT) alleles revealed the retention of 205 intronic bases upstream of exon 46 in the ALT allele. C Agarose gel electrophoresis of RT-PCR products for CDH23 exons 48–49 using total RNA from frozen whole blood samples in negative control individual (C-) and the son (III:1) of index patient in family 5 (Fam 5), carrier of the deep intronic variant. The Sanger sequencing of CDH23 alleles in individual III:1 revealed the insertion of an intronic 70 bp region as a pseudoexon in the ALT allele. Red box indicates the predicted premature termination codon (PTC).
On the other hand, the proband of family 5 was diagnosed with atypical USH due to moderate sensorineural hearing loss (Supplementary Data 2). The analysis of WGS data with our in-house pipeline allowed us to identify a novel deep intronic variant (c.6713-1062G>A) in intron 48 of CDH23, predicted by SpliceAI to create cryptic acceptor site. This variant could explain the phenotype of the patient alongside with the previously identified c.6396del CDH23 variant. To validate the in silico prediction for the novel deep intronic CDH23 variant, RT-PCR amplification of CDH23 exons 48–49 was performed in individual III:1 from family 5 and in one control individual (Fig. 5). The RT-PCR results showed two different products (300 bp and 370 bp) in the individual carrying the heterozygous variant (c.6713-1062G>A), in contrast to the single product (300 bp) observed in the control individual (Fig. 5). Subsequent sequencing of these products unmasked the inclusion of a pseudoexon of 70 bp spliced between exons 48 and 49 of CDH23 in the mutant allele (Fig. 5). If translated, this would lead to insertion of 40 aberrant amino acids followed by a premature termination codon. Additionally, the relative band intensity of the mutant and wild-type was 26.7% and 73.3%, respectively, indicating that the mutant allele still produces a significant fraction of correctly spliced transcripts. These results suggested that the atypical Usher syndrome in family 5 could be caused by the combination of the ClinVar pathogenic allele, c.6393del, and the leaky or not fully-penetrant deep intronic variant, c.6713-1062G>A, in CDH23.
Comments (0)