
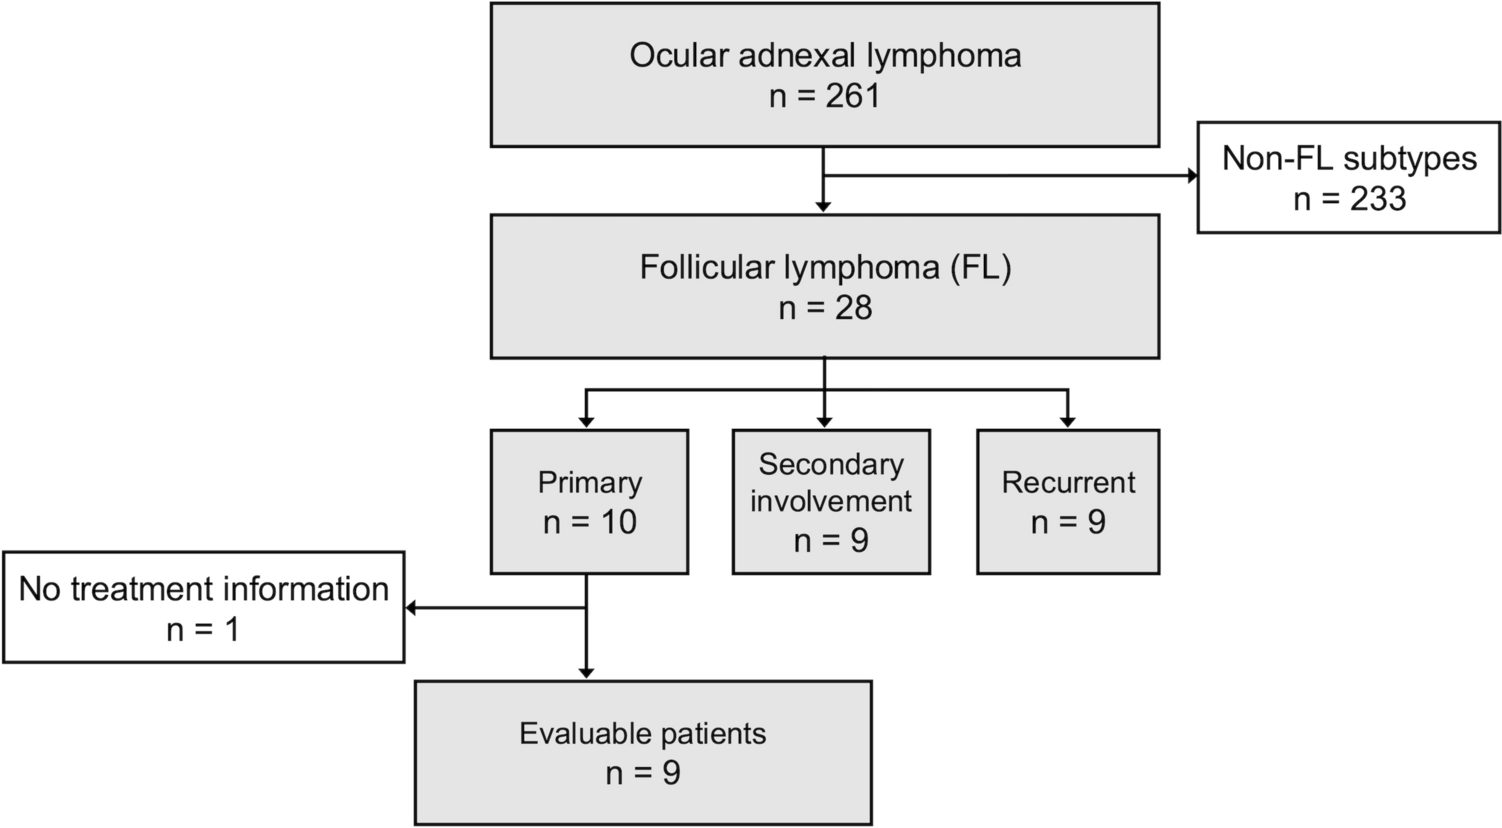
Remember me


Patient characteristics (allo-SCT, n = 24; tisa-cel, n = 43) are summarized in Table 1. The allo-SCT group was significantly younger than the tisa-cel group (median age, 52.5 vs. 58.0, p = 0.035). The median number of prior regimens was 4 (range, 1–11) and the allo-SCT group had received significantly more prior regimens (median, 5 vs. 4; p = 0.016) than the tisa-cel group. There were no significant differences between the allo-SCT and tisa-cel groups in terms of sex, histology, stage, IPI, PS, history of autologous SCT, history of bone marrow or central nervous system involvement, the number of EN lesions, LDH level, disease status, and chemosensitivity. In the allo-SCT group, 10 patients (41.7%) underwent transplantation between 2003 and 2010, 14 (58.3%) between 2011 and 2020, and none after 2021. Twelve patients received RIC regimen. In contrast, in the tisa-cel group, no patients were treated between 2003 and 2010, 9 (20.9%) between 2011 and 2020, and 34 (79.1%) after 2021. The median follow-up time for survivors in the allo-SCT group was significantly longer than that in the tisa-cel group (80.2 vs. 12.5 months, p = 0.005).
Table 1 Patients characteristicsSurvival outcomes and subgroup analysis with poor prognostic factors for CAR-T cell therapyThe median PFS and OS of the entire r/r LBCL cohort (n = 67) were 4.0 and 8.5 months, respectively (95% CI: 2.6–8.5 months and 6.2–153.6 months) (Fig. 1a, b). The allo-SCT group demonstrated significantly worse median PFS and OS than the tisa-cel group (2.3 vs. 24.0 months and 4.2 months vs. not reached (NR), 95% CI: 1.1–4.4 months vs. 3.1-NR and 2.5–8.1 months vs. 8.4-NR, p = 0.001 and < 0.001, respectively) (Fig. 1c, d). Patients treated with tisa-cel showed better overall response than those treated with allo-SCT (74.4% vs. 58.3%, p = 0.27).
Fig. 1
Survival outcomes. PFS (a) and OS (b) in all LBCL. Patients treated with tisa-cel had significantly better PFS (c) and OS (d)
Subgroup analysis was performed for patients demonstrating poor prognostic factors for CAR-T cell therapy in the context of the following parameters: PS ≥ 2 (all-SCT n = 8, tisa-cel n = 9), EN ≥ 2 (allo-SCT n = 7, tisa-cel n = 24), chemorefractory disease (allo-SCT n = 16, tisa-cel n = 24), and LDH ≥ ULN (allo-SCT n = 19, tisa-cel n = 26). Among the aforementioned four factors, patients with chemorefractory disease or LDH ≥ ULN showed better PFS and OS when receiving tisa-cel than allo-SCT (chemorefractory disease: median PFS in allo-SCT vs. tisa-cel group; 2.0 vs. 3.2 months [95% CI: 1.0–3.9 months vs. 1.5–6.9 months, p = 0.092] and median OS; 3.6 vs. 8.4 months [95% CI: 1.1–6.7 months vs. 5.3-NR, p = 0.021]) (LDH ≥ ULN: median PFS; 2.0 vs. 4.0 months [95% CI: 0.95–4.4 months vs. 1.5-NR, p = 0.018] and median OS; 3.9 vs. 8.5 months [95% CI: 1.1–8.1 months vs. 6.2-NR, p = 0.012]) (Fig. 2a–d). However, patients with PS ≥ 2 and EN ≥ 2 showed no significant differences in terms of PFS and OS between the allo-SCT and tisa-cel groups (PS ≥ 2: median PFS in the allo-SCT vs. tisa-cel group; 1.9 vs.1.6 months [95% CI: 0.66–3.9 vs.0.13-NR, p = 0.56] and median OS; 3.6 vs. 5.3 months [95% CI: 0.95–8.1 vs. 0.23-NR, p = 0.99]) (EN ≥ 2: median PFS; 2.0 vs. 3.2 months [95% CI: 0.95–4.5 months vs. 1.5–24.0 months, p = 0.40] and median OS; 2.7 vs.7.9 months [95% CI: 0.95–8.1 months vs. 3.8-NR, p = 0.14]). Moreover, survival outcome after relapse post-cellular therapy in patients with poor prognostic factors was 1.6 months (range 0.16–6.0 months) in the allo-SCT group and 4.6 months (1.7–6.3 months) in the tisa-cel group (Table 2).
Fig. 2
Survival outcomes with poor prognostic factors for CAR-T cell therapy. The patient treated with tisa-cel had better PFS (a) and OS (b) with chemorefractory disease, and PFS (c) and OS (d) with LDH ≥ ULN
Table 2 Survival outcomes with poor prognostic factorsTo validate the prognostic impact of these two factors (chemorefractory disease and LDH ≥ ULN), we further performed univariate and multivariate analyses. In the univariate analysis of PFS, tisa-cel was associated with a favorable prognosis (HR 0.39, 95% CI: 0.21–0.73, p = 0.0028), while chemorefractory disease and LDH ≥ ULN were identified as adverse prognostic factors (HR 2.7, 95% CI: 1.3–5.4, p = 0.005 and HR 2.1, 95% CI: 1.0–4.0, p = 0.036, respectively). In multivariate analysis, tisa-cel remained significantly associated with improved prognosis (HR 0.43, 95% CI: 0.23–0.8, p = 0.0075), whereas chemorefractory disease was significantly associated with poorer prognosis (HR 2.4, 95% CI: 1.1–4.9, p = 0.02) (Table 3). In the univariate analysis of OS, tisa-cel demonstrated a favorable prognostic impact (HR 0.34, 95% CI: 0.17–0.65, p = 0.0013), while chemorefractory disease and LDH ≥ ULN were identified as adverse prognostic factors (HR 3.5, 95% CI: 1.5–8.0, p = 0.0032 and HR 2.7, 95% CI: 1.2–6.0, p = 0.012, respectively). Multivariate analysis revealed that tisa-cel was significantly associated with a superior prognosis (HR 0.37, 95% CI: 0.19–0.72, p = 0.0039), whereas chemorefractory disease was significantly associated with an unfavorable prognosis (HR 3.0, 95% CI: 1.2–7.2, p = 0.015) (Table 4).
Table 3 Univariate and multivariate analyses for PFSTable 4 Univariate and multivariate analyses for OSIn contrast, only 7 patients were without poor prognostic factors (allo-SCT n = 1, tisa-cel n = 6). The median follow-up time is 16.3 months (range, 3.1–80.2 months), and all of them are alive without relapse.
Relapse/progression of disease and NRMThe one-year relapse/progression rate was 50.6% (95% CI: 37.4–62.4%) in the entire r/r LBCL cohort (Fig. 3a). The allo-SCT group showed similar one-year relapse/progression rates as the tisa-cel group (54.2% vs. 47.9%, 95% CI: 37.4–62.4% vs. 31.3–62.8%, p = 0.66) (Fig. 3b). There was no significant difference in the three-month relapse/progression rate between the allo-SCT and tisa-cel groups with PS ≥ 2 (allo-SCT vs. tisa-cel groups; 62.5% vs. 66.7%, 95% CI: 17.3–88.2% vs. 23.5–89.3%, p = 0.65), EN ≥ 2 (57.1% vs. 44.7%, 95% CI: 12.1–86.2% vs. 23.3–64.2%, p = 0.98), chemorefractory disease (50% vs. 45.8%, 95% CI: 23.3–71.9% vs. 25–64.4%, p = 0.74), and LDH ≥ ULN (42.1% vs. 36.8%, 95% CI: 19.5–63.3% vs. 18.1–55.7%, p = 0.76). In the univariate analysis of relapse/progression, chemorefractory disease was identified as an unfavorable factor (HR 3.5, 95% CI: 1.6–7.7, p = 0.0021). In multivariate analysis, tisa-cel showed no significant difference, whereas chemorefractory disease was significantly associated with an unfavorable prognosis (HR 3.2, 95% CI: 1.4–7.0, p = 0.0048) (Table 5).
Fig. 3
Relapse/progression rate in all LBCL (a). There was no significant difference in relapse/progression rate between the allo-SCT and tisa-cel groups (b). Although approximately one third of patients in the allo-SCT group died without relapse/progression, none of the patients in the tisa-cel group experienced NRM (c)
Table 5 Univariate and multivariate analyses for relapse/progressionThe one-year NRM in the entire r/r LBCL cohort was 12.9% (95% CI: 5.9–22.6%). Although the one-year NRM was 33.3% (95% CI: 15.1–52.9%) in the allo-SCT group, none of the patients in the tisa-cel group experienced NRM (p < 0.001) (Fig. 3c). Out of 24 allo-SCT patients, 12 patients each received MAC and RIC regimen. The one-year NRM was higher in the MAC group than in the RIC group (50.0% vs. 16.7%, 95% CI:17.9–75.7% vs. 1.9–44.4%, p = 0.06). The one-year NRM was similar between the patients treated with allo-SCT in 2003–2010 and in 2011–2020 (one-year NRM; 30.0% vs. 35.7%, 95% CI:5.2–61.2% vs. 11.3–61.5%, p = 0.75). In the allo-SCT group, a total of nine transplant-related deaths occurred. The cause of NRM was as follows: thrombotic microangiopathy (n = 2), acute graft-versus-host disease (n = 1), and infection (n = 1) in 2003–2010, respectively, and veno-occlusive disease (n = 1), infection (n = 1), progressive multifocal leukoencephalopathy (n = 1), interstitial pneumonia (n = 1), and unknown cause (n = 1) in 2011–2020, respectively.
Comparison of outcomes between allo-SCT received RIC regimen and tisa-celBased on the above result that NRM is better in the patients with the RIC regimen than those with the MAC regimen, we additionally compared survival outcomes in patients who received allo-HCT with RIC regimen and tisa-cel. The allo-SCT with RIC regimen group had a significantly worse prognosis than the tisa-cel group (one-year PFS: 16.7% vs. 52.1%, 95% CI: 2.7–41.3% vs. 35.3–66.4%, p = 0.036, one-year OS: 25.0% vs. 61.1%, 95% CI: 6.0–50.5% vs. 43.0–75.0%, p = 0.046) (Supplemental Fig. 1a, b). The one-year relapse/progression rate was higher in the RIC group than the tisa-cel group (66.7% vs. 47.9%, 95% CI: 30.6–87.0% vs. 31.3–62.8%, p = 0.25), although not statistically significant (Supplemental Fig. 1c). The one-year NRM was 16.7% (95% CI: 1.9–44.4%) vs. 0% (95% CI: 0–0%) in the RIC group and tisa-cel group, respectively (p = 0.017) (Supplemental Fig. 1d).
Comparison of outcomes between allo-SCT and tisa-cel after propensity score matchingTo obtain more robust results and adjust the differences in patient background between the allo-SCT group and the tisa-cel group, we performed PSM based on the 1:1 matching ratio. At first, we chose the factors “age” and the “number of prior regimens” because these two factors differed significantly between the two groups (allo-SCT n = 18, tisa-cel n = 18) (Supplemental Table 1). Second, we chose the factors “LDH” and “chemosensitivity” because they were significantly associated with prognosis (allo-SCT n = 19, tisa-cel n = 19). The standardized differences were less than 0.1 for age and the number of prior regimens in first cohort, and less than 0.2 for LDH and chemosensitivity in second cohort. The area under the curve in the logistic regression model for the propensity score were 0.73 in first cohort and 0.64 in second cohort (Supplemental Fig. 2).
Using the first PSM cohort, the allo-SCT group had significantly worse survival outcomes than the tisa-cel group (median PFS: 2.0 vs. 24.0 months, 95% CI: 1.0–3.9 months vs. 2.6 months-NR, p < 0.001, and median OS: 3.6 months vs. NR, 95% CI: 2.5–6.7 months vs. 7.2 months-NR, p < 0.001) (Supplemental Fig. 3a, b). The allo-SCT group still showed similar relapse/progression rates as the tisa-cel group (one-year relapse/progression: 55.6 vs. 45.5%, 95% CI:28.6–75.9 vs. 21.1–67.1%, p = 0.27) (Supplemental Fig. 3c). The one-year NRM was 38.9% (95% CI: 15.8–61.7%) in the allo-SCT group, and none of the patients in the tisa-cel group experienced NRM (p = 0.004) (Supplemental Fig. 3d). In univariate and multivariate analysis, tisa-cel was still associated with a favorable survival outcome (Supplemental Table 2a, b). In addition, in univariate analysis, tisa-cel showed no significant difference, whereas chemorefractory disease was significantly associated with relapse/progression rate (HR 2.7, 95% CI: 1.1–7.1, p = 0.036). In multivariate analysis, chemorefractory disease was significantly associated with an unfavorable prognosis (HR 2.7, 95% CI: 1.1–6.9, p = 0.036) (Supplemental Table 2c).
Subgroup analysis was performed for patients with poor prognostic factors for tisa-cel in the context of the following parameters: PS ≥ 2 (all-SCT n = 6, tisa-cel n = 2), EN ≥ 2 (allo-SCT n = 5, tisa-cel n = 10), chemorefractory disease (allo-SCT n = 12, tisa-cel n = 10), and LDH ≥ ULN (allo-SCT n = 14, tisa-cel n = 12). Among the patients with poor prognostic factors, patients with EN ≥ 2, chemorefractory disease, or LDH ≥ ULN showed worse survival outcomes when receiving allo-SCT than tisa-cel (Supplemental Fig. 4a–f). Patients with PS ≥ 2 showed no significant differences in terms of PFS and OS between the allo-SCT and tisa-cel groups (Supplemental Table 3). Patients with EN ≥ 2 showed significantly worse relapse/progression rate in the allo-SCT group than the tisa-cel group (three-month relapse/progression: 80.0% vs. 40.0%, 95% CI: 41.8–99.2% vs. 17.3–74.7%, p = 0.04). There was also no significant difference in relapse/progression rate between the allo-SCT and tisa-cel groups with PS ≥ 2, chemorefractory disease, and LDH ≥ ULN. (Supplemental Fig. 5a, c, e). No one experienced NRM with EN ≥ 2. Approximately one-third of patients with chemorefractory or LDH ≥ ULN in the allo-SCT group died without relapse/progression (Supplemental Fig. 5b, d, f).
Using the second PSM cohort, the allo-SCT group had also significantly worse survival outcomes than the tisa-cel group (median PFS: 2.6 vs. 24.0 months, 95% CI: 1.1–5.3 months vs. 2.1 months-NR, p = 0.017, and median OS: 4.6 months vs. NR, 95% CI: 1.8–8.1 months vs. 7.2 months-NR, p = 0.014). (Supplemental Fig. 6a, b). The allo-SCT group showed similar relapse/progression rates as the tisa-cel group (one-year relapse/progression: 47.4 vs. 45.9%, 95% CI:23.2–68.2 vs. 23.7–68.6%, p = 0.98) (Supplemental Fig. 6c). The one-year NRM was 36.8% (95% CI: 15.3–58.8%) in the allo-SCT group, and none of the patients in the tisa-cel group experienced NRM (p = 0.005) (Supplemental Fig. 6d).
Collectively, we analyzed the outcomes of the allo-SCT and tisa-cel again using PSM. The results were generally similar to those before both PSM, and tisa-cel was associated with a favorable prognosis.
Comments (0)