
Remember me

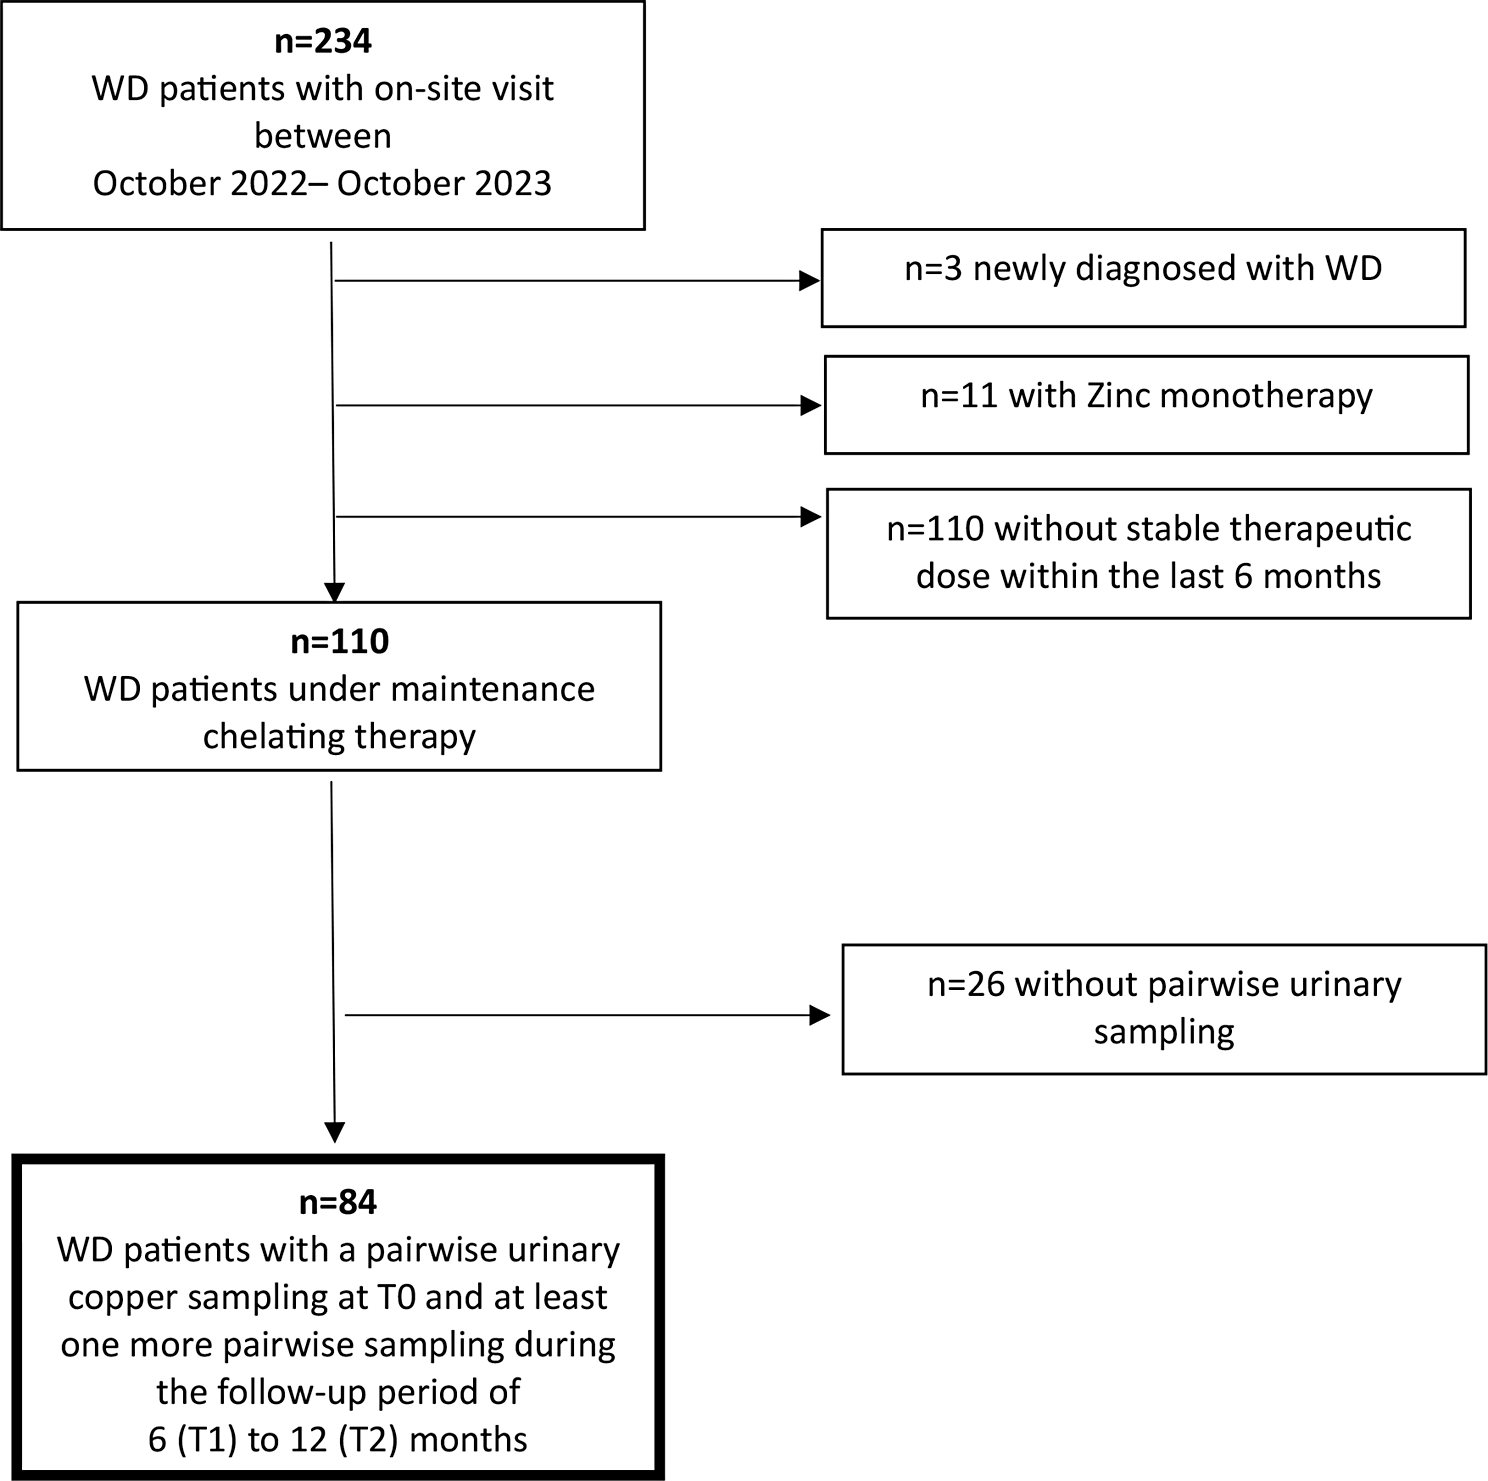

Between October 2022 and December 2023, 84 WD patients (58% females) under maintenance chelating therapy with pairwise collection of 24 h urinary samples met the inclusion criteria and were examined. Among these patients, at initial diagnosis, 55 (65%) presented with predominant hepatic symptoms, 3 (4%) with predominant neurologic symptoms, and 26 (31%) with a mixed phenotype (Table 1).
Table 1 Patient baseline characteristicsLiver cirrhosis was present in 17 patients, all of whom had compensated stable Child‒Pugh A stage disease (median Child Pugh Score: 5.3 (SD 0.8) at T0 vs. 5.2 (SD 0.6) at T2). Stable liver cirrhosis in these cases was reflected in the absence of hepatic decompensation and a stable MELD (Model for End-stage Liver Disease) Score at T0 (7.9, SD 1.9) and after 12 months at T2 (7.7, SD 1.95).
The median CuEXC at T0 was 1.13 µmol/l (range 0.40–2,79; standard deviation (SD) 0.51). The median age at diagnosis of our study population was 19 years (range 8–57; SD 12.0). The median age of the patients at T0 was 42 years (range 18–77; SD 13.9). In patients with indications for chelating therapy, DPA was used as a first-line choice due to the admission requirements in Germany. Therefore, at initial diagnosis, most patients were started on DPA (88.1%). Since therapy initiation, initial treatment has been switched to trientine in many patients.Trientine (2 HCl or 4 HCl) was prescribed in patients intolerant to DPA treatment or with ineffective control of copper metabolism under DPA. At T0, the patient cohort had a median duration since the start of initial therapy of 21.9 years (range 2.6–57.2 years). At T0, 50% (n = 42) of patients were receiving therapy with DPA, and 50% (n = 42) were receiving therapy with trientine (TETA 2HCl or 4HCl).
Key laboratory parameters during maintenance therapyMonitoring WD patients under therapy aims to confirm treatment efficacy by demonstrating clinical and biochemical improvement or stability [8]. Within the study cohort, data on biochemical markers, with a focus on transaminases, liver synthesis parameters, blood count as an indirect sign of portal hypertension, and liver stiffness values (estimated by transient elastography), revealed a stable WD condition in all included patients. A paired-samples t test was applied for all laboratory parameters, and the FU data were compared with the laboratory parameters at T0. None of these values differed significantly from the values at T0 (Table 2). When the dosage per day and per kilogram body weight were compared, the therapeutic dose was nearly the same at T0 and at both FU time points over the 12-month observation period in patients under both DPA and trientine (Supplemental Tables 1a and 1b).
Table 2 Longitudinal descriptive statistics for key laboratory parameters and transient elastographyAnalysis of pairwise 24 h urinary copper excretion on and off chelator therapy and correlation with other copper metabolism parametersThe mean 24 h-UCE values measured during therapy at T0, T1, and T2 were 6.5 µmol/d (SD 6.0), 6.4 µmol/d (SD 6.1), and 7.7 µmol/d (SD 4.6), respectively, and the mean 24 h-UCE values after therapy were 1.6 µmol/d (SD 1.3), 1.7 (SD 1.3) µmol/d and 1.5 µmol/d (SD 0.9), respectively. When the ranges and standard deviations of both 24 h-UCE sampling methods were compared, the values measured after 48 h of dose interruption showed considerably narrower ranges and smaller standard deviations (Fig. 2a).
Fig. 2
(a) Longitudinal development of 24 h-UCE overall. Longitudinal development of median 24 h-UCE values (and their respective standard deviations) in the overall cohort are depicted at T0, T1 and T2. (b) Longitudinal development of 24 h-UCE under trientine. Longitudinal development of median 24 h-UCE values (and their respective standard deviations) of WD patients under trientine therapy are depicted at T0, T1 and T2. (c) Longitudinal development of 24 h-UCE under D-Penicillamine. Longitudinal development of median 24 h-UCE values (and their respective standard deviations) of WD patients under D-Penicillamine therapy are depicted at T0, T1 and T2
The mean 24-h UCE values measured during DPA therapy were 8.3 µmol/d, 7.7 µmol/d and 8.5 µmol/d, respectively, and the mean 24 h-UCE values measured during off-DPA therapy were 1.5 µmol/d, 1.0 µmol/d and 0.9 µmol/d, respectively. The difference in the mean 24 h-UCE between T2 and T0 did not reach statistical significance, neither for on-treatment UCEs nor for off-treatment UCEs. When the ranges and standard deviations of both sampling methods were compared, the values measured after 48 h of dose interruption presented considerably narrower ranges and standard deviations (Fig. 2b).
The mean 24 h-UCE values measured during trientine therapy were 4.4 µmol/d, 5.2 µmol/d and 6.6 µmol/d, respectively, and the mean 24 h-UCE values measured during off-trientine therapy were 1.7 µmol/d, 1.6 µmol/d and 1.8 µmol/d, respectively. The comparison of the mean UCEs at T2 and T0 did not reach statistical significance for either the on-treatment UCEs or the off-treatment UCEs. When the ranges and standard deviations of both sampling methods for the UCEs were compared, the UCEs measured after 48 h of dose interruption presented considerably narrower ranges and standard deviations (Fig. 2c).
Analysis of the longitudinal values of 24 h-UCE collected off therapy revealed lower median values at T1 and T2 than at T0, with a significantly lower 24 h-UCE at T2 than at T0 (1.5 µmol/d at T2 versus 1.6 µmol/d at T0; p = 0.03). In contrast, 24 h-UCE was not significantly different between T2 and T0 (7.7 µmol/d versus 6.5 µmol/d; p = 0.36; Fig. 2a). Longitudinal trajectories of on- and off-therapy 24 h-UCE values showed considerable variation between the three timepoints for both modes of measurement (Supplemental Fig. 1a and 1b). Analysis of the correlation of on- and off-medication 24 h-UCE values revealed no significant correlation between these pairwise measurements (Supplemental Table 2). CuEXC should provide a reliable estimation of the “free” copper fraction in the serum. To better understand the differences in the results of 24 h-UCE measurements before and after therapy, CuEXC was determined and correlated with these measurements. Off-therapy 24 h-UCE and CuEXC were weakly but significantly correlated, with a correlation coefficient of 0.260 (Fig. 3a), whereas on-therapy 24 h-UCE values were not significantly correlated with the CuEXC values (Fig. 3b).
Fig. 3
Correlation of CuEXC and 24 h-UCE. Correlation of 24 h-UCE on-therapy (a) and correlation of 24 h-UCE off-therapy (b) with CuEXC are depicted in Fig. 3. Correlation line is drawn in green whereas CuEXC cut-off value is drawn in red
Other parameters of copper metabolism (total serum copper, serum ceruloplasmin, and calculated NCC) were not significantly different between T0 and T2 (Table 2). Correlation analysis of the NCC at each timepoint with the corresponding UCE values on- and off-therapy also revealed no significant differences, neither for 24 h-UCE on treatment nor for 24 h-UCE off treatment (Supplemental Table 2a and Supplemental Sect. 1).
Comparison of pairwise 24 h-UCE values with respect to their congruent or discordant implicationsThe longitudinal off-treatment 24 h-UCE values were within the targeted range of < 1.6 µmol/d in 51% (T0), 66% (T1) and 56% (T2) of patients. For on-therapy 24 h-UCE measurements, the results were within the targeted range of 3–8 µmol/d in 47% (T0), 61% (T1) and 47% (T2) of patients (Fig. 4, Supplemental Fig. 2a and 2b).
Fig. 4
Scatterplot of T0 measurements of 24 h UCE with and without treatment interruption. The Scatterplot shows 24 h-UCE of T0 measurements with and without treatment interruption. Guideline reference values are drawn with blue lines (EASL off therapy < 1.6µmol/D; AASLD on therapy 3–8µmol/d). Green box shows concordant measurements, whereas red boxes reveal discordant values. Additionally, percentage of measurement of each box (A to F) is given in %
Although the proportions of both 24 h-UCE sampling methods within the therapeutic goal were within a similar range and ranged between 47% and 66%, the paired values were rarely within the target range. The concordance between the two parameters was as low as 27% at T0 (Fig. 4, field F). This similarly held true for T1 (34%) and T2 (22%) (Supplemental Fig. 2a and 2b). The pairwise 24 h-UCE values were also concordantly above the therapeutic target range of 22% (Fig. 4, field B). In 46% of pairwise measurements, the results were discordant, with 19% of value pairs above the therapeutic target value for on-therapy samples but within the therapeutic target range for off-therapy samples (Fig. 4, field A), 20% of value pairs in the therapeutic aim for on-therapy values but above the therapeutic aim for off-therapy values (Fig. 4, field E), and 7% of value pairs below the therapeutic aim for on-therapy values but above the therapeutic aim for off-therapy values (Fig. 4, field D). Therefore, decision-making on the basis of 24 h-UCE results would lead to a relevant percentage of patients making different decisions depending on the 24 h-UCE method chosen. 5% of pairwise values were below the therapeutic threshold of 3 µmol/d for on-therapy measurements and, in parallel, below 1.6 µmol/d for off-therapy 24 h-UCE values, with a lower threshold for the therapeutic goal for off-therapy measurements being not clearly defined (Fig. 4, field E). Overtreatment in an adherent patient can be assumed if 24 h-UCE measured on therapy is less than < 1.6 µmol/d.
Comments (0)