
Remember me
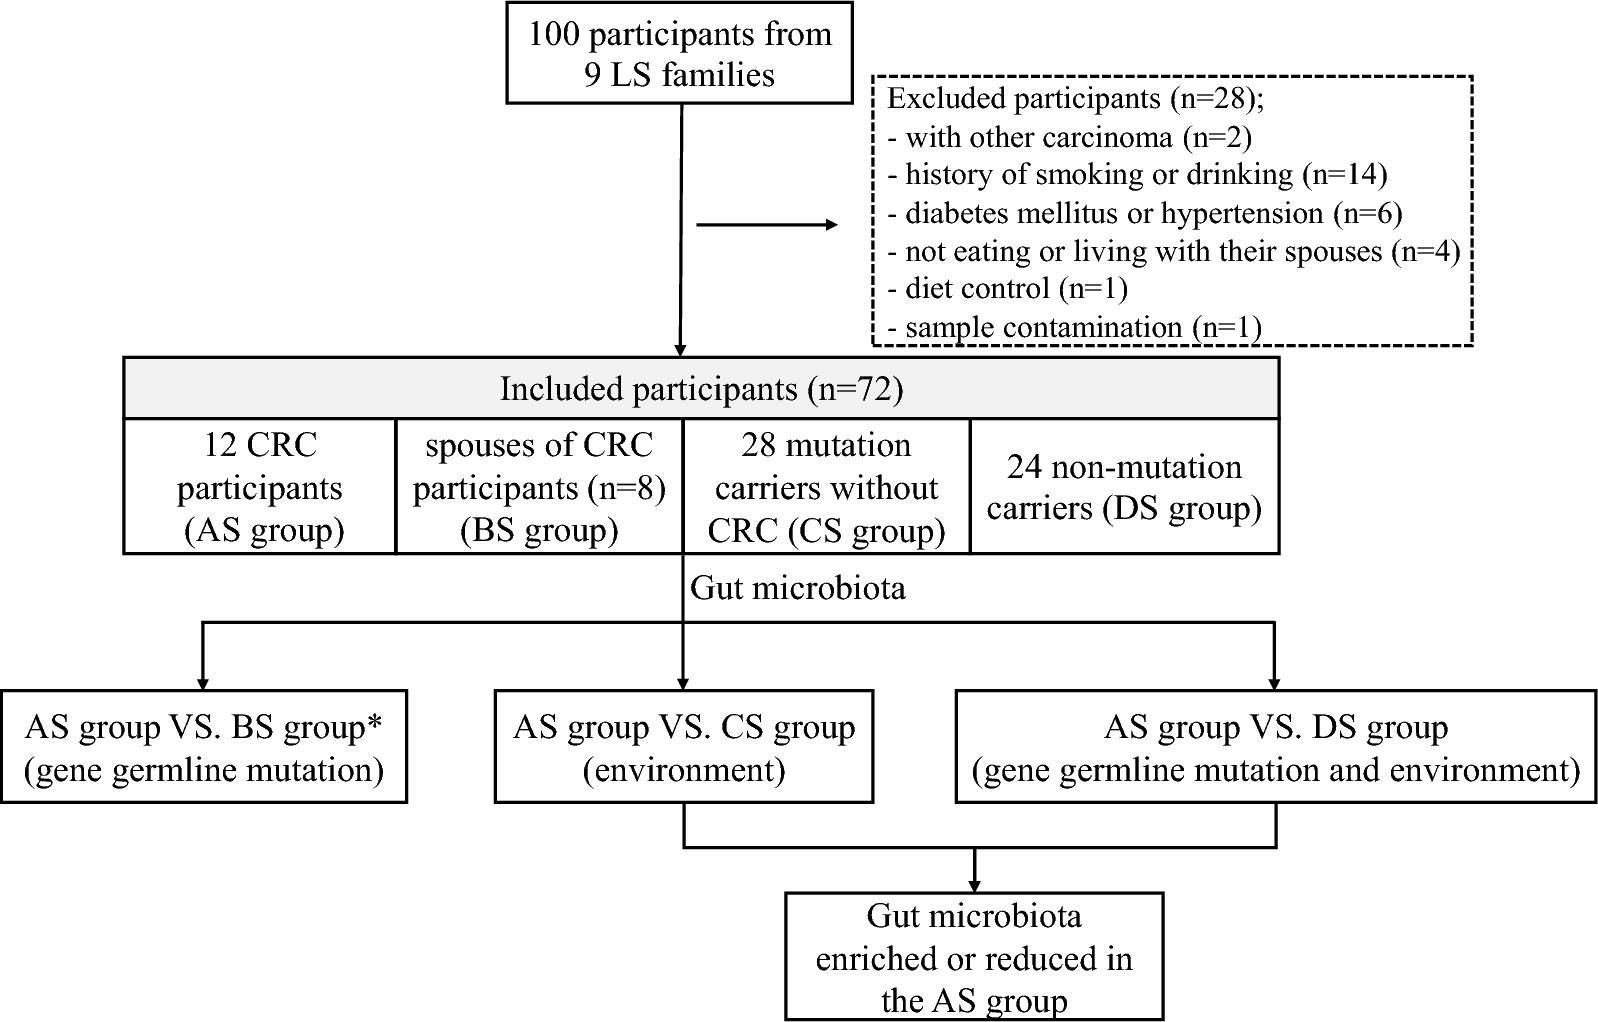


A total of 100 participants were initially recruited in this study, but 28 participants were finally excluded, including 2 subjects with other carcinomas, 14 with a history of smoking or drinking, 6 with diabetes mellitus or hypertension, 4 who lived apart from their spouses, 1 with diet control and 1 with sample contamination. Finally, 72 participants were included in this study (Fig. 1). We examined and compared the fecal samples of 72 participants (33 males and 39 females), including 12 with LS-related CRC (AS group), their spouses (n = 8, BS group), 28 mutation carriers without CRC (CS group), and 24 non-mutation carriers (DS group). The mean age of these participants was 45.25 years in the AS group, 47.75 years in the BS group, 43.86 years in the CS group, and 37.63 years in the DS group. No apparent age or gender differences existed among the four groups (F = 1.824, P = 0.151; Fisher’s exact test = 0.662, P = 0.891, respectively). In the AS group, 7 patients had MLH1 mutations, 2 had PMS1 mutations, and 3 had MSH2 mutations. In the CS group, 6 participants were MLH1 mutation carriers, 4 were PMS1 mutation carriers, and 18 were MSH2 mutation carriers (Table 1 and Supplementary Table 1). The AS, BS, CS and DS groups shared the same top 10 phyla, but the relative abundance of phyla differed, as shown in the barplot (Supplementary Fig. 1).
Fig. 1
The flow chart of this study. *In this cohort, we analyzed the gut microbiota of only 8 patients in the AS group whose spouses were included in the BS group
Table 1 The basic characteristics of each groupDifferences in the gut microbiome between the AS and BS groups16S rRNA diversity analysis was conducted to investigate gut microbiome differences between LS-related CRC patients (AS group) and their spouses (BS group). The alpha diversity indices, including the chao1 diversity index, observed features diversity index, and simpson diversity index, exhibited no significant differences between the AS and BS groups (all P > 0.05, Fig. 2a-c). Beta diversity analysis of the variance in microbial communities between samples, measured by the unweighted UniFrac distance metric, also revealed no marked difference between the AS and BS groups (P = 0.173, Fig. 2d). Differential genera between the AS and BS groups were modest and negligible. Only Allisonella (P < 0.05) was enriched in the AS group, while Bacteroides, Klebsiella, Veillonella and Enterobacter (P < 0.05) levels were elevated in the BS group (Fig. 2e). LEfSe analysis revealed that the abundance of Bacteroidaceae, Bacteroides, Veillonella, Klebsiella and Enterobacter increased in the BS group, while only Allisonella increased in the AS group (LDA score > 3) (Fig. 2f). Moreover, no-phylum level difference was found between the AS and BS groups according to the LDA cladogram (Supplementary Fig. 2).
Fig. 2
Gut microbiota analysis between Lynch Syndrome-related colorectal cancer patients (AS group) and their spouses (BS group). (a-c) The chao1 diversity, observed features diversity, and simpson diversity indices displayed the alpha diversity in the AS and BS groups. (d) Beta diversity of gut microbiota in the AS and BS groups using principal coordinate analysis (PCoA). (e) Differential gut microbiota between the AS and BS groups. (f) LEfSe analysis between the AS and BS groups. P < 0.05 indicated statistically significant
Differences in the gut microbiome between the AS and CS groups16S rRNA diversity analysis was performed to explore the difference in the gut microbiome between LS-related CRC patients (AS group) and mutation carriers without CRC (CS group). The alpha diversity indices between AS group and BS group were not significant, as validated by chao1 diversity index (P = 0.071), observed features diversity index (P = 0.050) and the simpson diversity index (P = 0.57) (Fig. 3a-c). However, Beta diversity analysis performed using the unweighted UniFrac distance metric revealed a significant difference between the AS and CS groups (P = 0.03, Fig. 3d).
Fig. 3
Gut microbiota analysis between Lynch Syndrome-related colorectal cancer patients (AS group) and mutation carriers without CRC (CS group). (a-c) The chao1 diversity, observed features diversity and simpson diversity indices in the AS and CS groups. (d) Beta diversity was analyzed by principal coordinate analysis (PCoA) in the AS and CS groups. (e) Differential microbiota between the AS and CS groups. (f) LEfSe analysis between the AS and CS groups. P < 0.05 indicated statistically significant
The differences in the gut microbiota between the AS and CS groups were greater than those between the AS and BS groups. In detail, the abundance of Agathobacter, Bacteroides, Coprococcus, Eubacterium_coprostanoligenes_group, Ruminococcus_torques_group, Dorea, Lactobacillus, Allisonella, Catenibacterium, Fusobacterium, Lachnospiraceae_FCS020_group, Negativibacillus, Oxalobacter, Parvimonas, Peptostreptococcus, Prevotellaceae_NK3B31_group, RF39, Slackia and UCG − 010 differed significantly between the AS and CS groups (P < 0.05, Fig. 3e). LEfSe analysis also confirmed that many gut microbes exhibited differences between the AS and CS groups. Bacteroidaceae, Bacteroides, Sutterellaceae and Burkholderiales were prevalent in the CS group, whereas Slackia, RF39, Lachnospiraceae_FCS020_group, Allisonella, Oxalobacteraceae, UCG − 010, Peptostreptococcus, Eggerthellaceae, Ervsipelatoclostridiaceae, Parvimonas, Catenibacterium, Lactobacillus, Lactobacillaceae, Negativibacillus, Oxalobacter, Coriobacterials_Incertae_Sedis, Fusobacteriales, Fusobacteriota, Fusobacteria, Fusobacteriaceae, Fusobacterium, Ruminococcus_torques_group, Dorea, Prevotellaceae_NK3B31_group, Coprococcus, Eubacterium_coprostanoligenes_ group and Agathobacter levels were elevated in the AS group (all LDA score > 2) (Fig. 3f). At the phylum level, Fusobacteriota was considered as a biomarker distinguishing the AS and CS groups (Supplementary Fig. 3).
Differences in the gut microbiome between the AS and DS groups16S rRNA diversity analysis was conducted to assess the difference in the gut microbiome between LS-related CRC patients (AS group) and non-mutation carriers (DS group). The chao1 diversity index and the observed features diversity index, two alpha diversity indices, suggested a significant difference between the AS and DS groups (P = 0.049 and 0.048, respectively), while the simpson diversity index suggested no significant difference between the AS and DS groups (P > 0.05, Fig. 4a-c). Beta diversity analysis, assessed by the unweighted UniFrac distance metric, revealed a significant difference between the AS and DS groups (P = 0.027, Fig. 4d). In detail, Agathobacter, Bacteroides, Coprococcus, UCG − 002, Ruminococcus_torques_group, NK4A214_group, Lactobacillus, Alloprevotella, Desulfovibrio, Fusobacterium, Lachnospiraceae_FCS020_group, Parvimonas, Peptostreptococcus, Prevotellaceae_NK3B31_group, Slackia and UCG − 009 levels differed significantly between the AS and DS groups (all P < 0.05, Fig. 4e). LEfSe analysis found that Bacteroidaceae, Bacteroides, Negativicutes, and Erysipelatoclostridiaceae elevated in the DS group, while Lactobacillaceae, Lactobacillus, Prevotellaceae_NK3B31_ group, Eggerthellaceae, Peptostreptococcus, Slackia, Peptostreptococcales_ Tissierellales, Fusobacteriaceae, Fusobacteriota, Parvimonas, Fusobacteriales, Fusobacteriia, Lachnospiraceae_FCS020_group, Fusobacterium, NK4A214_group, Ruminococcus_torques_group, Alloprevotella, Desulfovibrio, UCG − 009, Coprococcus, Synergistales, Synergistota, UCG − 002, Synergistaceae, Synergistia, Oscillospiraceae and Agathobacter appeared to be enriched in the AS group (all with LDA scores > 2) (Fig. 4f). Fusobacteriota and Synergistota were considered as phylum-level markers between the AS and DS groups (Supplementary Fig. 4).
Fig. 4
Gut microbiota analysis between Lynch Syndrome-related colorectal cancer patients (AS group) and non-mutation carriers (DS group). (a-c) The chao1 diversity, observed features diversity and simpson diversity indices in the AS and DS groups. (d) Beta diversity was analyzed by principal coordinate analysis (PCoA) in the AS and DS groups. (e) Differential microbiota between the AS and CS groups. (f) LEfSe analysis between the AS and DS groups. P < 0.05 indicated statistically significant
Microbe genera involvement in the development of CRC in LS familiesCombining the results of the AS group vs. CS group and the AS group vs. DS group comparisons, we identified ten microbe genera enriched in the AS group, including Agathobacter, Coprococcus, Ruminococcus_torques_group, Lactobacillus, Lachnospiraceae_FCS020_group, Fusobacterium, Parvimonas, Peptostreptococcus, Prevotellaceae_NK3B31_group and Slackia. A reduction in Bacteroides was also found in the AS group.
Comments (0)