
Remember me
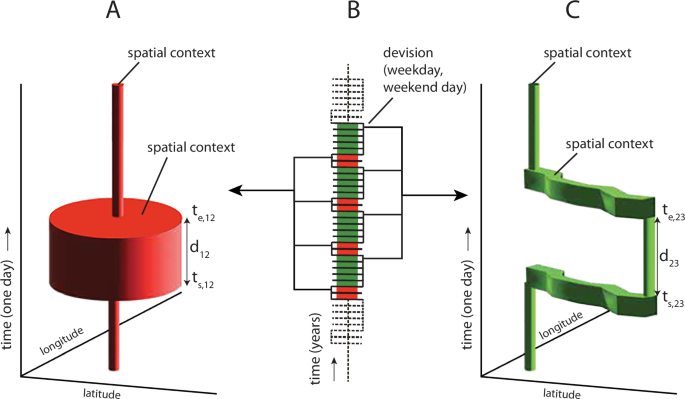

An overview of the materials and methods is shown in Fig. 1. The study starts with (1) a human mycotoxin intervention trial in which volunteers are given a single bolus dose at the TTC with subsequent collection of blood, urine, and feces, analyzed by UPLC-MS/MS to determine (2) individual concentration-time profiles. These data are fit using (3) a multi-compartment TK model with a hierarchical population structure using MCMC sampling to derive (4) population TK parameters. These are integrated into a probabilistic dose-response/hazard characterization approach adapted from our previous work with DON to derive (5) internal dose-based TTC values for comparison with biomonitoring data in blood and urine. Finally, these are compared with population biomonitoring data from the literature to perform (6) preliminary risk screening. All the codes and files used for PopTK modeling the iTTC derivations are shared via the Github repository https://github.com/liavisintin/TK_TeA.
Fig. 1: Overview of Materials and Methods, including structure of the multi-compartmental toxicokinetic (TK) model used for TeA.
The abbreviations reported represents the gastrointestinal tract (GI tract), volume of distribution of TeA (Vd), volume of distribution of the metabolites (Vdmet), absorption rate constant (kgutabs), urinary excretion rate constant (ku), metabolic rate constant (kmet), and the urinary excretion rate constant of the metabolites (kumet).
Human intervention trialThe invitation to participate in a human intervention study was extended to healthy adults between the age of 20 and 65 years, not pregnant or breastfeeding. Subjects with pathologies involving the liver, gastrointestinal tract, or kidneys, as well as those taking medications that could affect the functionality of these organs, were excluded. The study was conducted on 10 volunteers according to the guidelines laid down in the Declaration of Helsinki and was approved by the Ethical Committee of Ghent University Hospital (UZGent, Gent, Belgium) through an amendment to the original dossier B670201630414. Informed consent was obtained from all volunteers prior to participation, and all the medical aspects of the study were supervised by a medical doctor of the UZGent. The volunteers followed a specific diet developed to minimize the dietary intake of Alternaria toxins during the 5-days trial. The diet excluded foods commonly highly contaminated by Alternaria toxins [7, 10] such as seeds and derivates, tomatoes and derivates, whole grains, spices, apples, pears among others. On the third day of the trial, and before breakfast, the subjects ingested 5 mL of an aqueous bolus containing TeA at the TTC of 1,500 ng/kg body weight per day, as proposed by EFSA [7]. Urinary and fecal samples were individually collected for 48 h after the bolus intake, with participants recording the void volume for urine and the collection time point of each sample. Blood samples were collected following a time schedule via fingerpick using VAMS Mitra® tips (20 µL). A total of 113 urine, 128 capillary blood, and 32 fecal samples were collected in 48 h. Samples were stored in traditional polypropylene sample containers with a screw cap at −80 °C until the day of the analysis to ensure the stability [26, 27].
Sample extraction and UPLC-MS/MS analysisAll the samples collected in the framework of the trial were analyzed using previously validated methods published by Visintin et al. [27]. Briefly, the blood samples were exctracted with CH3OH from the polymeric Mitra® tips and then divided into two aliquots. One aliquot was subjected to a hydrolysis using β-glucuronidase from Helix Pomatia. The fecal samples were freeze dried upon delivery to the laboratory and then extracted with acetonitrile 1% CH3COOH. Finally, urine samples were also divided into two aliquots: one part underwent hydrolysis, as with the blood samples, while the second part was extracted using Salt-Assisted Liquid-Liquid Extraction (SALLE). All the five groups of samples obtained were finally analyzed with UPLC-triple quadrupole for the quantification of TeA using a matrix matched calibration and internal standard (IS) compensation.
Blood-plasma partitioning ratioFresh EDTA-whole blood, supplied by Rode Kruis Vlaanderen (Ghent, Belgium), was spiked with TeA analytical standard to reach final concentration of 1 ng/mL for the determination of the blood-plasma partitioning ratio of TeA. Samples were gently vortexed and incubated at 37 °C for 1 h while gently shaking to simulate physiological conditions. The whole blood samples were then divided in two aliquots, one of which underwent centrifugation for 10 min at 4000 × g to gather the paired plasma samples. The experiment was performed in triplicate. Before staring the extraction, IS was added to both plasma and whole blood samples. Subsequently, the samples underwent protein precipitation with ice-cold CH3CN and were centrifugated for 10 min at 10,000 × g. The supernatant was transferred in a new test tube and evaporated. Finally the residue was reconstituted in injection solvent (CH3CN/H2O/CH3COOH, 25/74/1, v/v/v), and analyzed via UPLC-MS/MS accordingly to the method published by Visintin et al. [27]. Samples were quantified using matrix-matched calibration and IS compensation.
PopTK modelingThe multi-compartmental structure of the PopTK model reported in Fig. 1 was chosen after evaluating the experimental blood and excretion profiles of TeA derived from the human intervention. The model consists of a gastrointestinal (GI) tract, urinary compartments for TeA and its metabolites, and a central compartment for TeA and its phase II forms. It is assumed that 100% of TeA is absorbed from the GI tract into the systemic circulation or central compartment with rate kgutabs. From the central compartment, TeA is excreted in urine with rate ku, or metabolized with rate kmet. The metabolites are eliminated from the central compartment in urine with rate kumet. The ratio between the amount in the body and the concentration in blood is given by the volume of distribution for TeA (Vd) and its metabolites (Vdmet). Because urinary TeA measurements includes both free and glucuronidated TeA, and additional parameter Fgluc representing the fraction of TeA urinary metabolites that is glucuronidated, and the model fit to the sum of free and glucuronidated TeA. All elimination rates are expressed in hr−1 and volume of distribution in L/kg. All parameters were natural log-transformed for fitting.
Hierarchical Bayesian population modelA hierarchical Bayesian population model was utilized for TK model fitting and to analyze model parameters, uncertainty, and inter-individual variability [28] as previously described by Lu et al. [24]. The prior distributions of the model parameters were retrieved by allometric scaling from data obtained through a pigs toxicokinetic trial published by Fraeyman et al. [29]. The parameter prior distributions are detailed in Table 1. The TK model fitting was carried out using GNU MCSim v6.1.0 software to perform MCMC simulation and to define posterior parameter values and uncertainty [30]. Four independent MCMC chains of 70,000 iterations each were run. Subsequently, the convergence of the chains was assessed by visual evaluation of the posterior parameters distributions and evaluation of the potential scale reduction factor \(\hat\) (≤1.2) [31].
Table 1 Human toxicokinetic model parameters, natural logarithm values, and prior distributions set.Model fit and predictions for human toxicokineticsThe population and individual TK predictions were evaluated by comparing them with experimental data from the human intervention trial on TeA. The model calibration was checked by correlating predicted and observed experimental values. The distributions of the posterior parameters were evaluated in terms of normality and reliability. The posterior parameter distributions at both population and individual levels were used to generate model predictions of hematic and urinary excretion profiles of TeA and its metabolites. The individual administered TeA mass, body weight, mass of TeA excreted unmodified and modified, and their concentration in blood at each collection time point were input for each subject to simulate the profiles in time. At the population level, parameter values were sampled from the population parameters to reflect uncertainty in their means and variances.
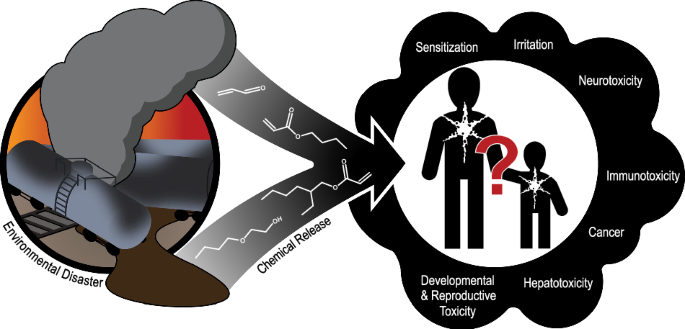
iTTC derivationWith no established toxicity value for TeA, we applied the concept of the internal Threshold of Toxicological Concern (iTTC) as an internal exposure benchmark that corresponds more closely to biomonitoring data [11] in blood and urine. Figure 2 shows an overview of the approach, including its relationship with traditional deterministic methods as well as the recommended probabilistic framework for uncertainty and variability from WHO/IPCS [32]. Our derivation followed the similar concept of developing probabilistic biomonitoring equivalents, as described in Lu et al. [24] and consists of 4 components as shown in the following equation:
$$}_^=\frac}_}}}_-}\times }_}\times }_-I}}$$
(1)
iTTCMI is the internal dose TTC for a critical effect magnitude M and individual I, where I may be a particular population percentile (e.g., I = 1%) or it could represent a random individual (assumed to be drawn from a lognormal variability distribution). The point of departure (PoD) consists of a conservative internal dose NOELiTTC based on TK modeling by Arnot et al. (2022) of the original Munro et al. dataset used for the TTC. The three assessment factors are (1) AFPoD-NOAEL developed by WHO/IPCS (2018) to address PoD uncertainty for a NOAEL relative to a BMD for M = 5% change in a critical endpoint; (2) AFinter-TD for inter-species toxicodynamic differences (inter-species TK differences are not included because the PoD is already on internal dose basis); and (3) AFintra-I for the human variability factor for individual I. Each component of the iTTCMI has an uncertainty distribution, as does the final iTTCMI. As proposed by WHO/IPCS for external dose toxicity values, a point estimate for the probabilistic iTTC could be defined as the lower 95% confidence bound for I = 1%. Additional details as to each step are described below.
Fig. 2: Flowchart illustrating the comparison between the default deterministic approach (left), the default probabilistic approach from No Observed Adverse Effect Levels (NOAEL) (middle), and the probabilistic approach with internal doses, population toxicokinetic (TK) modeling and biomonitoring data (right).
The flowchart highlights the differences between the approaches in the steps involved in deriving the internal threshold of toxicological concern and applying risk screening methodologies to tenuazonic acid (TeA).
Point of departure (PoD)Our selection of the PoD was sourced from Arnot et al. [11, 12] who compiled external NOEL values from a dataset comprising 613 organic substances with 2941 non-cancer endpoints from oral exposure, based on the original Munro et al. dataset. To translate these external NOELs into internal NOELs, in vivo TK data and in silico TK approaches were applied to convert the values under chemical-specific basis. Three distinct modeling approaches were proposed to calculate steady-state blood concentrations. Each approach assumed different physiological properties to parameterize the model, including variations in first-pass effects and urinary excretion rates. The 5th percentile of cumulative distribution of internal NOEL was selected as the PoD for iTTC. In our study, we incorporated the results of 5th percentile of internal NOEL distributions from the three models used by Arnot et al. [11, 12], and calculated their geometric mean (GM) and geometric standard deviation (GSD). These metrics were randomly sampled to generate the NOELiTTC uncertainty distribution for TeA. For the urinary iTTC, the internal NOEL uncertainty distribution in blood was converted to 24-hr urinary excretion distribution using the population median estimates of total clearance (Cltot) and free elimination rate in urine (kufrac) from the human population-based TK model described above.
AFPoD-NOAEL for point of departure (PoD) uncertaintyWHO/IPCS (2018) [32] noted that PoDs such as the NOEL “may be regarded as a rough estimate of the BMDLx, where x is the default BMR. Thus, the generic uncertainty in the NOAEL may be defined as the precision of the NOAEL in estimating the BMDL.” Therefore, to address the uncertainty arising from the imprecise estimation of the NOEL as the PoD, an adjustment factor AFPoD-NOAEL was applied as recommended. While the original NOEL endpoints collected in Arnot et al. [11, 12] database may encompass both continuous and deterministic endpoints, we opted for the AFPoD-NOEL derived from the continuous type of chronic study [32, 33] as it yielded a more sensitive BMD uncertainty distribution.
AFinterTD for interspecies factor for TD differencesAs the NOEL values underlying the iTTC were derived from experimental animal studies, an interspecies factor needs to be applied to account for interspecies toxicodynamic (TD) differences. Note that interspecies TK differences are not necessary because the PoD is already on an internal dose basis, consistent with the previous case study by Lu et al. [24] for DON. Using the same approach, we note that the default values GM = 1 and GSD = 1.95 from WHO/IPCS [32] were assumed to incorporate equal and independent contributions from TK and TD. Thus, the GSD for TD alone is derived using the formula
$$}_+}=\exp \left(\sqrt}_}\right)}^+\log }_}\right)}^}\right)=$$
(2a)
$$\exp \left(\sqrt}_}\right)}^}\right)=}_}}^}$$
(2b)
The formula leads to the equation \(}_}=}_+}}^}\), which was utilized to generate a distribution for interspecies TD differences \(}_}\).
AFintra-I for human variabilityWHO/IPCS (2018) [32] assumed independent contributions of TK and TD to human variability. For the probabilistic iTTC in blood, we only estimated human TD variations as human TK variability is inherently considered in steady-state blood concentrations, consistent with the previous case study by Lu et al. [24] for DON. WHO/IPCS (2018) [32] assigned the log scale TD variability in the human equipotent dose distribution \(_\left(}_}\right)\) with P50 = 0.221 and P95/P50 = 2.85, based on observations of human physiological and biological alterations. The \(}_}\) was used to address individual differences of internal dose. We selected incidence I = 1% as the target population percentile, using the corresponding Z-score (power = 2.326) to derive \(}_-I}=}_}^\) for iTTCMI in blood. When deriving a value for a random individual, a random Z-score is applied drawn from a standard normal distribution. It should be noted that no TeA data are used in the probabilistic iTTC blood calculation, so the resulting derivation is an applicable to any substance for which the TTC is an appropriate approach.
For the probabilistic iTTC in urine, because blood-to-urine kinetics is chemical-specific, we incorporated the two TK parameters influencing urinary excretion of TeA from our population-based TK model, which are Cltot (L/kg-hr) and kufrac, to estimate chemical-specific human TK variability. Both the GSD of Cltot and kufrac were randomly sampled to generate uncertainty distributions for intraspecies TK as \(}_}}}}\) and \(}_}}}}\), respectively. Due to the absence of chemical-specific intraspecies TD data, we adopted the WHO/IPCS (2018) [32] human TD variability uncertainty distribution as previously described. The overall human variability was derived from the assumption of an independent mix of TK and TD, using the formula
$$ }_}\\ =\exp \left(\sqrt}_}}}}\right)}^+\log }_}}}}\right)}^+\log }_}\right)}^}\right)$$
(3)
As was the case for the blood iTTC, an incidence I = 1% was selected as the target population percentile, using the corresponding Z-score (power=2.326) to derive \(}_-I}=}_}^\) for iTTCMI in urine, and for a random individual a random Z-score drawn from a standard normal distribution was used.
Risk screeningHuman biomonitoring cohortsThe iTTC was further used to perform risk characterisation on data made available from five different cohorts. Cohort I—Infant HBM data from the MISAME-III cohort including plasma samples collected during the years 2021–2022 in 6 different rural areas of Bobo-Dioulasso in Burkina Faso [34]. Data on samples collected from 5 infants (aged 11 months) were included in this study. The sample preparation and chemical analysis were according to Vidal et al. [35]. The concentration of TeA was quantified using targeted UPLC-MS/MS analysis. Cohort II—HBM data from the University Medical Center Groningen (The Netherlands). Data on plasma samples collected in 2019 from 92 healthy volunteers from The Netherlands were considered in this study. The volunteers were aged 55.5 ± 1.1 years and divided in 49% females and 51% males. The sample preparation and chemical analysis were according to De Ruyck et al. [36]. The concentration of TeA was quantified using targeted UPLC-MS/MS analysis. Cohort III—Plasma samples from subjects of the European Prospective Investigation Into Cancer and Nutrition (EPIC) cohort [37], located in ten European countries and aged 35–70 years, were collected between 1992 and 2000 from. In total, 103 HBM data were obtained from the control group via targeted UPLC-MS/MS for precise quantification of multiple-mycotoxin concentration, as described by De Ruyck et al. [36]. The concentration of TeA reported for plasma samples for the three latter cohorts was converted to the concentration in blood using the blood-plasma partitioning ratio determined analyzing fresh spiked human blood and corresponding plasma as detailed above. Cohort IV—HBM data obtained from 24 h urinary samples collected by six human volunteers (3 females and 3 males) aged 24–32 years while keeping their individual dietary habits [19]. The sample preparation and chemical analysis were performed according to Asam et al. (2013) [19]. The concentration of TeA was quantified using targeted UPLC-MS/MS analysis post derivatization of TeA. Cohort V—HBM data from the European Food Consumption Validation (EFCOVAL) collected from 2006 until 2010 in several European countries [38] and published by De Ruyck et al. [36]. A total of 600 healthy volunteers (aged 45–65 years) were part of this study, including 303 females (50.5%) and 297 males (49.5%). Urine was collected for 24 h from each individual. The biological samples were prepared and analysed according to De Ruyck et al. [36] for TeA quantification by UPLC-MS/MS.
Provisional Hazard quotient (HQ) and individual margin of exposure (IMOE)We assessed the risk level of TeA exposure in three different approaches. First, the “traditional” HQTTC was determined as the ratio between TeA’s HBM data-derived daily intake estimate and the TTC value. To convert biomonitoring data to estimated daily intake, blood concentrations were initially converted to plasma concentrations using a partitioning ratio of 0.73 ± 0.05, and subsequently calculated to oral doses utilizing the geometric means of TK parameters (Cltot and kufrac) in our PopTK model. Urinary concentrations were converted to oral doses based on an average 24-h urine volume of 1766.53 mL and a clearance value of 1.56 L/hr-kg bw. The estimated daily intake values were then compared with the oral TTC value for Cramer Class III (1.5 μg/kg bw per day) recommended by EFSA [13]. However, this approach relied on external TTC value to describe exposure, failing to address the effects associated with absorption, distribution, metabolism, and excretion. Moreover, this “traditional” TTC is derived from the deterministic approach without taking into account uncertainty and variability.
To address these limitations, we also applied our derived probabilistic iTTC to evaluate potential risks. We selected the 5th quantile of iTTCMI uncertainty distribution as the conservative threshold for comparison with each biomonitoring exposure value. Thus, a provisional HQiTTC was calculated using the ratio between the biomonitoring exposure value and the 5th quantile of iTTCMI. However, this HQiTTC estimation was still based on the conservative assumption from the lower bound of the most sensitive population I = 1%. Lu et al. (2023) [24] previously showed that for DON, this approach may over-estimate population risks.
Thus, to depict the variations in exposure and susceptibility within the entire population, we adapted the “individual margin of exposure (IMOE)” approach [39] for probabilistic risk characterization to this risk screening context. The original IMOE is defined as the ratio between the “Individual Critical Effect Dose” (ICED) and the “Individual Exposure” (IEXP). Both ICED and IEXP reflect both population variability and uncertainty, with the ICED being directly analogous to the HDMI as developed by WHO/IPCS (2018) (see Fig. 2). Our adaptation of this approach in this work is as follows:
We replace IEXP with “internal Individual exposure” (iIE) based on biomonitoring data. To address uncertainty in each biomonitoring cohort, we performed resampling with replacement.
Because there are inadequate toxicity data for TeA, we replace ICED (i.e., HDMI) with the probabilistic iTTCMI for a random individual.
To make it clear that we are basing this on a TTC-type PoD, we derive what we denote an “internal, Individual Margin of Exposure for the TTC” (iIMOETTC) as the ratio between the iTTCMI and the iIE from biomonitoring data.
As with the original IMOE, uncertainty and variability are separately characterized in a nested loop. First, in the uncertainty (outer) loop, random values are drawn based on the uncertainties in NOELiTTC, AFPoD-NOAEL, AFinter-TD, and GSDintraTD (for blood) or GSDintraTKTD (for urine), and resampling for iIE. Then, in the variability (inner) loop, random individuals with different z-scores for intra-species variability and different biomonitoring values (iIE) are drawn to derive a distribution of iIMOETTC = NOELiTTC/(AFPoD-NOAEL x AFinter-TD x GSDintraTDz x iIE). An iIMOETTC below 1 indicates the biomonitoring value exceeds the biomonitoring equivalent iTTC [40]. As an overall summary, at the end of each inner loop, we calculated the probability of iIMOETTC less than 1 for the population (i.e., fraction of [resampled] individuals with iIMOETTC < 1). The result after the outer loop is thus a distribution (reflecting uncertainty) of the population at risk of exceeding their individual iTTC.
Comments (0)