
Remember me


The Prostate, Lung, Colorectal, and Ovarian (PLCO) Cancer Screening Trial, a randomized controlled study of screening exams or tests for PLCO cancers, was conducted by the National Cancer Institute (NCI) to assess the impact of screening tests on mortality for several types of cancer [12]. From November 1993 to July 2001, 154,887 participants were recruited from ten centers across the United States (Alabama, Michigan, Colorado, Hawaii, Wisconsin, Minnesota, Pennsylvania, Utah, Missouri, and the District of Columbia). The trial collected cancer diagnoses up to 2009 and mortality data until 2018. Participants’ demographic and medical history data were gathered through baseline questionnaires (BQ), and dietary data through Diet History Questionnaires (DHQ) and Supplementary Questionnaires (SQX) [13,14,15,16]. Follow-up time was defined from DHQ completion to lung cancer occurrence, death, loss to follow-up, or the study’s end (December 31, 2009). The PLCO study protocol was approved by the Institutional Review Boards of all participating centers and the NCI. All participants provided written informed consent. For this analysis, we utilized publicly available datasets approved by the NCI (Project ID: PLCO-1461). Ethical approval for the inclusion of human participants was not required.
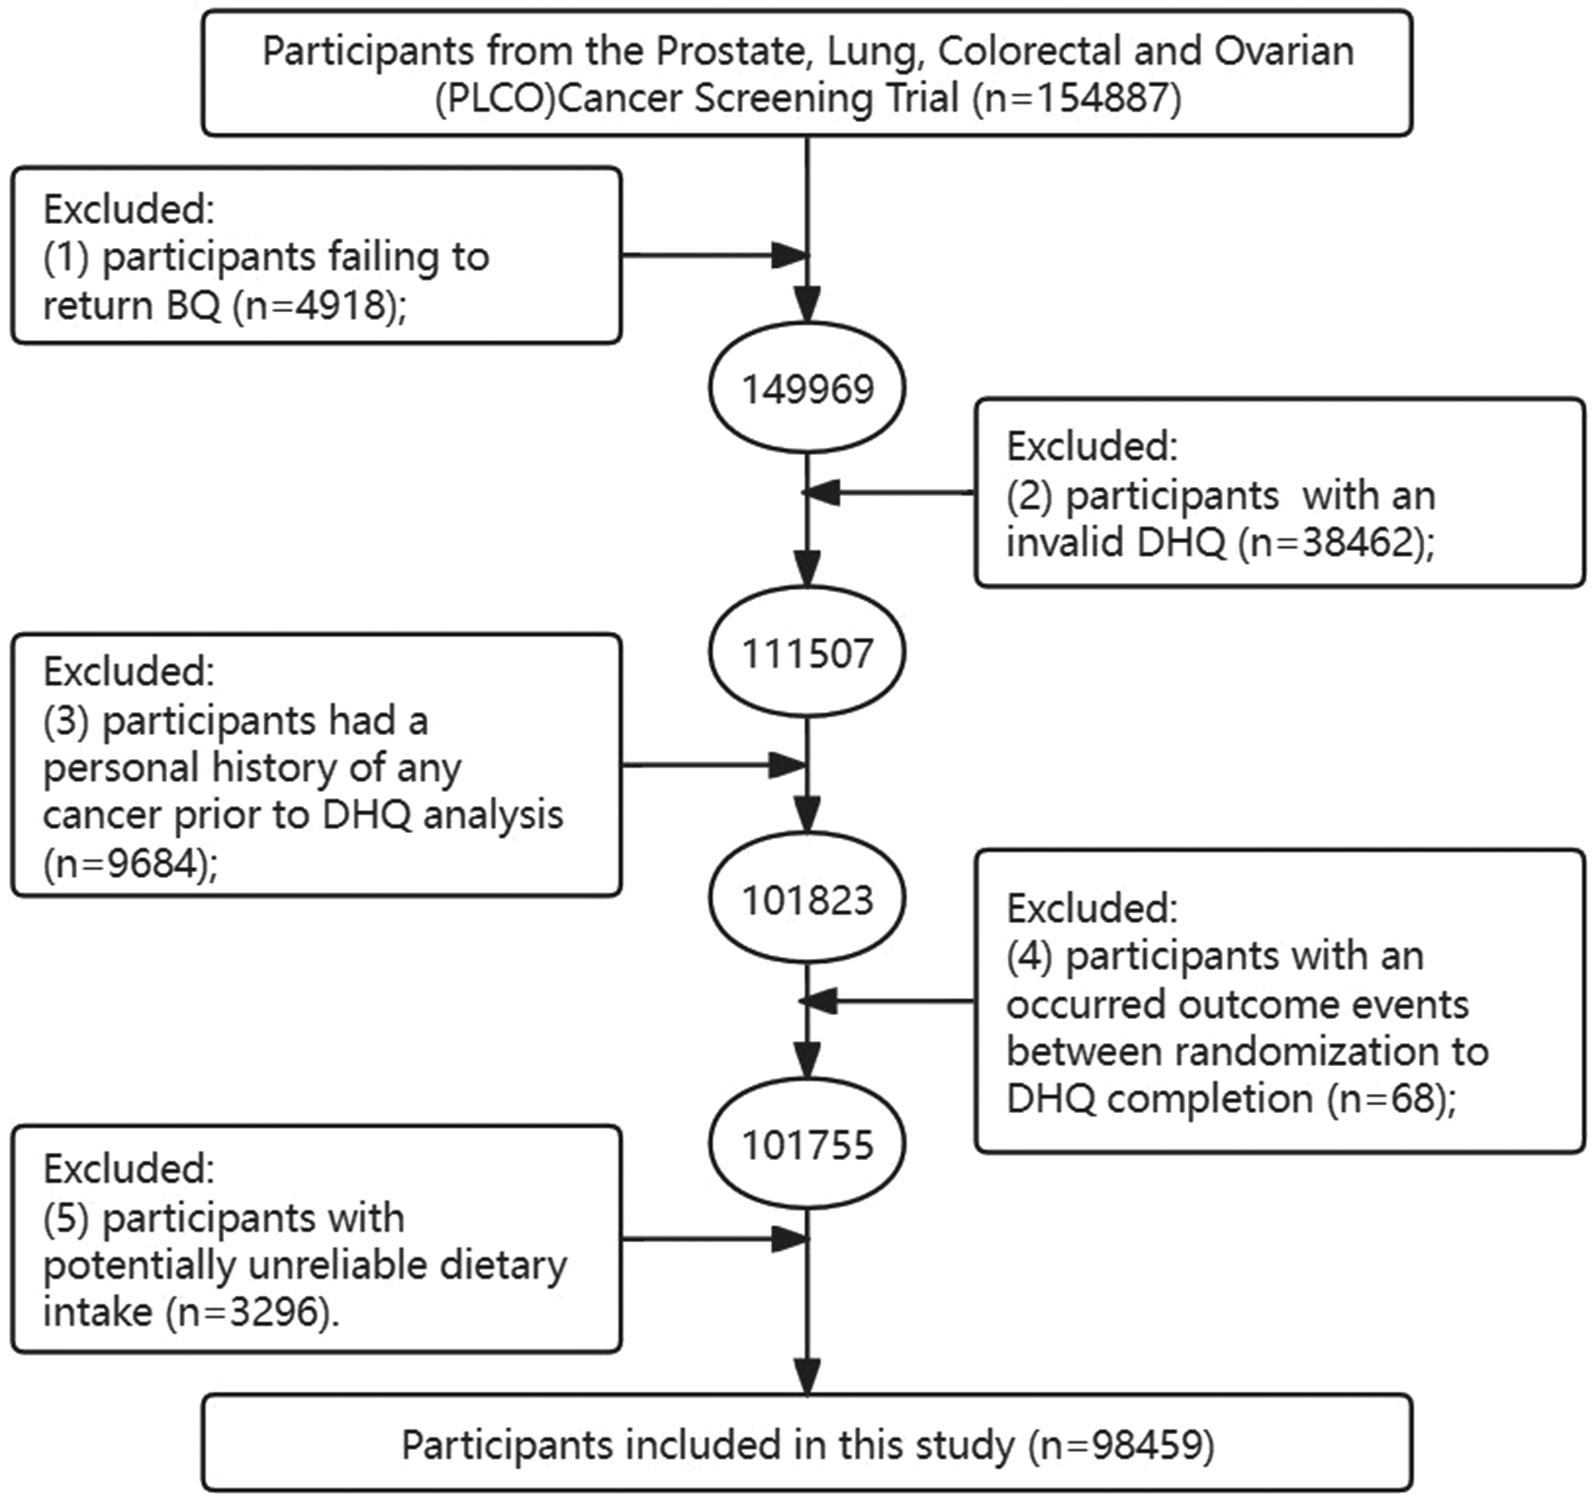
According to our study design, participants who met the following criteria were further excluded (Fig. 1): (i) participants failing to return the BQ (n = 4,918); (ii) participants with an invalid DHQ (n = 38,462), including those with less than eight DHQ response frequencies, and DHQ completion date after the date of death; (iii) participants had a personal history of any cancer prior to DHQ analysis (n = 9,648); (iv) participants with an occurred outcome events between randomization to DHQ completion (n = 68); (v) participants with potentially unreliable daily calorie intake (n = 3,296), such as females with calorie intake “<600 or > 3500 kcal/day” and males with calorie intake “<800 or > 4200 kcal/day” [16, 17]. Finally, there were 98,459 participants included in the analytical dataset. The details of follow-up are illustrated in Fig. 2.
Fig. 1
Flow Chart of Participant Selection Process. This figure illustrates the step-by-step procedure used to identify eligible participants for the study, utilizing data from the PLCO Cancer Screening Trial. It details the exclusion criteria applied, including non-return of the BQ and invalid responses in the DHQ. PLCO, Prostate, Lung, Colorectal, and Ovarian; BQ, baseline questionnaire; DHQ, diet history questionnaire
Fig. 2
Study Timeline and Follow-Up Protocol. This figure presents a detailed timeline of the study, from the initial participant recruitment phase through the follow-up period. It outlines the key milestones and data collection intervals of the study, providing a comprehensive view of the study’s design and execution
Ascertainment of lung cancerLung cancer diagnoses in the PLCO trial were confirmed through annual updates. Participants reported cancer diagnoses, including type, date, and physician details. Non-responders were contacted by phone or email. Diagnoses were validated using medical records and International Classification of Diseases for Oncology, 2nd Edition (ICD-O-2) codes. Vital status was ascertained through annual updates, reports from relatives or physicians, and the National Death Index. Participants diagnosed with cancer between 1992 and 2001 and before completing the dietary questionnaire were excluded.
Assessment of PDI scoreDietary assessment in this study was performed using the DHQ (version 1.0, NCI, 2007). The validity of the DHQ in dietary assessment had been substantiated in the Eating at America’s Table Study [18]. Daily food consumption was estimated by multiplying food frequency by portion size; daily intakes of energy and nutrients were estimated based on Nutrition Data Systems for Research and United States Department of Agriculture’s 1994–1996 Continuing Survey of Food Intakes by Individuals.
According to previously reported standards [10], the overall plant-based diet index (PDI) was used to calculate a summary score to measure adherence to this dietary pattern. Briefly, based on nutritional and culinary similarities, all food items listed in the DHQ were initially categorized into 18 predefined food groups by two experienced dietitians. Subsequently, these 18 food groups were further grouped into three broader categories as previously described [8, 10]: healthy plant foods (including whole grains, fruits, vegetables, nuts, legumes, vegetable oil, and tea and coffee), less healthy plant foods (including fruit juices, refined grains, potatoes, sugar sweetened beverages, and sweets and desserts), and animal foods (including animal fat, dairy, eggs, fish, meat, and miscellaneous animal-based foods) (Supplementary Table 1). Each participant’s intake of the 18 food groups was divided into quintiles, and a score ranging from 1 to 5 was assigned to each quintile. Positive scores were assigned to the healthy plant food groups and reverse scores were assigned to the less healthy plant and animal food groups. The resulting PDI scores ranged from 18 to 90, with higher scores indicating a healthier plant-based diet [19].
Assessment of covariatesBaseline covariates, such as participant gender (male, female), age, education level (college below, college graduate, postgraduate), race (non-Hispanic White, non-Hispanic Black, Hispanic, other race/ethnicity), weight, smoking status (never, current or former), aspirin use (no, yes), history of diabetes, history of emphysema, and family history of lung cancer (no, yes) were obtained from the BQ. Body Mass Index (BMI) was calculated as weight (kg) divided by height (m2). Additionally, the DHQ was used to collect data on participants’ alcohol consumption (no, yes), dietary nutrient intake (carbohydrate, fat, protein, fiber, cholesterol, sodium, potassium, magnesium, calcium, phosphorus, saturated fatty acids, and polyunsaturated fatty acids), pyramid food consumption (grain, fruits, vegetables, lean meats, and added sugars), and total energy intake from the diet. The total minutes per week of moderate to vigorous physical activity, termed physical activity level, was obtained from the SQX.
Statistical analysisMissing data could potentially impact the stability and accuracy of subsequent analyses. For missing values less than 5% of participants, continuous variables such as body mass index (BMI) were imputed with the median value. Categorical variables, including education level, family history of cancer, aspirin use, history of emphysema, and history of diabetes, were imputed with the mode value. Additionally, for physical activity with missing values exceeding 25% of participants, multiple imputation was employed. Supplementary Table 2 provides detailed information on imputed data.
Cox proportional hazards regression models calculated hazard ratios (HRs) and 95% confidence intervals (CIs) for the risk of lung cancer and its subtypes, adjusted for confounders. Participants were divided into quartiles based on PDI scores, with Q1 as the reference. Schoenfeld residuals assessed PDI score time-variability. Model 1 adjusted for age, race, and sex; Model 2 included additional adjustments. Restricted cubic spline (RCS) models evaluated non-linear associations between PDI scores and lung cancer risk.
Subgroup analyses were conducted after stratifying for age (≤ 65, > 65), sex (male, female), BMI (≤ 30, > 30), family history of lung cancer (no, yes, possibly), smoker (never, current or former), alcohol consumption (no, yes), aspirin use (no, yes), history of emphysema (no, yes), history of diabetes (no, yes), physical activity (≤ median, > median), and energy intake from diet (≤ median, > median). Interaction P-values were calculated to determine the significance of these potential confounding factors. Additionally, sensitivity analyses were performed to assess the robustness of the main analysis: (1) conducting analyses with non-missing data; (2) excluding participants with a history of emphysema or diabetes; (3) excluding participants from the initial two and four years of follow-up; and (4) further adjusting for pyramid food consumption and dietary component intake variables.
Descriptive statistics presented continuous and categorical variables as means ± standard deviations (SD) and percentages. Analyses used R software (version 4.2.1), with a two-sided P < 0.05 indicating significance.
Comments (0)