
Remember me

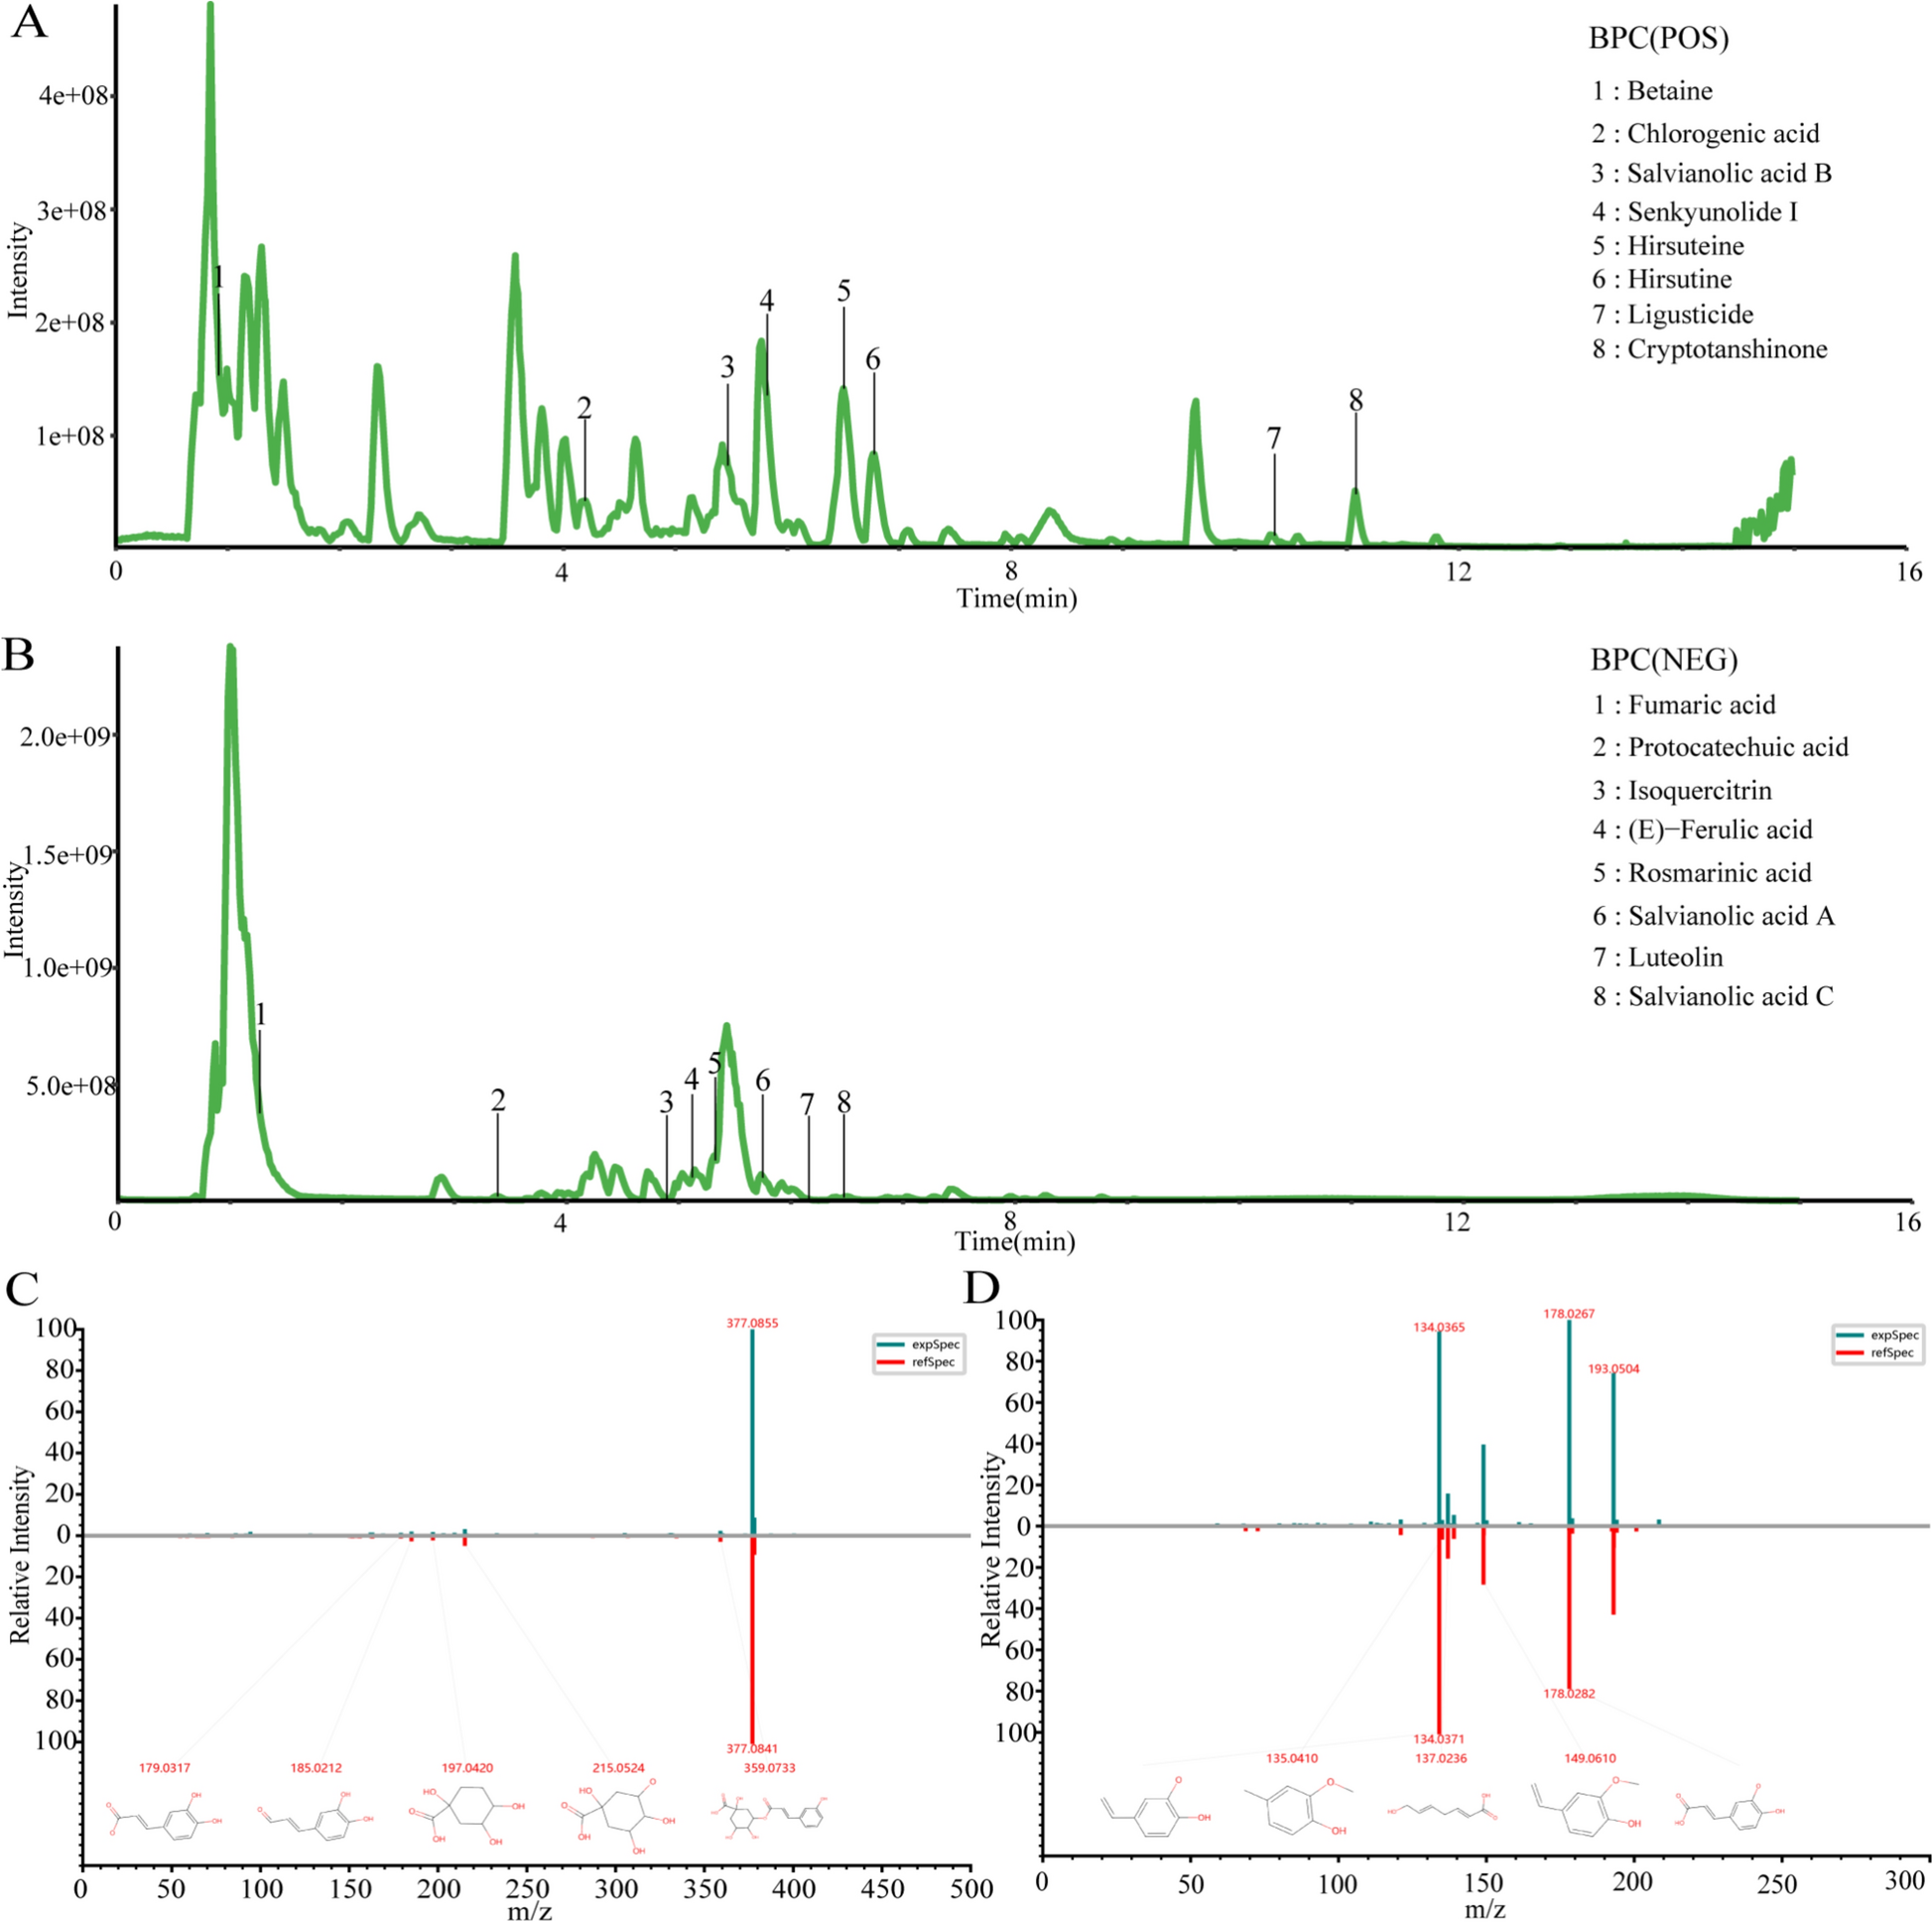

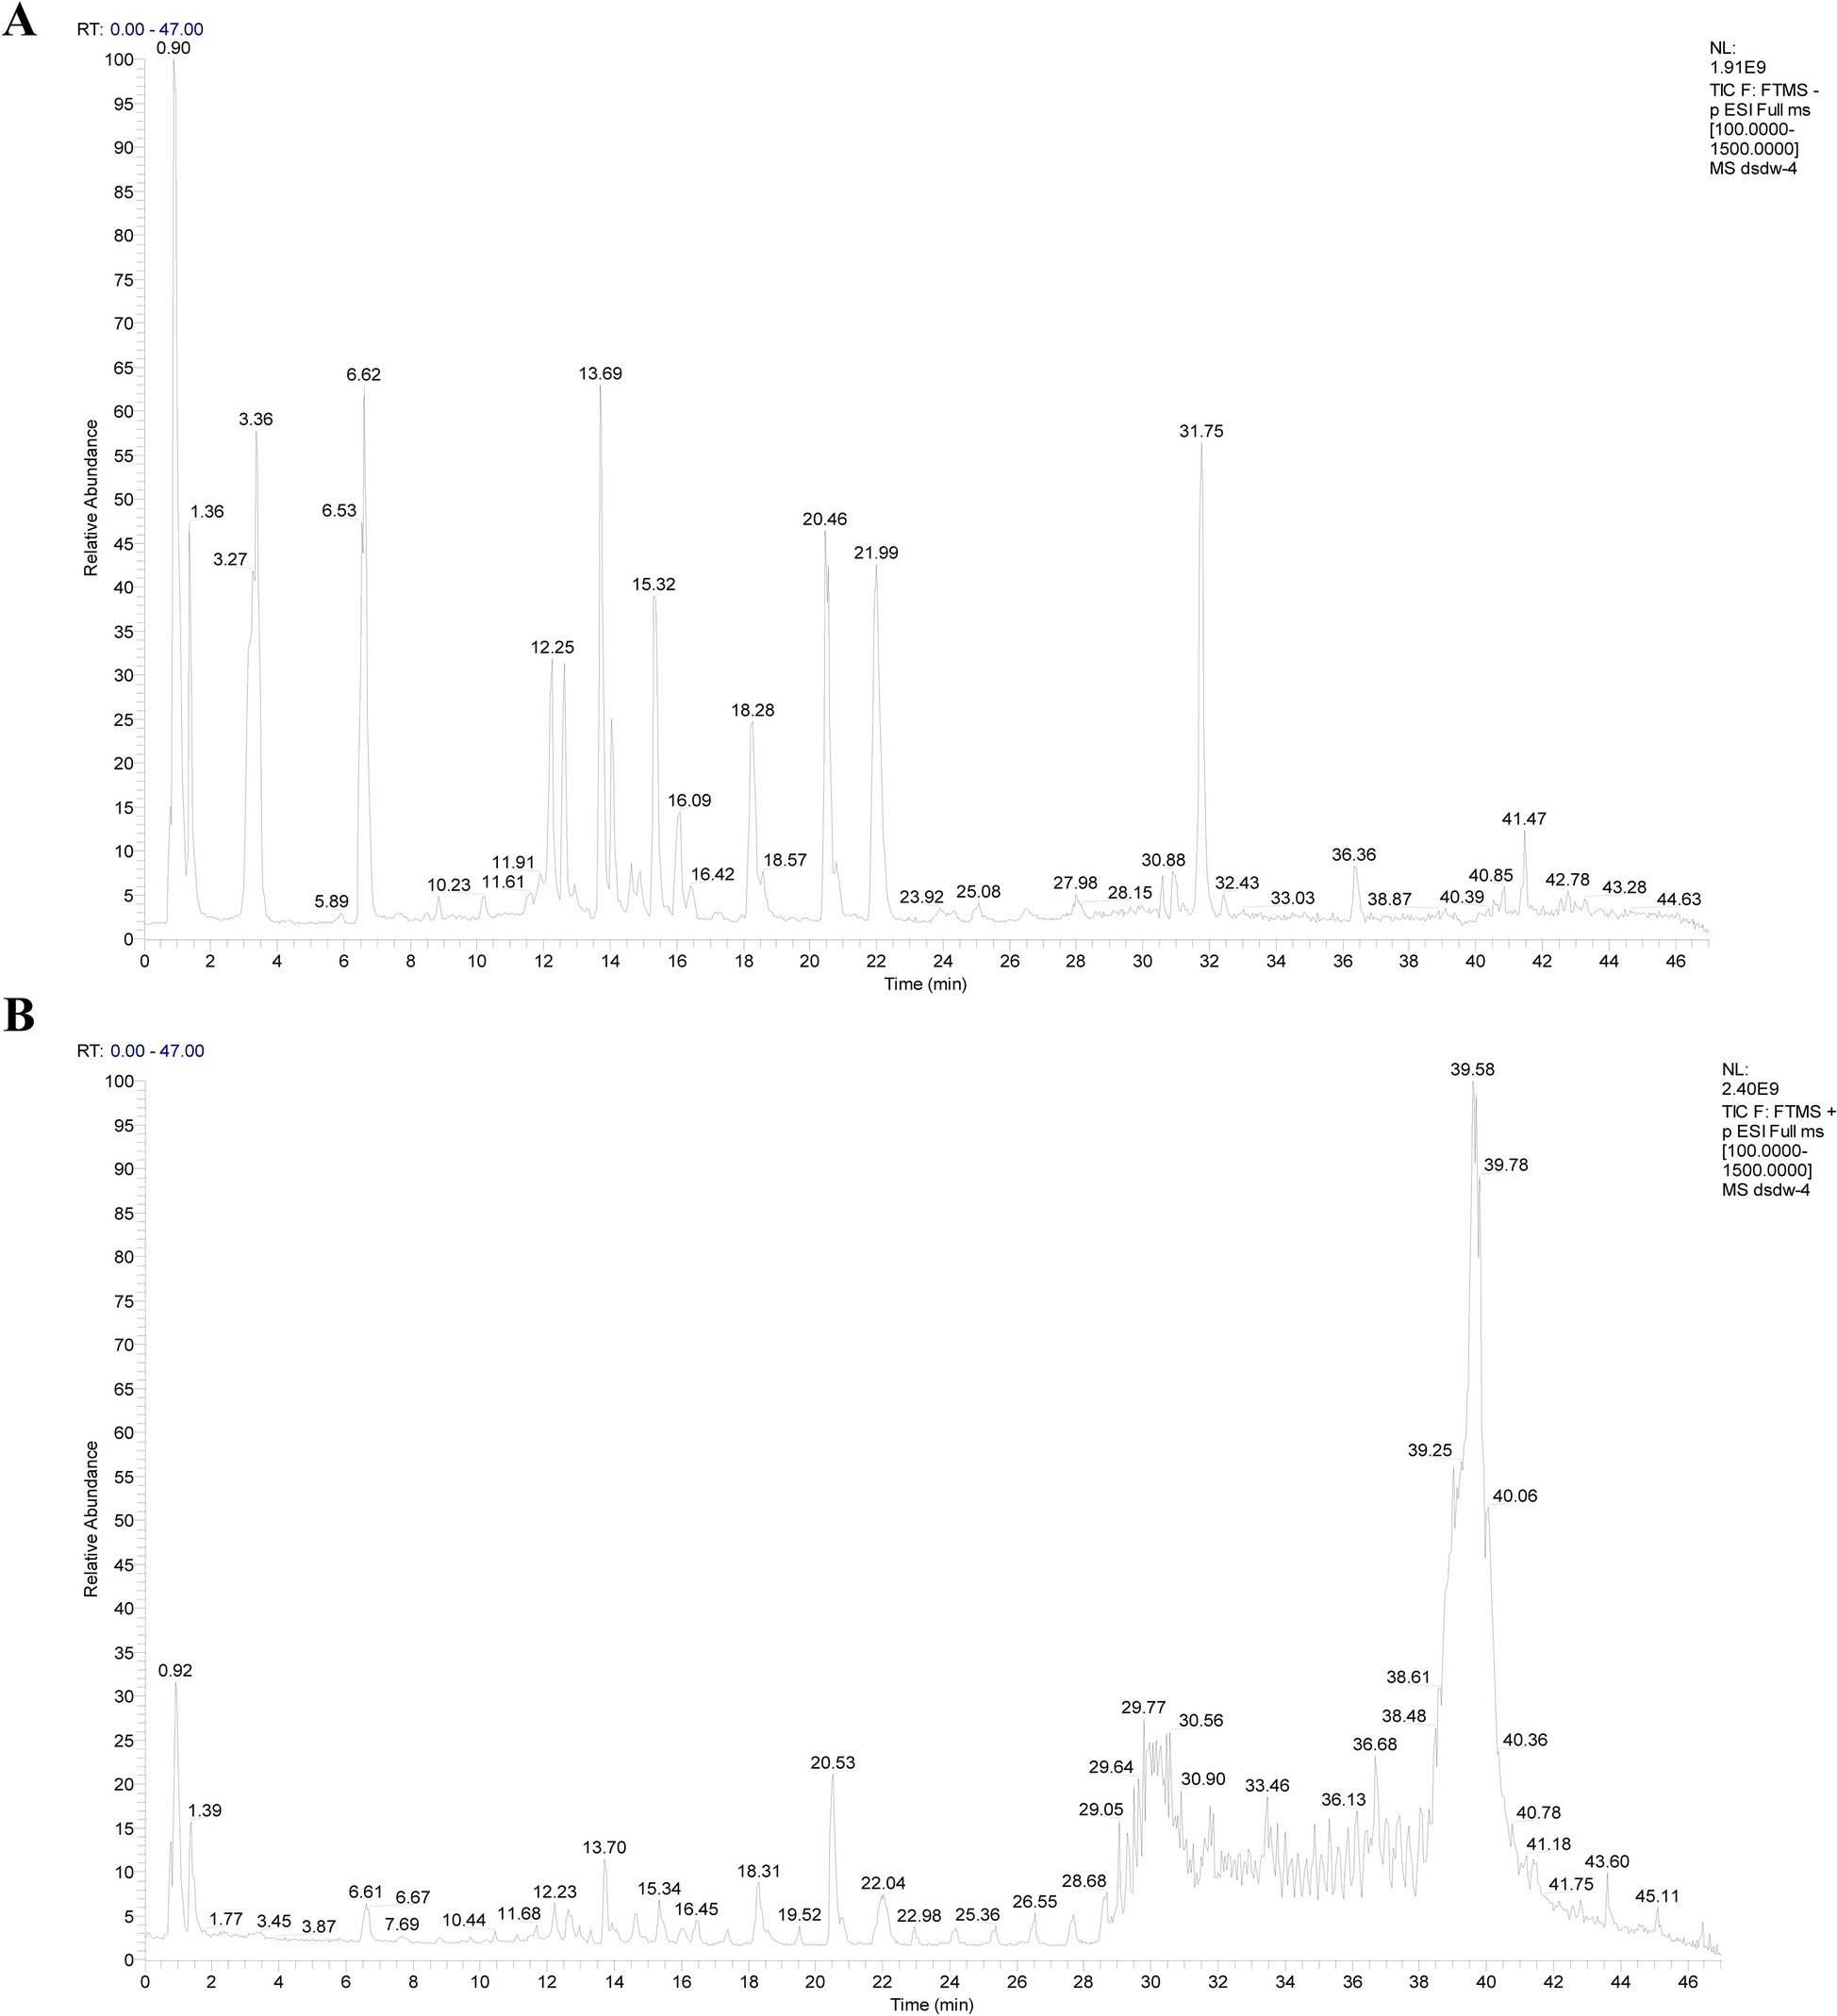


The extraction and preparation of FVTF from Fructus Viticis were conducted in accordance with the patent specification (Invention Patent number of China: ZL 201210591146.9). Composition of FVTF was analyzed using an ultra-high performance liquid chromatography (UPLC) in conjunction with mass spectrometer (MS). For further information, please refer to the Supplementary Materials and Methods.
Clinical specimensThe HCC tissue microarray (TMA) (Cat. HLivH180Su17) was acquired from Outdo BioTech (Shanghai, China), comprising 92 HCC tissues and 88 paired paracancerous tissues. The TMA facilitated the detection of DNMT1, miR-34a-5p, and FoxM1 expression. The clinicopathological characteristics of patients are detailed in Tables S1 and S2.
Cell lines and cultureThe MHCC97H and SK-Hep-1 human hepatocellular carcinoma cell lines were obtained from the Shanghai Chinese Academy of Sciences Cell Bank (Shanghai, China). Cells were cultured in DMEM (Gibco) supplemented with 10% fetal bovine serum (Gibco) in a humidified incubator containing 5% CO2 at 37 °C. Prior to experimental use, the verification of the cell lines’ authenticity was conducted through short tandem repeat (STR) DNA fingerprinting. Additionally, to ensure the absence of contamination, routine mycoplasma testing was performed using 4,6-diamidino-2-phenylindole staining, with consistent negative results.
Establishment of HCC cell lines with overexpression of DNMT1 and FoxM1MHCC97H HCC cells underwent infection with a lentiviral vector that expresses DNMT1 or transfected with pcDNA3.1-FoxM1, subsequently puromycin was employed for a selection period of two weeks. Stable overexpression of DNMT1 or FoxM1 was established in cancer cell lines, and this was validated through Western blot analysis.
Transient transfection50 μmol/L miR-34a-5p mimic, miR-34a-5p inhibitor and their respective negative control (Ribobio, China) were transfected into the specified HCC cells with the RiboFect™ CP Transfection Kit (Ribobio), respectively. 48 h post-transfection, the cells were collected and then underwent subsequent analyses.
Tumorsphere formation assayThe in vitro stem cell-like properties of HCC cells were evaluated through the tumorsphere formation assay, following the methodology previously outlined by our group [15]. Briefly, HCC cells were inoculated at a density of 1 × 10³ cells per well in 6-well plates with an ultralow attachment surface (Corning Inc.) and cultured in serum-free DMEM/F12 medium (Invitrogen), supplemented with 20 ng/ml bFGF, 20 ng/ml EGF, and 20 µl/ml B27 supplement (Invitrogen). After 7 days of incubation, tumorspheres exceeding 50 µm in diameter were enumerated using a Leica DMI4000 microscope.
Soft agar colony formation assayA soft agar colony formation assay was conducted to assess the anchorage-independent growth potential of HCC cells, following the methodology outlined by our group [16]. In summary, HCC cells were suspended in a 0.3% agar solution (Sigma) that included DMEM medium supplemented with 10% fetal calf serum (FCS) at a concentration of 5 × 10³ cells/ml. A 1 ml cell suspension was subsequently layered on top of a base consisting of 1 ml of 0.5% agar in DMEM supplemented with 10% FCS, placed in 6-well tissue culture plates. Following the plating process, 1 ml of DMEM medium supplemented with 10% FCS was added to each well, with media being refreshed every 3 days to ensure optimal conditions are sustained. Following a 12-day growth period, colonies with over 50 cells were measured using a microscope.
Analysis of CD133 +cell population by flow cytometryCancer cells were initially collected and incubated with 5% BSA (Sigma) at 4 °C for 30 min to inhibit nonspecific binding. Thereafter, PE-conjugated anti-CD133 antibody (1:100 dilution; #566596, BD Biosciences) or PE-conjugated rabbit isotype control IgG (1:50 dilution; #550617, BD Biosciences) was added to the cells and kept on ice for 30 min. Subsequent to staining, the cells were examined utilizing a FACSCanto flow cytometer (FACSCanto II, BD Biosciences). The resultant data were processed and analyzed with FlowJo 10.0 software.
PCR arrayTotal RNAs were extracted from MHCC97H treated with FVTF for 48 h and untreated control cells using TRIzol reagent (Invitrogen), respectively. The differential expressional genes were analyzed by a cancer stem cell-related gene PCR array (WC-MRNA0023-H; Wcgene Biotech, China). The 2−DDCt methodology was utilized for normalizing the expression levels of target genes in comparison to GAPDH. The ABI Gene Amp PCR System 9700 (ABI) was employed to conduct qRT-PCR.
Quantitative real-time PCRqRT-PCR was conducted to assess the expression levels of 17 cancer stem-related miRNAs, as well as DNMT1, FoxM1, Bmi1, Sox2 and Oct4 in the specified cell lines, following the procedure outlined by our group previously [17]. The primer sequences utilized in this analysis can be found in Tables S3 and S4. Further details can be found in the Supplementary Materials and Methods.
Western blotWestern blot analysis was conducted to evaluate the expression of DNMT1, FoxM1, and CD44 proteins in the designated HCC cells, as previously outlined by our group [15]. Protein extraction was carried out using RIPA lysis buffer. Identical quantities of protein were separated by SDS-PAGE and subsequently transferred to the PVDF membrane. After blocking with 5% non-fat milk powder diluted in TBST, they were incubated with the specified antibodies: DNMT1 (1:1000 dilution), CD44 (1:1000 dilution), FoxM1 (1:1000 dilution), and β-actin GAPDH (1:2000 dilution). Following primary antibody incubation, the membranes were exposed to HRP-conjugated anti-rabbit IgG (1:2000 dilution) or HRP-conjugated anti-mouse IgG (1:2000 dilution) for 2 h at room temperature. Protein signals were then detected employing the enhanced chemiluminescence reagent (Roche).
3′UTR dual luciferase reporter assayTo investigate whether FoxM1 represents a target gene of miR-34a-5p in HCC cells, the 3'UTR dual luciferase reporter assay was conducted, as previously described by our group [18]. In brief, a dual luciferase reporter plasmid containing either the wild-type FoxM1 3'UTR or a mutated variant with modifications at the predicted miR-34a-5p binding sites was constructed by GeneCopoeia. HCC cells underwent co-transfection with the plasmid alongside either miR-34a-5p mimic or a control mimic (RiboBio) using Lipofectamine 2000 (Invitrogen). Following a 48 h incubation period, the cells were collected, and luciferase activity was assessed. Firefly and renilla luciferase activities were quantified using the Dual-Luciferase Reporter Assay System (Promega), and the final readings were obtained using a luminometer (Promega).
Analysis of miR-34a-5p promoter methylation by pyrosequencingPyrosequencing was performed to determine DNA methylation levels in the promoter region of miR-34a-5p in the indicated cells. The three CpGs rich regions upstream from miR-34a-5p’s stem-loop sequence is shown in Fig. S1. The primer sequences utilized for the analysis were developed with the aid of Qiagen’s Pyromark Assay Design 2.0, as detailed in Table S5. The EZ DNA methylation kit (Zymo Research) was utilized for the detection of bisulfite modification. The target was amplified using specific primers by PCR. The reaction cycle was initiated with denaturation at 95 ℃ for 3 min, succeeded by 40 amplification cycles consisting of 30 s at 94 ℃, 30 s at 56 ℃, and 1 min at 72 ℃, then extension at 72 ℃ for 10 min using Qiagen PyroMark PCR kit. Following amplification, the target PCR product was sequenced on the PyroMark Q96 instrument (Qiagen). The pyrosequencing data, focusing on the incorporation of T and C nucleotides at the CpG sites, were analyzed using the CpG methylation analysis tool integrated within Qiagen’s PyroMark Q24 software. This software-generated output quantifies CpG methylation levels as a percentage, ranging from 0% (unmethylated) to 100% (fully methylated).
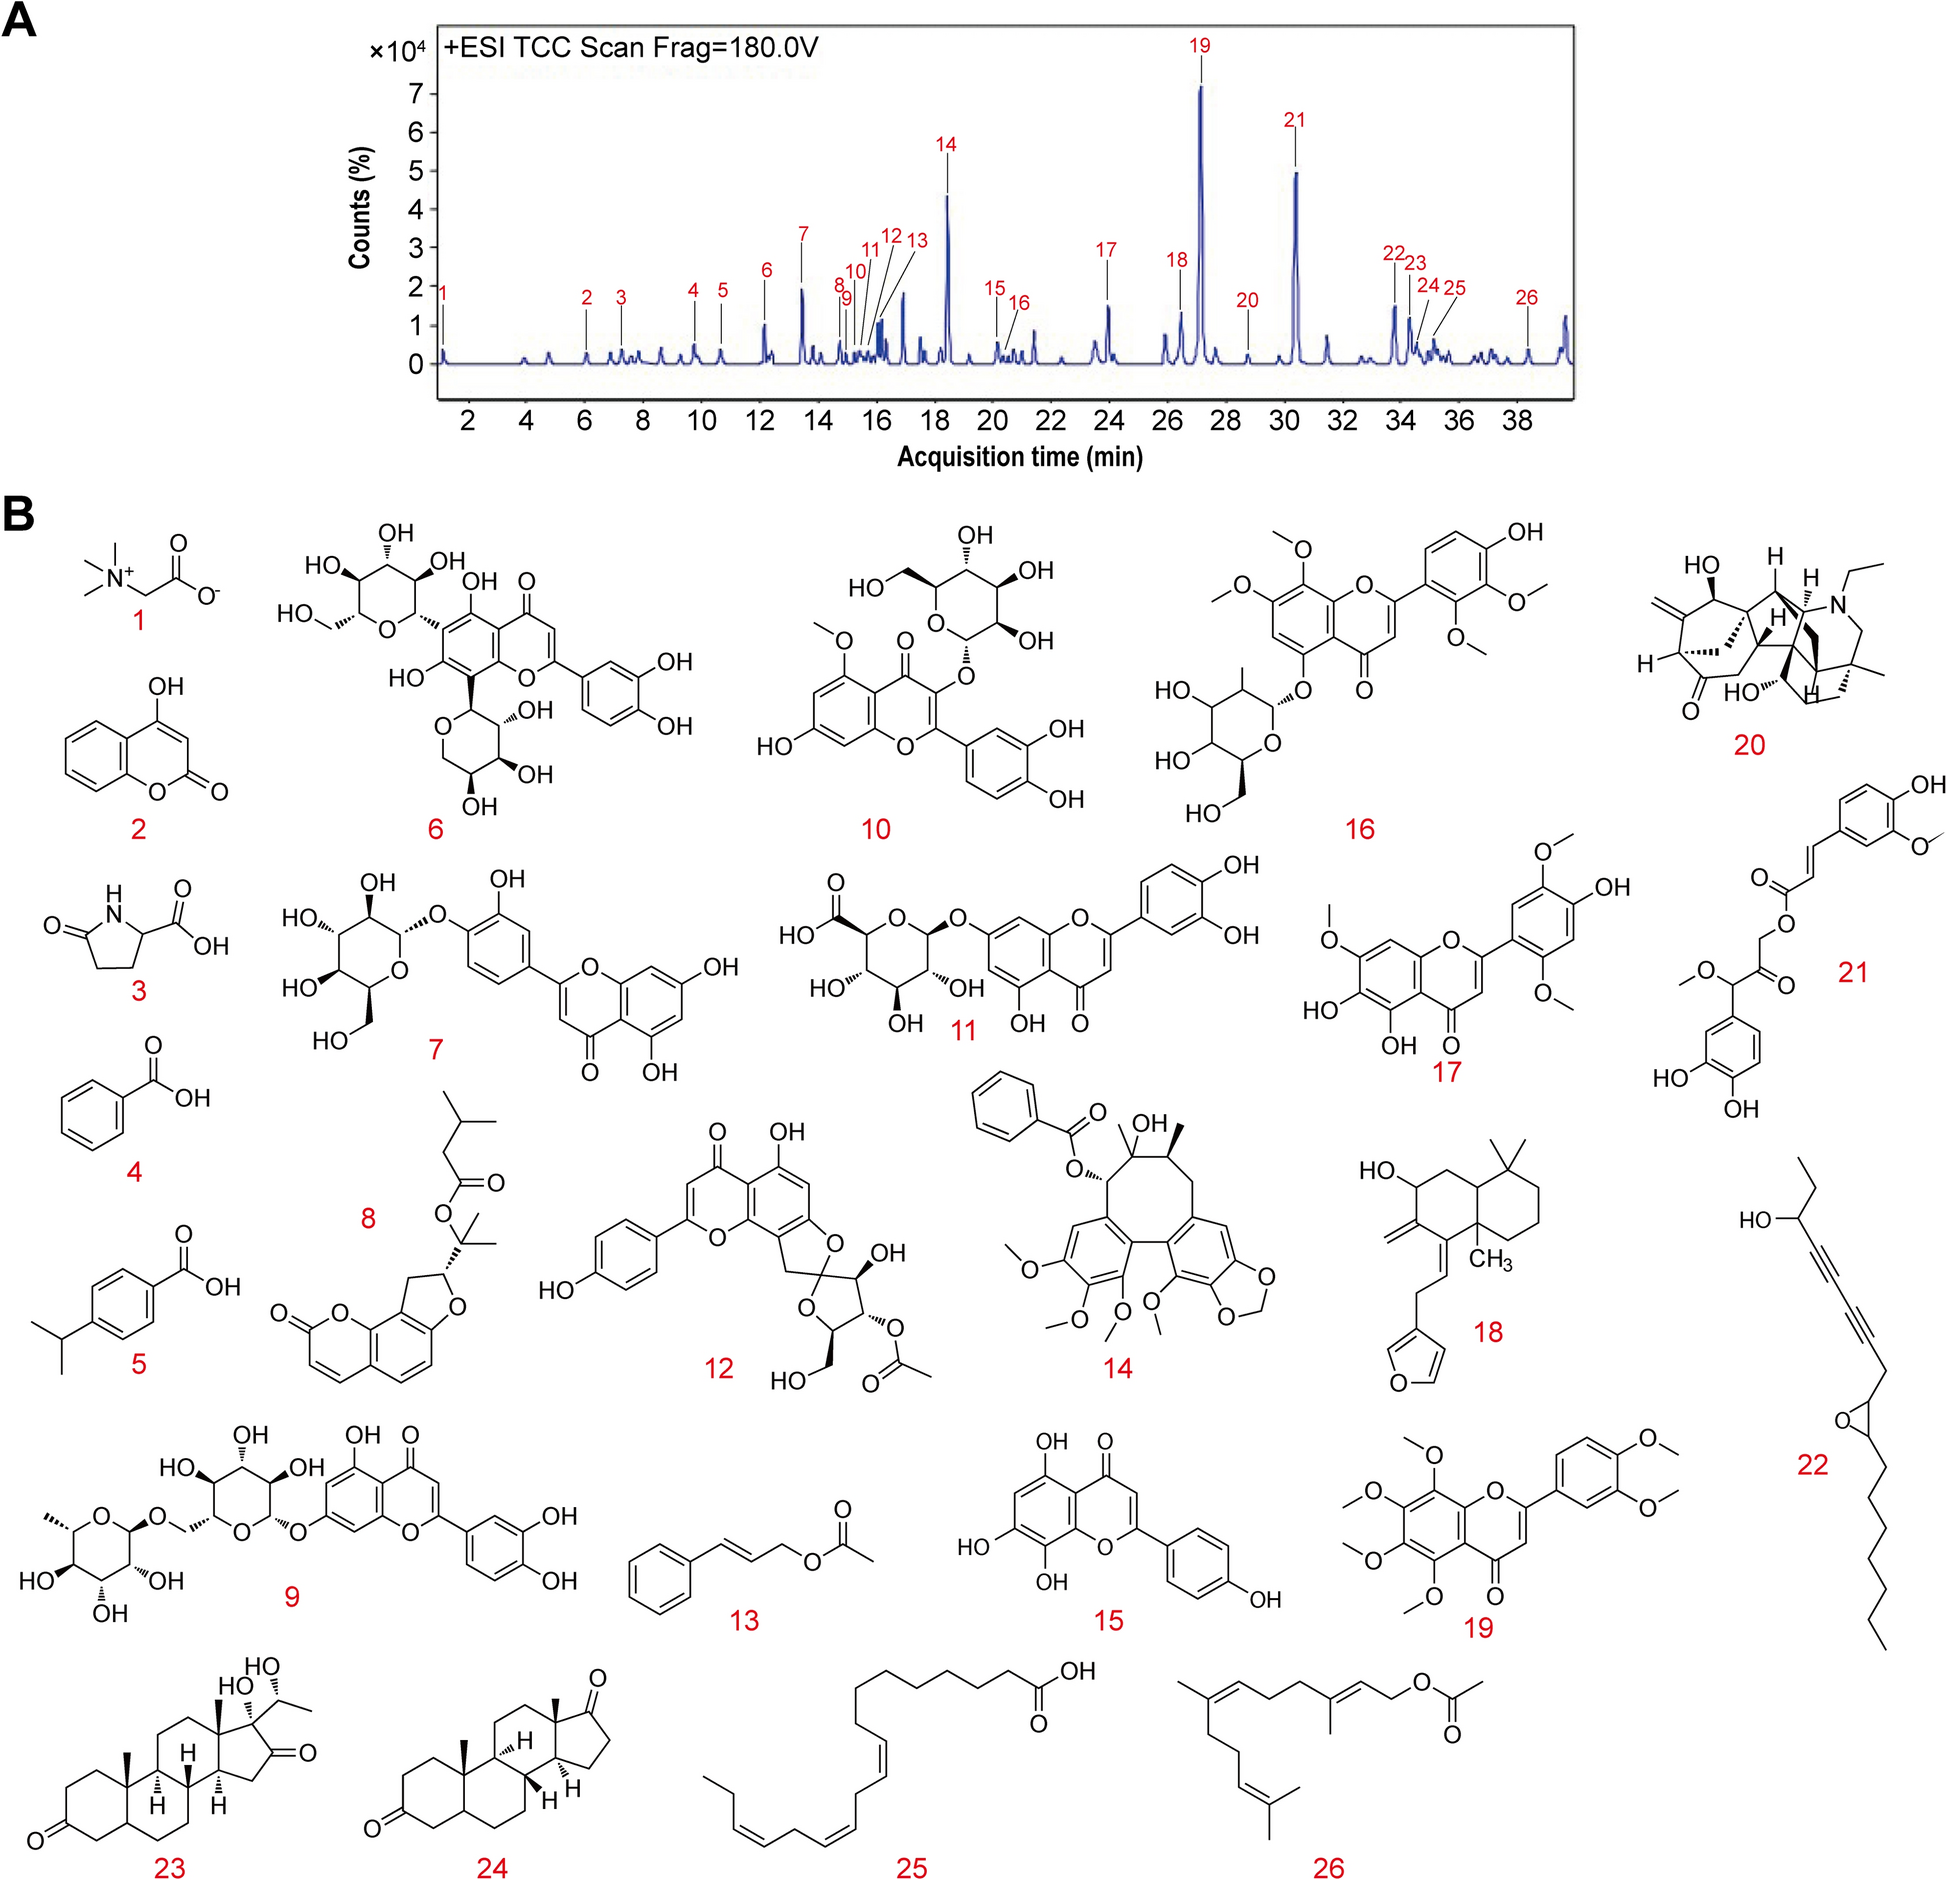
Fig. 1
Identification of main chemical components in FVTF by UPLC-MS/MS. A A representative UPLC chromatograms of the 26 compounds in the FVTF. B The structure of 26 main chemical components in the FVTF
Animal experimentsTo assess the effect of FVTF on the in vivo tumor-initiating capacity, tumorspheres of HCC MHCC97H cells were dissociated into single-cell suspension, serial dilutions of tumorsphere cells (5 × 10⁴, 1 × 10⁴, 5 × 10³, or 1 × 10³) were administered via subcutaneous injection into nude mice (n = 4 mice each group). After the inoculation, the mice were assigned at random to either the experimental or the control group (n = 4 mice each group). Mice in the experimental group received FVTF treatment (50 or 100 mg/kg once daily, 3 times one week for continuous 3 weeks) by intragastric gavage, and mice in the control group received the equivalent olive by intragastric gavage. The detailed schematic representation of the treatment plans is illustrated in Fig. 2D.
Fig. 2
FVTF inhibits HCC cell stem properties in vitro and in vivo. MHCC97H and SK-Hep-1 HCC cells were treated with indicated concentrations of FVTF (0.0, 1.0, 3.0, 10.0 μg/ml), and subjected to in vitro cancer stem properties analyses. A Representative results (left) and statistical analysis (right) of tumorspheres and soft agar colonies formation in the HCC cells treated with FVTF. B Western blot analysis showing the expression levels of CD44 in the HCC cells treated with FVTF. C qRT-PCR showing the expression levels of BMI1, SOX2 and OCT4 in the HCC cells treated with FVTF. D–G FVTF decreases the tumor-initiating capacity of HCC cells in vivo. D Schematic diagram illustrating the treatment plan of FVTF in the nude mice with xenografts generated from MHCC97H cells. E The photographs of xenografts 35 days after initial FVTF treatment. F Summary data of tumor-initiation capacity of the HCC cells after initial FVTF treatment. G Tumor volume was periodically monitored and tumor growth curves of 1 × 10³, 5 × 10³, 1 × 10⁴ and 5 × 10⁴ HCC cells were plotted, and average tumor weight after initial FVTF treatment is also shown. Scale bars = 100 μm. *P < 0.05; **P < 0.01; **P < 0.001; ****P < 0.0001; ns, no significance
The mice were observed daily for the presence of palpable tumors. The tumor volume was calculated using caliper and the modified ellipsoid formula: (length × width2/2). After a period of five weeks, they were humanely euthanized by cervical dislocation, after that the subcutaneous xenografts were harvested. The tumor tissues underwent fixation in 4% paraformaldehyde and were then embedded in paraffin for the purposes of immunohistochemistry and in situ hybridization studies.
Immunohistochemisry and in situ hybridizationImmunohistochemistry of DNMT1 and FoxM1, and in situ hybridization (ISH) of miR-34a-5p were conducted on the TMA. For additional details, see the Supplementary Materials and Methods.
Statistical analysisIBM SPSS 22 was employed for statistical analysis, while GraphPad Prism 8.0 was used to generate data visualizations. The data are presented as mean ± standard deviation (SD). Group comparisons were performed using Student's t test and/or one-way ANOVA, followed by Dunnett's tests. The Pearson correlation test was used to assess correlations. Kaplan–Meier curves were constructed for survival analysis, and the log-rank test was employed to evaluate statistical significance. Statistical significance was defined as a P-value lower than 0.05 (P < 0.05).
Comments (0)