
Remember me

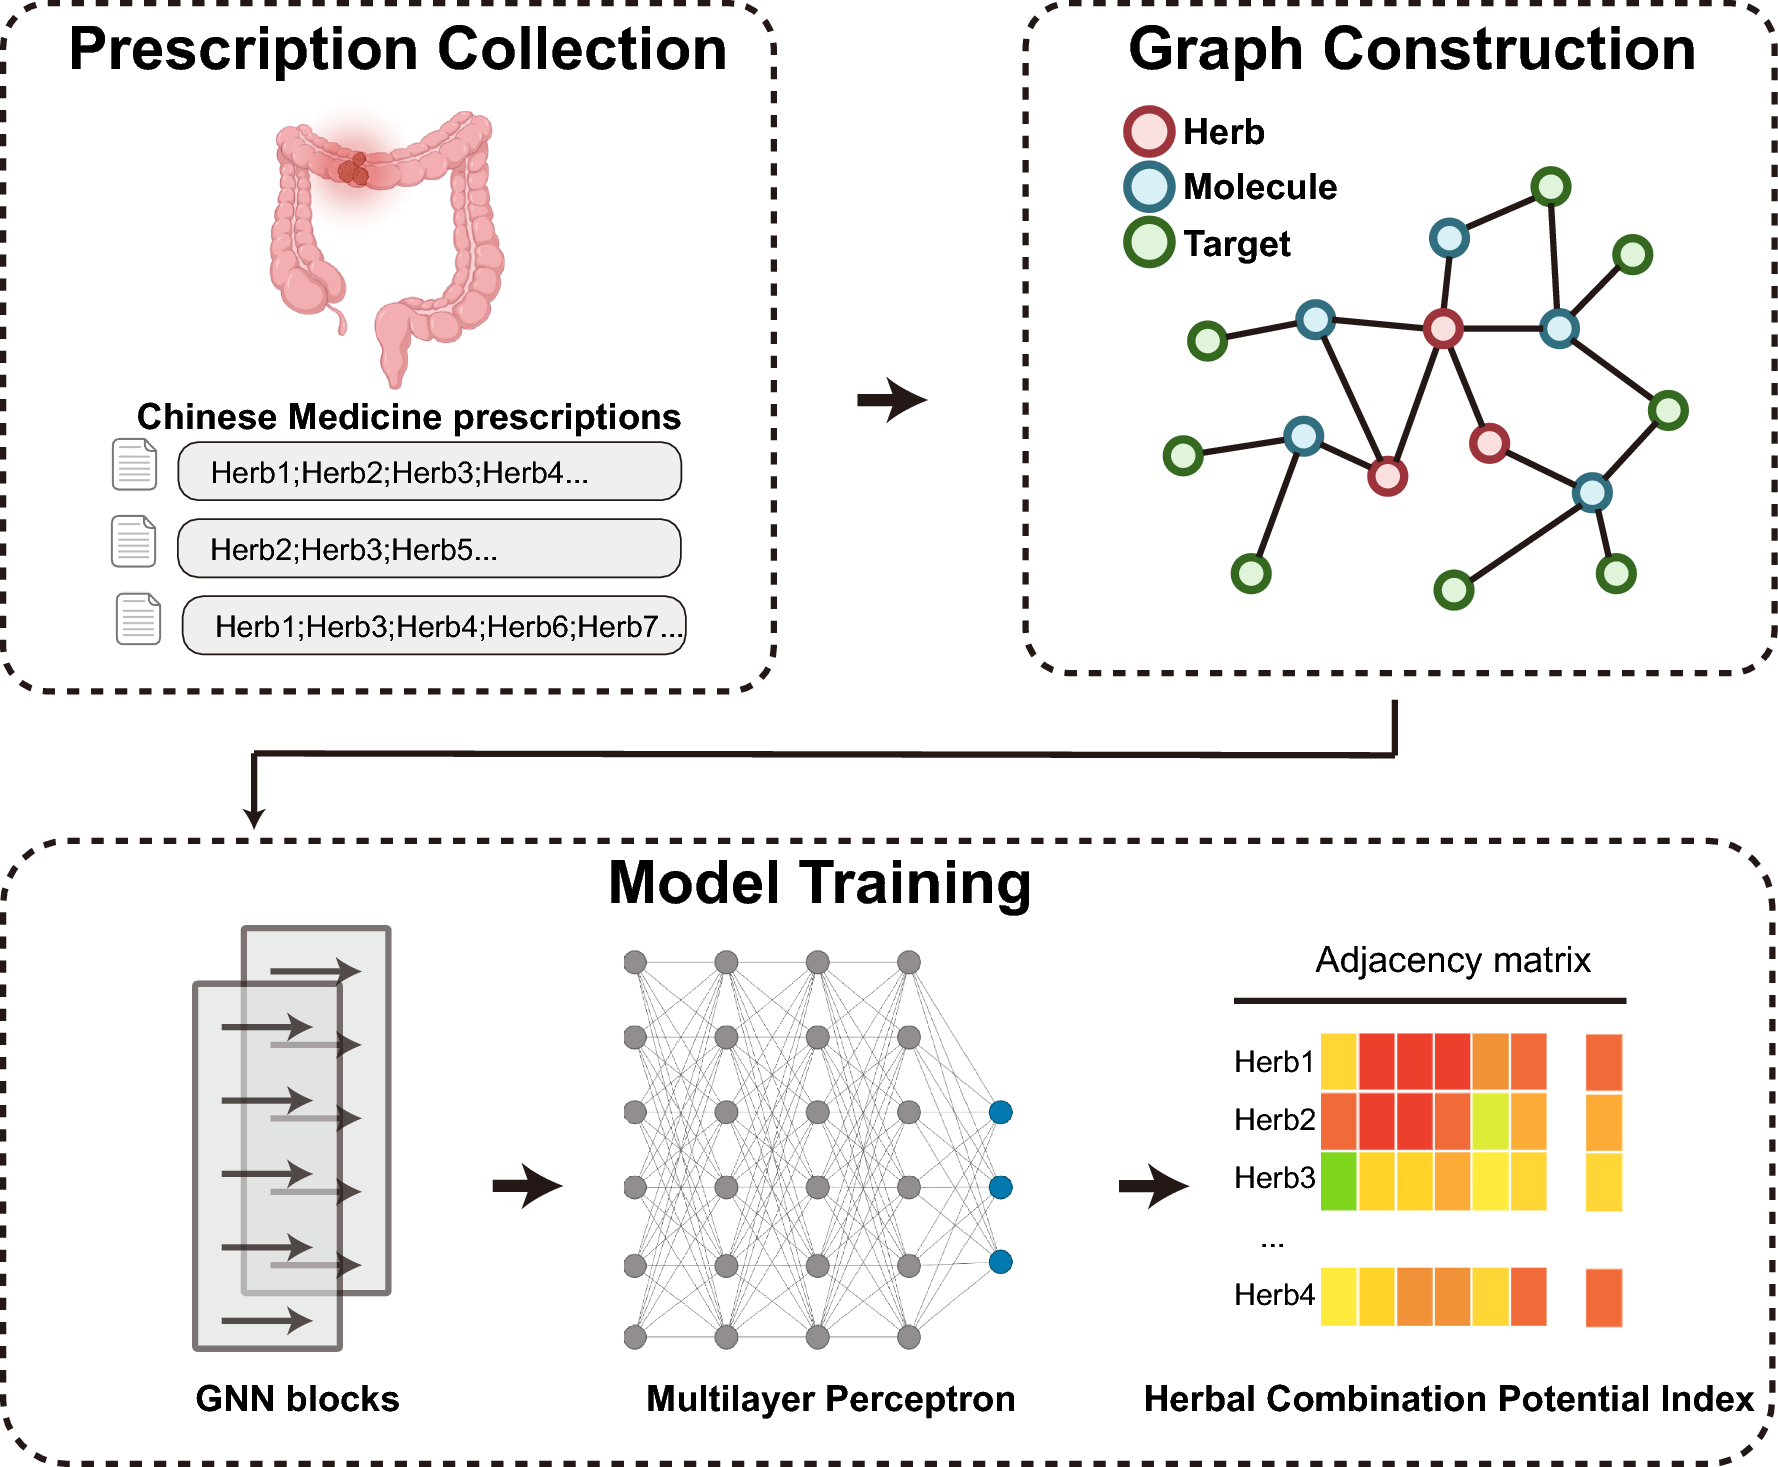

In this study, we gathered data on 72 TCM prescriptions used to treat colorectal adenoma from clinical trials and published literature. Each prescription comprises multiple herbs, each of which may contain various active small-molecule compounds and their corresponding targets. By integrating this information, we constructed a heterogeneous graph network to comprehensively represent the complex relationships among herbs, small molecules, and targets.
This heterogeneous network includes three types of nodes: herbs, small molecules, and targets. The network contains 122 herb nodes, 234 small-molecule nodes, and 657 target nodes, interconnected by 24,608 edges (Table 1).
Table 1 Composition of the heterogeneous diagramModel structureTo quantify the potential compatibility of TCM prescriptions, we have developed a model framework based on GNN. The GNN model consists of two components: (1) The Graph Convolutional Network (GCN) layers propagate and aggregate features within the heterogeneous graph structure, capturing both local network topological information and the characteristics of each herb within the formulation. The first GCN layer extracts the local neighborhood features of each node and embeds them into a lower-dimensional feature space; subsequently, the second GCN layer extracts higher-order neighborhood features, providing a more comprehensive representation of the herbs within the network; (2) A Multi-Layer Perceptron (MLP) is then employed to predict the compatibility between herbs. This process is framed as a supervised learning task, with supervisory signals derived from the known herb-herb compatibility values calculated from the herbal prescription information we collected (Fig. 1). This design enables the model to effectively integrate structural information with expert knowledge in herb compatibility prediction tasks, thereby enhancing both the predictive accuracy and interpretability of the model.
Fig. 1
Model workflow for herbal compatibility prediction
Data collection and filteringThis study conducted a comprehensive computer-based search across several databases, including China National Knowledge Infrastructure (CNKI), Wanfang Data Knowledge Service Platform, VIP Database, and PubMed, with a retrieval time span from the establishment of each database to March 2024. Search terms included "colorectal adenomas," "colorectal polyps," "traditional Chinese medicine," and "herb," among other related keywords.
The inclusion criteria comprised clinical trials based on the clinical experiences of renowned TCM practitioners in the treatment of colorectal adenomas, specifically randomized controlled trials (RCTs) or clinical studies on traditional Chinese medicine. The literature must explicitly list the drug composition of the formulation and evaluate its efficacy. There were no restrictions on the types of TCM formulations used, and decoctions, granules, capsules, and other forms were all eligible for inclusion. If multiple studies employed the same prescription or if the same article was published multiple times, only one study was retained. Studies were excluded if they were duplicates, lacked a clear listing of the prescription composition or efficacy, were review articles, or had incomplete or unclear descriptions of the formulations. These criteria ensured that the included studies provided reliable clinical data and accurate prescription information, thereby offering high-quality reference material for subsequent analysis.
Molecular and target information, as well as their interactions, were sourced from the Traditional Chinese Medicine System Pharmacology Database and Analysis Platform (TCMSP) [19]. Small molecules were selected based on the criteria of oral bioavailability (OB) ≥ 30 and drug likeness (DL) ≥ 0.18. Verified targets were employed to ensure that the selected molecules and their corresponding interactions held reliability and relevance for further research.
Herb-herb compatibility calculationWe quantified the compatibility of each pair of herbs using their co-occurrence frequency across 72 prescriptions. The formula is given by:
$$C_ \, = \, (N_ \, / \, \sum\nolimits_ m \, (n_ (n_ \, - ) \, /)) \, \times 000$$
where Cij denotes the compatibility score between herb i and herb j, Nij represents the number of times herbs i and j co-occur across all prescriptions, and m is the total number of prescriptions.
Feature aggregationIn the feature aggregation process, we implemented a Graph Convolutional Network (GCN) that updates each node's representation by aggregating features from neighboring nodes. Specifically, we utilized the SAGEConv operator to achieve this aggregation. Each layer of the GCN updates the node's feature vector, incorporating not only the node's own information but also the features from its neighborhood. The GCN layer's update formula is as follows:
$$}_^ \right)}} = }\left( }^ \cdot }\left( }_^ \, ,}_ \left( } \right)^ } \right)} \right)$$
Where hv(l+1) represents the embedding of node v at layer l+ 1, W(1) is the weight matrix for layer l, RELU is a non-linear activation function, and CONCAT is the concatenation operation, merging the current features of the node and its neighborhood. By stacking multiple GCN layers, the model can extract more intricate features from local neighborhoods, yielding more semantically meaningful node representations.
Herb relationship predictorIn the herb relationship prediction module, we used a Multi-Layer Perceptron (MLP) as the relationship predictor for pairs of herb nodes. For any pair of herb nodes, we first extract their embedding vectors Hvi and Hvj and then concatenate these vectors to form a new feature representation Hij:
Next, this concatenated feature Hij is fed into the MLP network to predict the relationship strength, yielding a final score ŷij that represents the relationship strength between the two herb nodes:
$$\widehat_ \, = }(}_ )$$
This predictor uses a non-linear mapping to capture the complex relationship structure between herb nodes.
Loss calculationTo train the model, we adopted the Mean Squared Error(MSE) loss function to evaluate the deviation between predicted values and true values. The formula for this loss function is:
$$} = /}\sum\nolimits_^ - \widehat_ } \right)}^$$
Where M represents the number of herb node pairs, yi is the true relationship value for the i-th pair of herb nodes, and ŷi is the predicted value for that pair. The MSE loss function measures the model’s accuracy by computing the squared difference between predicted and true values. During training, by minimizing the MSE loss, the model parameters are updated, leading to progressive convergence and improved accuracy in predicting herb node relationships.
Hyperparameter selection and cross-validationWe employed a combination of grid search and five-fold cross-validation to evaluate the model's generalization ability and optimize the hyperparameters. By using MSE and the Coefficient of Determination (R2) as evaluation metrics, we systematically compared the model's performance across different hyperparameter combinations (Table 2). The results demonstrated that the combination of 256 hidden layer nodes and a learning rate of 0.001 exhibited superior performance in all experiments. This configuration achieved favorable results across multiple evaluation metrics, indicating strong generalization ability of the model under this parameter setting.
Table 2 Hyperparameter search space and model performanceHerbal combination potential index calculation and prescription efficacy predictionThe Herbal Combination Potential Index (HCPI) is used to quantify the interaction potential between two herbs. Specifically, we utilize the trained model to predict the interaction strength between two herb nodes, yielding a predicted score ŷ. To further normalize this value and enhance its interpretability, we apply a log₂ transformation, defining the HCPI as follows:
$$}\, = \,\log_ (\widehat\, + \,).$$
where ŷ denotes the predicted interaction strength between the two herb nodes as estimated by the model.
For prescription efficacy prediction, we hypothesize that higher compatibility between herbs within a prescription corresponds to greater formulation efficacy, exerting a positive influence on overall therapeutic outcomes. Based on this assumption, we quantify the potential formulation effect by computing the average herb-to-herb compatibility within each prescription. To better align with the requirements of the predictive model, we take the logarithm (log₂) of this average compatibility value, using it as an indicator for efficacy prediction.
Gene ontology enrichment analysisIn this study, we utilized the functions provided by the ClusterProfiler package to perform Gene Ontology (GO) enrichment analysis [20]. The analysis was conducted using the default method, which involves the hypergeometric distribution test. This statistical approach is implemented to determine the significance of GO term enrichment within a given set of genes. Furthermore, to control the false discovery rate associated with multiple hypothesis testing, we applied the Benjamini & Hochberg method.
Construction and analysis of PPI networkIn this study, we employed the STRING database in conjunction with Cytoscape software to construct a protein–protein interaction (PPI) network for the intersecting targets of the prescription and colorectal adenoma. Initially, we retrieved the relevant protein interaction data from the STRING database, which was then imported into Cytoscape for the construction and visualization of the PPI network. Within Cytoscape, we utilized the Analyzer Network plugin to perform an in-depth analysis of the constructed PPI network.
Molecular docking simulationIn this study, AutoDock Vina was utilized for molecular docking simulations to investigate the interactions between ligands and the receptor protein. The receptor protein structure was obtained from the Protein Data Bank (PDB) and preprocessed using software to remove water molecules and ligands, followed by the addition of polar hydrogen atoms and assignment of Gasteiger charges. Ligands were either retrieved from databases or generated using chemical drawing software, with subsequent addition of hydrogens and charge computation. Both receptor and ligand files were then converted to the necessary PDBQT format for AutoDock Vina. The docking grid was centered on the active site of the receptor, and docking was performed to evaluate binding affinities.
CCK-8 cell viability assayDigestion, centrifugation, and suspension counting of HCT116 and HT29 with moderate density were performed. Cells of 5*103/ well were inoculated on a 96-well plate and cultured at 37℃ and 5% CO2 for 24 h. The drug concentration of Oxyberberine was 0, 0.3, 3, 7.5, 15, 30, 75, 150, 300, 750 μM, and the drug concentration of Maackiain was 0, 5, 10, 20, 50, 100, 200 nM. At least three.
wells were added to the 96-well plate at each concentration and cultured at 37℃ and 5%CO2 for 24 h. After 24 h of culture, 10μL of CCK-8 solution was added to each well, and cultured at 37℃ and 5%CO2 for 2 h. Absorbance was measured at 450 nm by enzyme-linked immunoassay, and the cell viability was calculated.
Comments (0)