Bioinformatics analysis
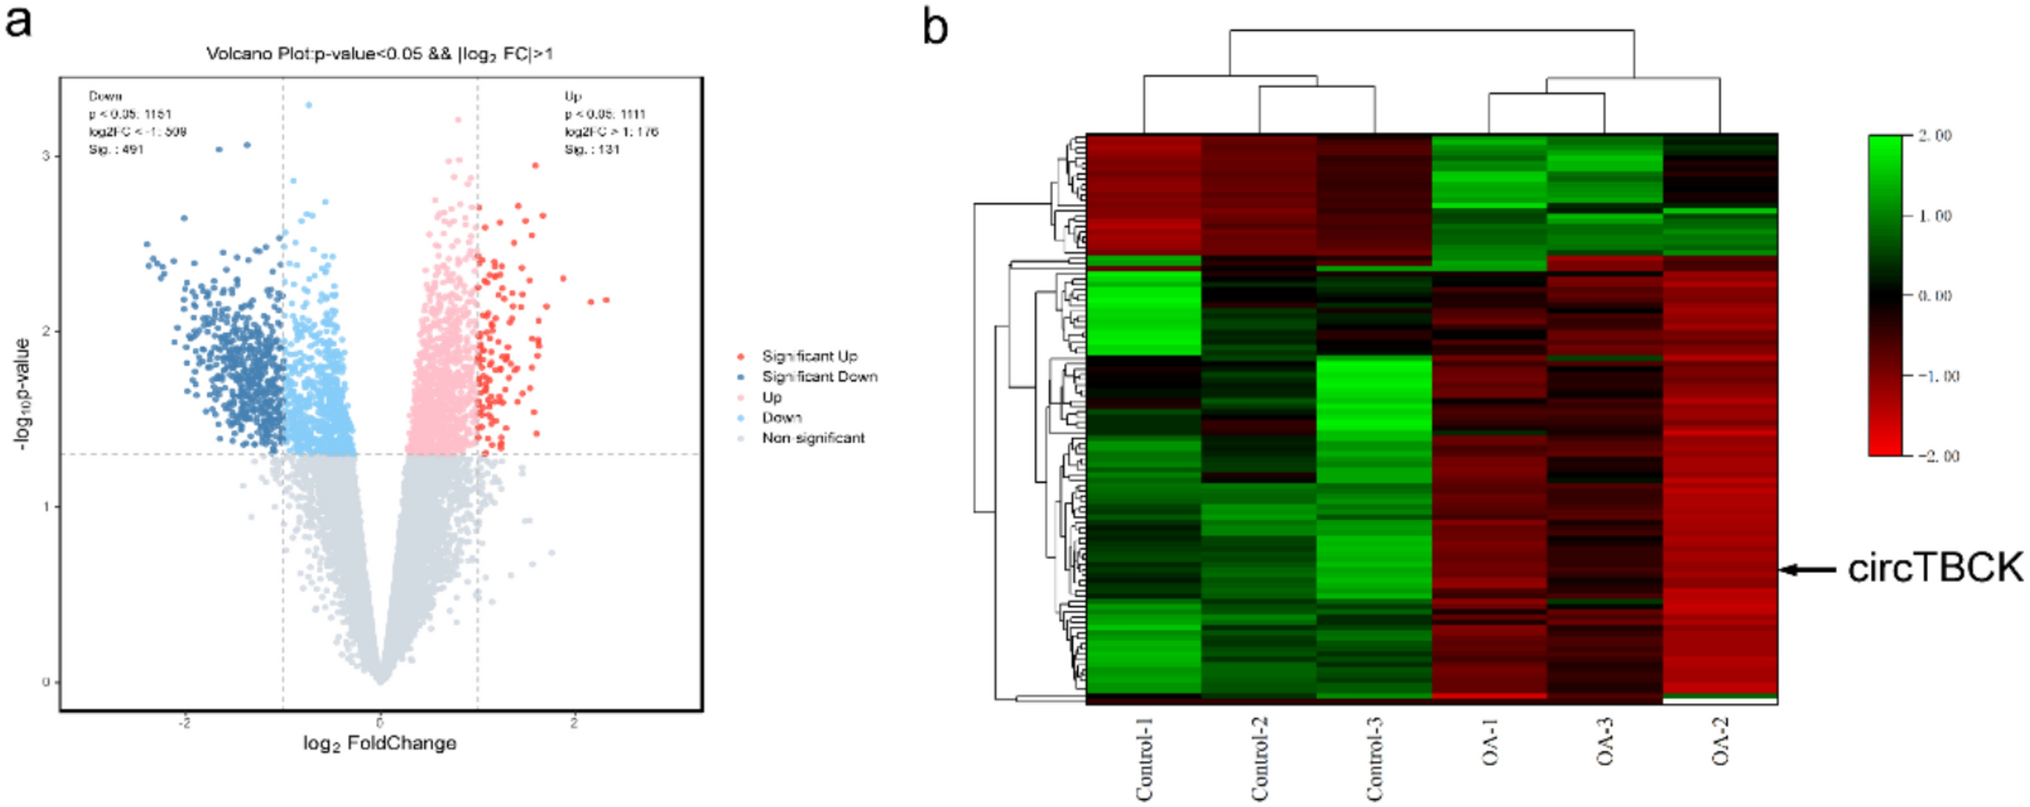
Using “osteoarthritis” and “circRNA” as keywords in the Gene Expression Omnibus (GEO) database, the dataset GSE178724 containing information on OA and control cartilage was retrieved. Differentially expressed circRNAs (DEGs) were screened via GEO2R (http://www.ncbi.nlm.nih.gov/geo/geo2r/) analysis with the following criteria: p value < 0.05 and |log2-fold change (FC)|> 1. Two subgroups of DEGs were identified: downregulated DEGs and upregulated DEGs. Volcano plots and heatmaps created by the Ouyi Cloud Platform (OE Biotech Co., China) were used for visualization.
Chondrocyte extraction, culture, and treatment
Using previously outlined techniques, primary chondrocytes were isolated from the knee articular cartilage of newborn mice that were 5 days old [15]. The articular chondrocytes, isolated from five mice, were collectively cultured in a single flask. These mice were purchased from SPF Biotechnology Co., Ltd. (Beijing, China). In particular, primary chondrocytes were isolated from the knee joints by dissecting the tibial plateaus and femoral condyles. The separated cartilage was subsequently digested with 0.25% trypsin (including 0.02% EDTA) for 1 h and then with 0.2% type II collagenase for 8–16 h. To acquire primary chondrocytes, the digest was filtered through a 70 µm pore size mesh. ATDC5 [16] cells are a widely used cell line for studying cartilage- and bone-related diseases in vitro. These ATDC5 cells used in this study were obtained from GuangZhou Jennio Biotech Co., Ltd. (Guangzhou, China).
Both primary chondrocytes and ATDC5 cells were maintained in DMEM/F12 (GIBCO, USA) supplemented with 10% fetal bovine serum (GIBCO, USA) and 1% penicillin‒streptomycin (GIBCO, USA) and were cultured in an incubator at 37 °C with 5% CO2. Notably, ATDC5 cells were induced with insulin–transferrin–selenium (ITS) (Gibco) for 14 days before further experiments were performed.
To investigate the expression level of circTBCK in OA chondrocytes, IL-1β (10 ng/ml, PeproTech, Thermo Fisher Scientific, USA) was applied for a duration of 24 h. To determine the function of circTBCK in vitro, cells were pre-exposed with either small-interfering RNA (siRNA) targeting circTBCK (si-circTBCK) or lentivirus-overexpressing circTBCK (Lv-circTBCK) before IL-1β treatment. A Lipofectamine 3000 siRNA transfection system (Thermo Fisher Scientific, USA) was used to help siRNAs (GenePharma, China) transfect into the cells. Lv-circTBCK (HanBio, China) was added to the cell culture medium directly.
When investigating autophagic flux, we randomly divided primary chondrocytes into four groups: Lv-NC + IL-1β group, Lv-circTBCK + IL-1β group, Lv-NC + IL-1β + CQ group, and Lv-circTBCK + IL-1β + CQ group. First, cells in each group were transfected with Lv-NC or Lv-circTBCK for 24 h, followed by the addition of IL-1β (10 ng/ml) with or without chloroquine (CQ, 50 μM, MedChemExpress, MCE, China). After 24 h of incubation, we assessed the relevant indicators.
RNA extraction, reverse transcription, and quantitative real-time PCR (qRT-PCR) analysis
TRIzol® reagent (Invitrogen, USA) was used to lyse the samples. After extraction, total RNA was analyzed via a NanoDrop system (Thermo Fisher, USA). Then, cDNA was generated using the FastKing RT Kit (with gDNase) (TIANGEN Biotech, China). SuperReal PreMix Plus (SYBR Green) (TIANGEN Biotech, China) was utilized in qRT-PCR experiments using QuantStudio3 (Thermo Fisher Scientific), and cDNA was extracted from every sample. The results were normalized to those of control samples and standardized to those of housekeeping genes, such as GAPDH, actin beta (ACTB), MALAT1, and U6. Supplementary Table S1 contains the specific primers that were utilized in this investigation (Sangon Biotech, China). To assess gene expression, the 2-ΔΔCt relative fold change was computed.
Western blotting
The total proteins were isolated using RIPA lysis buffer (Beyotime Biotechnology, China) supplemented with phenylmethyl sulfonyl fluoride, protease inhibitor cocktails, and phosphatase inhibitors (Servicebio, China). The protein concentration was determined via a BCA kit (Beyotime Biotechnology, China). Then, equivalent amounts of protein were separated via sodium dodecyl sulfate‒polyacrylamide gel electrophoresis (SDS‒PAGE) and transferred onto PVDF membranes (Millipore, USA). The membranes were blocked with protein-free quick blocking solution (Servicebio, China) for 15 min, and then, primary antibodies were added and incubated for an additional night at 4 °C (Supplementary Table S2). HRP-conjugated secondary antibodies (1:3000, Servicebio, China) were then applied at room temperature for 1 h. After washing, signals were detected using ChemiDoc MP (Bio-Rad Laboratories, USA) and analyzed with Image LabTM (Bio-Rad Laboratories).
Cell proliferation assay
A Cell Counting Kit-8 (CCK-8) was utilized to assess the impact of circTBCK on chondrocyte proliferation. For the CCK-8assay, chondrocytes were transfected with siRNA or lentivirus for 24 h and then seeded into 96-well plates at a density of 2 × 10³ cells per well. The following day, IL-1β was added, and the cells were cultured for 0, 24, 48, or 72 h. Cell proliferation was assessed using CCK-8, and the absorbance at 450 nm was measured via EnSpire (PerkinElmer, USA).
Immunofluorescence analysis
Sterile cell slides were carefully inserted into a 6-well plate, and 3 × 10⁴ chondrocytes were seeded in each well. When the cells reached 60–70%, the chondrocyte slides were fixed at room temperature with 4% paraformaldehyde fixative, permeabilized with 0.5% Triton X-100, and blocked with 5% bovine serum albumin (BSA) buffer. They were subsequently incubated in a wet box at 4 °C overnight with primary antibodies against type II collagen (Collagen II) (dilution 1:100; Abcam, UK). The secondary antibodies (BEIJING ZHONGSHAN GOLDEN BRIDGE BIOTECHNOLOGY CO., LTD., China) were conjugated to the primary antibodies for one hour at RT in the dark. After that, DAPI staining and anti-fluorescence quenching tablets were used to seal the slides. A Laser Confocal microscope (Nikon, Japan) was used to take digital fluorescence images at × 20 magnification. Image software (Media Cybernetics, USA) was used to evaluate the measurements.
Nuclear-cytoplasmic fractionation
According to the manufacturer's instructions, PARIS Kit (Invitrogen, USA) was used to isolate cytoplasmic RNA and nuclear RNA. To put it briefly, chondrocytes were lysed with cell fractionation buffer, and then, a centrifuge was used to separate the two cell components. After the supernatant was transferred to fresh RNase-free tubes, the remaining lysate was washed with cell fractionation buffer. Cell disruption buffer was used to divide the nuclei. The above lysate and the supernatant were mixed with a 2X lysis binding solution, and an equal volume of ethanol was added through a filter cartridge. The solution was then used to wash the samples. After being eluted, the cytoplasmic and nuclear RNA were reverse transcribed into cDNA and analyzed by qRT-PCR.
RNase R treatment
To detect the stability of mRNAs and circRNAs, RNase R detection was performed. Total RNA (5 µg) was treated with or without 3 U/µg RNase R (Beyotime Biotechnology, China) at 37 °C for 20 min, followed by inactivation at 70 °C for 10 min. QRT‒PCR was then used.
RNA fluorescence in situ hybridization
CY3-labeled circTBCK probes were designed and synthesized by Servicebio (Wuhan, China). The cell nuclei were labeled with 4’,6-diamidino-2-phenylindole (DAPI) (Servicebio, China). The probe signals were determined via a FISH Kit (Servicebio, China) according to the manufacturer’s guidelines. Images were obtained via a laser confocal microscope (Nikon, Japan).
Animal experiments
All animal experiments were approved by the Ethical Committee of Animal Experiments and Experiments Animal Welfare Capital Medical University and were performed in accordance with the committee’s guidelines. Eight-week-old male C57BL/6 J mice (n = 8; mean body weight = 25 g) were purchased from SPF Biotechnology Co., Ltd. (Beijing, China) and randomly divided into two groups: the posttraumatic OA model group (n = 4) and the control group (n = 4).
The allocation of mice was concealed using a computer-generated randomization system by an independent assistant who remained uninvolved in the experimental procedures. This assistant assigned each mouse a random code, ensuring their random allocation into either the model or control group. The experimenters were kept blinded to these group assignments throughout the study, only being informed of the specific surgical procedures at the time of surgery. After the surgeries were completed, the blinding continued up to the data analysis phase.
Destabilization of the medial meniscus (DMM) surgery was done on the mice in the positive control group to establish a posttraumatic OA model, as previously described [17]. In short, following anesthesia, the right knee joints of the mice were exposed via a medial capsular incision. The ligaments linked to the tibial plateau were then released by severing the medial meniscotibial ligament (MMLT) with microsurgical scissors, which destabilized the medial meniscus. Ultimately, the skin was closed, and the wound was stitched. In parallel, control animals underwent a fake procedure that involved just incising the medial knee joint capsule.
The mice were randomly assigned to separate cages within the animal facility to prevent potential bias. All animals were housed under standard conditions, with continuous access to food and water ad libitum. Throughout the experiment, researchers remained blinded to the treatment groups.
The mice were euthanized 8 weeks after surgery, and their knee cartilage was removed and subjected to imaging and biochemical analysis. Researchers remained blinded to the group allocations during the assessment process. To guarantee an unbiased evaluation, animals were selected for outcome assessment using a random number table, which was generated by a computer system.
Microcomputed tomography (micro-CT) scanning
Micro-CT scanning was done using a micro-CT scanner (Skyscan 1276, Bruker, Germany). Micro-CT analysis software (CTvox, SkyScan) was used to run the three-dimensional reconstruction and image viewing of the knee joint.
Statistical analyses
At least three separate biological replicates or three repeated measurements were used to gather all of the data. The experimental data are presented as the means ± standard deviations. The distribution of the data was tested with the Shapiro‒Wilk test, and the equality of variances was tested using Levene’s test. The statistical significance of differences between two groups was determined via Student’s t test. Multiple group comparisons were determined by one-way ANOVA followed by the Bonferroni correction unless otherwise indicated. Variations were deemed statistically significant when P values (two-sided) were less than 0.05. SPSS 25 (SPSS, Inc., Chicago, IL, USA) and GraphPad Prism 8 (GraphPad Software, San Diego, CA, USA) were used to analyze the data.


Comments (0)