Ethical issues
All animal procedures were approved by the Institute of Animal Care and Use Committee at Kaohsiung Chang Gung Memorial Hospital (Affidavit of Approval of Animal Use Protocol No. 2021120204) and were performed in accordance with the Guide for the Care and Use of Laboratory Animals.
Animals were housed in an Association for Assessment and Accreditation of Laboratory Animal Care International (AAALAC; Frederick, MD, USA)-approved animal facility in our hospital with controlled temperature and light cycles (24 °C and 12-h/12-h light cycle).
Preparation of CoCl2 stock solution and hypoxia treatment
The procedure and protocol were based on a previous report (Yin et al. 2023) with minimal modifications. A stock solution 25 mM of cobalt chloride (CoCl2) was prepared in sterile distilled water and diluted in medium to obtain the final concentrations. The N2a cell line was cultured in Dulbecco’s modified Eagle’s medium (DMEM)supplemented with 10% fetal bovine serum (FBS), 100 U/mL penicillin, and 100 µg/mL streptomycin in a standard CO2 incubator. After 24 h, the N2a cells were treated with CoCl2 (i.e., 100 µM) co-culture for 24 h.
Mitochondrial isolation from donors and MitoTracker staining for mitochondria
Liver mitochondria were isolated from donor Sprague–Dawley rats, as previously described (Rana et al. 2019). The rats were fasted overnight prior to the mitochondrial isolation procedure and euthanized, and their gallbladders and livers were carefully isolated and removed. Briefly, the liver (3–5 g) was immersed in 100 mL ice-cold IBc (10 mM Tris–MOPS, 5 mM EGTA/Tris, and 200 mM sucrose, pH 7.4) in a beaker, followed by rinsing to remove the blood with ice-cold IBc. The liver was minced using scissors in a beaker containing ice. IBc was discarded during mincing and replaced with 18 mL of ice-cold fresh IBc. The livers were homogenized using a Teflon pestle. The homogenates were transferred to a 50-mL polypropylene Falcon tube and centrifuged at 600 × g for 10 min at 4 °C. The supernatants were transferred to fresh tubes for centrifugation at 7,000 × g for 10 min at 4 °C. The supernatants were discarded, and the pellets were washed with 5 mL of ice-cold IBc. The supernatants from the pellets were centrifuged at 7,000 × g for 10 min at 4 °C. The supernatants were discarded and the pellets containing mitochondria were resuspended. The concentration of the mitochondrial suspension was measured using the biuret method. Isolated mitochondria (10 mg) were labeled with 1 M MitoTracker Red CMXRos (Invitrogen, Carlsbad, CA, USA) and incubated at 37 °C for 30 min. Finally, exogenous mitochondria (ExMito) were co-cultured with healthy and hypoxic N2a cells, and mitochondrial transfusion into the study animals was performed immediately after labeling (< 3 h after the isolation procedure).
Preparation of N2a cell line
Neuro-2a cells (N2a: neuroblastoma cell line) were maintained in minimum essential medium supplemented with 10% fetal bovine serum, 2 mM L-glutamine, 0.1 mM non-essential amino acids, 1.0 mM sodium pyruvate, 100 U/mL penicillin G, and 100 μg/mL streptomycin. To create mitochondrial-DNA depleted cells (i.e., ρ0 cells) of N2a, the N2a cells were incubated with ethidium bromide (0.5 μg/mL) for 2 weeks to influence mitochondrial DNA replication. Throughout the experimental period, ρ0 and N2a cells were grown in minimum essential medium supplemented with 50 µg/mL uridine.
Measurement of mitochondrial OCR
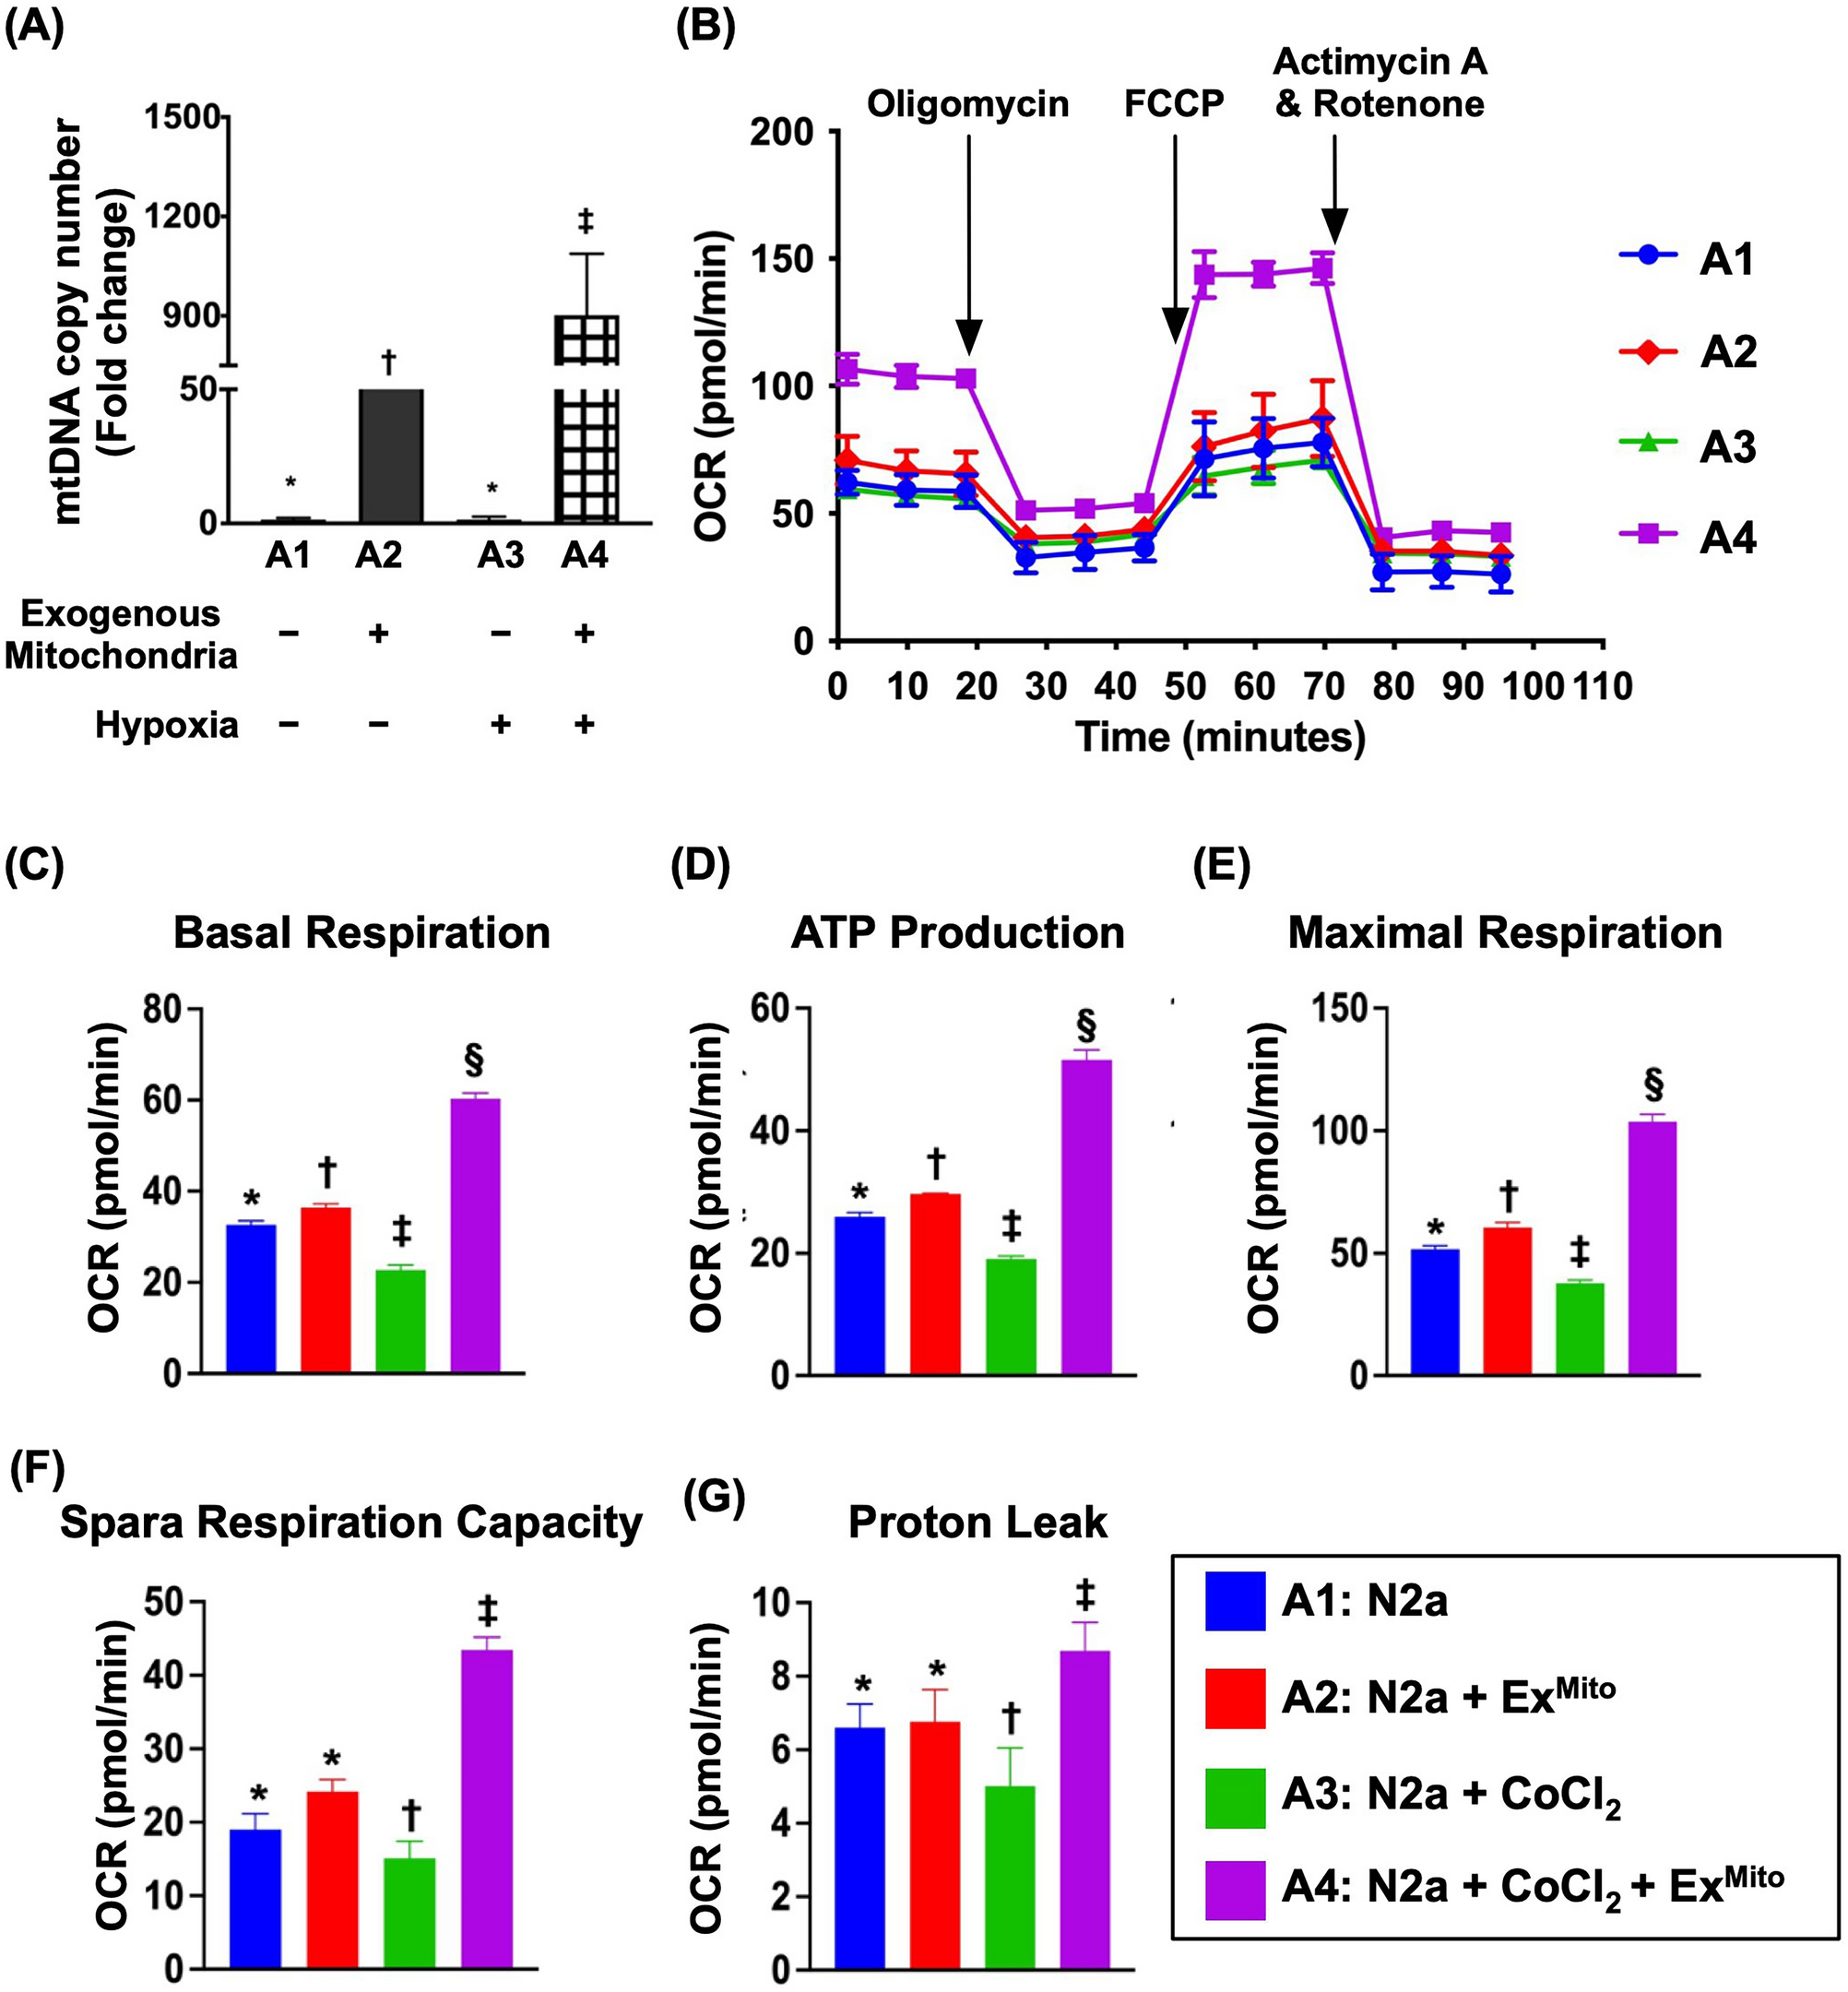
Mitochondrial bioenergetics in N2a cells under different conditions were determined using an Extracellular Flux Analyzer (XFe24 Seahorse Bioscience, North Billerica, MA, USA) by assessing mitochondrial oxygen consumption, basal respiration, maximal respiration, ATP production, and spare respiratory capacity. Briefly, N2a cells (104 cells/per well) were seeded into FBS-free and sodium bicarbonate-free DMEM (high-glucose). During the reactions, 100 µM oligomycin, 100 µM FCCP and 540 µL antimycin A/rotenone were added sequentially. The OCR was measured sequentially (Fig. 1).
Preparation of allogenous adipose tissue for culturing ADMSCs
To prepare autologous ADMSCs, the adipose tissue was isolated from 12 rats. The procedure and protocol for ADMSCs preparation are described in our previous reports (Weissmann 2004; Chen et al. 2014b, 2016a; Lin et al. 2016). Briefly, adipose tissue surrounding the epididymis was carefully dissected, excised, and processed. Following standardized preparation steps (Weissmann 2004; Chen et al. 2014b, 2016a; Lin et al. 2016), the cells were resuspended in saline. An aliquot of this cell suspension was cultured in low-glucose (DMEM)-with 10% FBS for 14 days. Approximately 2–3 × 10⁶ ADMSCs were obtained per rat.
Transfection of ADMSCs with plasmids for PrPC overexpression (Ove-PrP.C)
The procedure and protocol were reported in our recent study (Yip et al. 2021b). The pCS6-PRNP plasmid was purchased from Transomics Technologies (Huntsville, Alabama, USA). Briefly, plasmid transfection was performed using Lipofectamine 3000 (Invitrogen, Life technologies, Carlsbad, CA, USA) according to the manufacturer’s instructions with slight modifications. The cells were replated 24 h before transfection at a density of 5 × 10⁵ cells in 4 mL of fresh culture medium in a 6-cm plastic dish. Briefly, 10 μg of the PRNP expression vector and 20 μL Lipofectamine 3000 were incubated at room temperature for 15 min, followed by overnight incubation of cells at 37 °C in a humidified atmosphere of 5% CO2 and Lipofectamine (i.e., mixed together), after which the relevant experiments were carried out.
Cell grouping and verification of cell-to-cell-transferred mitochondria by TNT system
To test whether ADMSCs (i.e., donor) could transfer their mitochondria into hypoxia-treated neuronal cells (i.e., recipient), i.e., “cell-to-cell transfer,” we utilized a cell-culture model, and the cells were categorized as follows: A1 (N2a cells), A2 [N2a cells + exogenous mitochondria (100 μg co-cultured for 3 h)], A3 [N2a cells + CoCl2 (100 μM co-culture for 24 h)], A4 (N2a + CoCl2 + exogenous mitochondria), A5 (ρ0 cells) and A6 (ρ0 cells + ADMSCs). The dose of exogenous mitochondria and procedure and protocol of this experimental study were based on our recent report (Yip et al. 2020).
Additionally, to determine whether ADMSCs (i.e., donor) could transfer their mitochondria into mitochondria-deprived neuronal cells (i.e., recipient), the cells were categorized as follows: B1 (ρ0 cells) and B2 [(ρ0 cells) + ADMSCs], respectively.
Furthermore, to investigate whether Ove-PrPC in ADMSCs upregulates cell proliferation, suppresses oxidative stress, and upregulates cell stress signaling, we used a cell culture model. The cells were categorized as follows: C1 (ADMSCs only), C2 (Ove-PrPC in ADMSCs), C3 [ADMSCs + H2O2 (200 μM) treated for 6 h, followed by culture for 18 h], and C4 [Ove-PrPC in ADMSCs + H2O2 (200 μM)] treated for 6 h, followed by culture for 18 h]. After culture, the cells were collected for individual studies.
Furthermore, to confirm that the ADMSCs-derived mitochondria (i.e., donor cells) could be transferred into ρ0 cells (mitochondrial-DNA depleted cells) (i.e., recipient cells] through the TNT system, the mitochondria of ADMSCs was first stained by Mitotracker (red color), followed by co-cultured with ρ0 cells. Finally, the cells were collected and under the IF microscopic examination, the TNT system transferred positively MitoTracker-stained mitochondria from ADMSCs (donor) to ρ0 cells (recipient) was clearly identified (referred from Fig. 3).
MTT cell viability assay
The growth of N2a cells was evaluated using the MTT assay. Approximately 2 × 10³ cells in 100 μL of medium (stock in 100% ethanol at 100 mM, working concentration of 1 mM) were seeded into the wells of a 96-well plate and incubated for 6 h. The medium was changed, followed by incubation for an additional 24, 48, and 72 h. For the MTT assay, 2000 cells per well were seeded into 96-well plates in 100 μL of medium with or without 50 µM H2O2 for 24 h (i.e., oxidative stress tests). At the time of detection, the medium was removed, and 200 μL MTT reagent was added to the cells for 30 min. After incubation, the purple crystal sediment was dissolved in dimethyl sulfoxide and the absorbance was read at 540 nm using an ELISA reader. Absorbance was used to determine the cell number.
Flow cytometric analysis to determine the fluorescent intensity of reactive oxygen species (ROS)
To assess total intracellular and mitochondrial ROS, the cells were incubated in serum-free medium containing 10 μM H2DCFDA, 5 μM MitoSOX, and 50 nM NAO in a 37 °C incubator for 20 min after rinsing the cells twice with phosphate-buffered saline (PBS). After rinsing twice with PBS to remove residual H2DCFDA, the cells were incubated in serum-containing culture medium for an additional 30 min. Following trypsinization, the cells were suspended in PBS and analyzed using flow cytometry in the FL1 channel.
Induction of ICH by type IV collagenase proteolytic enzyme in rodent
The procedure and protocol of ICH were based on a recent report (Rana et al. 2019). The rats were anesthetized by inhalation of 2.0% isoflurane and placed on a warming pad at 37 °C, followed by securing the head and shaving the scalp hair. Under sterile conditions, a 1-cm long midline incision of the scalp was created to expose the perpendicular intersection point of the coronal and sagittal sutures (i.e., bregma). A Hamilton syringe (250 μL) was mounted onto the injection pump to stereotaxically guide the needle (26 gauge) over the bregma. The arms of the stereotactic manipulator were adjusted to move the needle 1.4 mm anterior and 3.2 mm lateral to the right. A small cranial burr hole was created using a 1 mm drill bit. Collagenase type IV (1.0 μL, 0.25 IU/μL) was injected into corpus/dorsal striatum (5 mm below the skull) through the 26 gauge Hamilton syringe at a rate of 0.2 μL/min. The syringe was slowly removed after injection, and sterile bone wax was used to quickly plug the hole. The skin on the head surface was closed using 4‐0 prolene suture. Finally, the animals were recovered in a portable animal intensive care unit (ThermoCare®, Braintree Scientific, Pembroke, MA, USA) with food and water for 24 h.
Animal grouping and study period
Pathogen-free, adult male (i.e., 10–12 weeks old) SD rats (n = 50), weighing 325–350 g (Charles River Technology, BioLASCO, Taipei, Taiwan), were randomly categorized into group 1 [sham-operated control (SC)], group 2 (ICH + 20 μL culture medium), group 3 [ICH + ExMito (350 μg) by intracranial injection at 3 h after ICH], group 4 [ICH + Ove-PrPC-ADMSCs (6.0 × 10⁵) cells by intracranial injection and 1.2 × 10⁶ cells by intravenous injection, respectively], and group 5 [ICH + combined ExMito (i.e., by intracranial administration) + Ove-PrPC-ADMSCs]. The doses of mitochondrial ADMSCs were based on a previous report (Rana et al. 2019). Additionally, all animals were euthanized on day 28 after brain MRI. The brains were harvested from each group of animals for individual studies.
Procedure and protocol of brain MRI
The procedure and protocol for brain MRI studies were based on our previous report (Chen et al. 2014b). Brain MRI was performed 28 days after TBH induction. During MRI measurements, rats were anesthetized by 2.0% inhalational isoflurane with room air and placed in an MRI-compatible holder (Biospec 94/20, Bruker, Ettingen, Germany). The rectal temperature and respiration were monitored throughout the procedure to ensure that normal physiological conditions were maintained. MRI data were collected using a Varian 9.4 T animal scanner (Biospec 94/20, Bruker, Ettingen, Germany) with a rat surface array. The MRI protocol comprised 40 T2-weighted images. Forty continuous slice locations were imaged with a field of view of 30 × 30 mm, acquisition matrix dimensions of 256 × 256 mm, and slice thickness of 0.5 mm. The repetition time and echo time for each fast spin-echo volume were 4200 and 30 ms, respectively. ImageJ software (1.43i, NIH, Bethesda, MD, USA) was used to process data from the regions of interest. Planimetric measurements of T2 were performed to calculate the hemorrhagic volumes of the cortex. Collectively, the BHV was calculated by summing the total coronal sections and then dividing by the number of coronal sections to obtain the means of the IAs. Additionally, the height of the infarct zone was calculated by summing the thicknesses of each coronal section. Finally, the BHV was calculated as the mean IA × height.
Corner test for assessment of sensorimotor function
The sensorimotor function test (corner test) was conducted for each rat at baseline and on days 3, 7, 14, and 28 after acute ICH induction, as previously reported (Yip et al. 2020; Chen et al. 2014b; Rana et al. 2019). Briefly, rats in each group were allowed to walk through a tunnel and then into a 60° corner. The rats could turn either left or right to exit a corner. A technician blinded to the study design recorded the results. This test was repeated 10–15 times, with at least 30 s between each test. The technician recorded the number of right and left turns in 10 successful trials for each animal, and the results were statistically analyzed.
Identification of brain IA by TTC at day 14 after acute ICH procedure
The procedure and protocol were described in our previous report (Chen et al. 2014b). Briefly, brain axial sections of the rats were obtained from six animals in groups 2 and 3 (n = 6–7 for each group) as 2 mm slices. Each cross-section of the brain tissue was stained with 2% TTC (Alfa Aesar, Ward Hill, MA, USA) to analyze the brain IA. All brain sections were placed on a tray with a scaled vertical bar attached to a digital camera. Sections were photographed directly above from a fixed height. Images were analyzed using Image Tool 3 (IT3) image analysis software (UTHSCSA; Image Tool for Windows, Version 3.0; University of Texas, Health Science Center, San Antonio USA). The IA was observed as either whitish or pale yellowish. The infarcted region was confirmed by microscopic examination. The percentage of IA was obtained by dividing the IA by the total cross-sectional area of the brain.
IF staining
The procedure and protocol for IF staining was described in our previous reports (Yip et al. 2020; Chen et al. 2014b; Rana et al. 2019). Rehydrated paraffin sections were first treated with 3% H2O2 for 30 min and then incubated with the ImmunoBlock reagent (BioSB, Santa Barbara, CA, USA) for 30 min at room temperature. Sections were incubated with primary antibodies against CD68 (ab31630, 1:500, Abcam, Cambridge, UK), NeuN (MAB377, 1:100, Sigma, St. Louis, MO, USA), and r-H2AX (1:1000, Abcam). Sections incubated with irrelevant antibodies served as controls. Three brain tissue sections from each rat were analyzed. For quantification, three random high-power fields (400 × for IF studies) were analyzed in each section. The mean number of positively stained cells per high-power field for each animal was determined by summing all numbers divided by 9.
Western blot analysis
Western blot analysis was performed as described previously (Yip et al. 2020; Chen et al. 2014b; Rana et al. 2019). Briefly, equal amounts (50 μg) of protein extract were loaded and separated by sodium dodecyl sulfate–polyacrylamide gel electrophoresis using acrylamide gradients. After electrophoresis, the separated proteins were transferred onto polyvinylidene difluoride membranes (GE Healthcare, Little Chalfont, UK). Nonspecific sites were blocked by incubating the membrane in blocking buffer [5% nonfat dry milk in Tris-buffered saline containing 0.05% Tween 20)] overnight. The membranes were incubated with primary antibodies [Cyclin D1 (1:1000, Abcam), CyclinE1 (1:1000, Abcam), CDK2 (1:1000, Abcam), CDK4 (1:1000, Abcam), NOX1 (1:1000, Sigma), NOX4 (1:1000, Abcam), cytochrome C (1:10,000, BD Biosciences, Franklin Lakes, NJ, USA), p-DRP1 (1:1000, Cell Signaling Technology, Danvers, MA, USA), cyclophilin D (1:10,000, Abcam), PINK (1:10,000, Abcam), Beclin1 (1:1000, Cell Signaling Technology), Bax (1:1000, Abcam), cleaved caspase 3 (1:1000, Cell Signaling Technology), cleaved PARP (1:1000, Cell Signaling Technology), phosphorylated (p)-PI3K (1:1000, Cell Signaling Technology), PI3K (1:1000, Cell Signaling Technology), p-AKT (1:1000, Cell Signaling Technology), AKT (1:1000, Cell Signaling Technology), p-mTOR (1:1000, Abcam), mTOR (1:1000, Abcam), γ-H2AX (1:1000, Cell Signaling Technology), transforming growth factor beta (TGF-β) (1:1000, Abcam), p-Smad3 (1:1000, Cell Signaling Technology), COX-IV (1:10,000, Abcam), and actin (1:1000, Millipore, Billerica, MA, USA)] for 1 h at room temperature. Horseradish peroxidase-conjugated anti-rabbit immunoglobulin IgG (1:2000; Cell Signaling, Danvers, MA, USA) was used as the secondary antibody for 1-h incubation at room temperature. Washing was repeated eight times within 1 h. Immunoreactive bands were visualized using enhanced chemiluminescence (ECL; Amersham Biosciences, Amersham, UK) and exposed to Biomax L film (Kodak, Rochester, NY, USA). For quantification, ECL signals were digitized using Labwork software (UVP, Waltham, MA, USA).
Statistical analysis
Quantitative data are expressed as the mean ± standard deviation. Statistical analysis was performed using analysis of variance, followed by Bonferroni multiple-comparison post-hoc tests. SAS statistical software for Windows version 8.2 (SAS Institute, Cary, NC, USA) was used. Statistical significance was set at P < 0.05.


Comments (0)