
Remember me


We developed an “all-in-one” Tet-On system, a gene circuit containing all Tet-On control mechanisms on a single plasmid, suitable for straightforward knock-in at target genomic regions (Fig. 1A). Downstream of the human EF1α promoter, we placed the rtTA gene, which controls gene transcription by binding to the TRE3G promoter, along with a blasticidin resistance (BSR) gene for selection and the mScarlet (mScar) reporter gene. The TRE3G promoter is positioned in the opposite orientation to the EF1α promoter, enabling the insertion of a target gene downstream of the TRE3G promoter for regulated expression of a gene of interest. The TRE3G promoter allows for target gene expression in the presence of both rtTA and doxycycline.
Fig. 1
Design and integration of the “all-in-one” Tet-On system plasmid for targeted gene knock-in. A. Schematic representation of the all-in-one Tet-On plasmid. The human EF1α promoter drives the expression of the reverse tetracycline transactivator (rtTA), along with the blasticidin resistance (BSR) gene and mScarlet (mScar) reporter gene. The TRE3G promoter is oriented in the opposite direction to control the expression of the target gene (Gene). Two sets of adjacent BsaI restriction sites (2x BsaI) flank the regulatory elements. B. Generation of homology arms (HAs) through PCR amplification. The 5’ and 3’ homology arms, each approximately 450 bp, are designed to match the target genomic site for precise knock-in through homologous recombination. C. One-pot Golden Gate Cloning is used to insert the homology arms into the all-in-one plasmid. The BsaI restriction enzyme is used to ligate the homology arms with the Tet-On gene circuit. D. The plasmid (All-in-one Tet-On with HAs plasmid) is linearized using KpnI and NheI restriction enzymes to prepare it for integration into the genome. The final construct includes the homology arms and the regulatory elements of Tet-On system. E. Schematic of the targeted circuit integration. The linearized plasmid and a Cas9-gRNA vector are co-electroporated into mammalian cells. Cas9 creates a double-stranded break at the target site, and the homology arms direct homologous recombination (HDR), enabling precise knock-in of the genetic circuit into the desired genomic location. F. Final structure of the genomic integration, with the All-in-one Tet-On gene circuit at the target site
To facilitate precise genomic integration, we incorporated two pairs of adjacent BsaI restriction sites flanking the regulatory elements on the plasmid to allow for scarless Golden Gate cloning (Fig. 1A). One first identifies the intended cleavage site in the target region using CRISPR/Cas9 and then designs homology arms (HA) ~ 450 bp for the 5’ and 3’ regions, which can be amplified by PCR (Fig. 1B). These amplified HAs are then inserted to flank the all-in-one Tet-On plasmid via one-pot Golden Gate cloning (Fig. 1C). The plasmid, linearized using KpnI and NheI, is then co-electroporated with a Cas9-gRNA-expressing plasmid into mammalian cells to induce homology-directed repair (HDR) into the desired genomic region (Fig. 1D-F). This all-in-one plasmid allows for controlling the expression of target genes in potentially any genomic region using doxycycline.
0.9 UCOE enhances long-term gene expression in gene-edited iPS cellsTo minimize gene silencing and promote stable long-term expression of rtTA and the selectable markers, we placed a 0.9 kb A2UCOE upstream of the constitutive human EF1α promoter (Fig. 2A, Supplemental Table 4). The A2UCOE is located on human chromosome 7, between the HNRNAPA2B1 and CBX3 genes, and has a large CpG island [19, 20]. We analyzed ATAC-seq data of this region in PGP1 iPSCs from the ENCODE consortium [35], and observed peaks corresponding to the CpG island, suggesting high transcriptional activity in the same region within PGP1 cells (Fig. 2A). To enable the generation of thymic epithelial cells (TECs), we then introduced a codon-optimized human FOXN1 cDNA sequence into the construct (Fig. 2B) [32, 37]. TECs are critical players in both positive and negative selection of precursor T-cells during central tolerance and adaptive immunity [38]. This genetic circuit was integrated into a safe harbor region on chromosome 1 (Rogi1) of PGP1 human iPSCs using CRISPR/Cas9-assisted HDR [39, 40], along with a control genetic circuit lacking UCOE (w/o UCOE). After a 2-day rest period following genetic editing, cell integrants were selected for with 3 µg/mL blasticidin for 5 days. Successful integration of the genetic circuits was confirmed by PCR amplification of the newly generated 5’ and 3’ integration junctions at the Rogi1 target region (Supplemental Fig. 3). Total iPSC colonies were pooled to generate a bulk population.
Fig. 2
The 0.9 UCOE enhances long-term gene expression stability in gene-edited iPS cells. A. Location and design of the 0.9 UCOE fragment within the A2UCOE region on human chromosome 7. ATAC-seq data from PGP1 iPSCs show transcriptionally active regions overlapping with a CpG island between the HNRNAPA2B1 and CBX3 genes, suggesting open chromatin in this area. The 0.9 UCOE, isolated from this region, spans 863 bp, including exon 1 of CBX3 and part of the HNRNAPA2B1 promoter. B. Schematic of the all-in-one Tet-On plasmid design with and without the 0.9 UCOE. The 0.9 UCOE was placed upstream of the EF1α promoter to drive stable expression of rtTA and selection markers. C. Experimental workflow for generating and analyzing bulk iPSC populations after gene editing. PGP1 iPSCs were edited using CRISPR/Cas9, followed by 5 days of blasticidin selection. Flow cytometry analysis was performed periodically over the 30-day culture period to monitor the percentage of RFP-positive (mScarlet+) cells. D. Fluorescence microscopy images of the 0.9 UCOE and w/o UCOE bulk populations on Days 0 and 30. E. Quantification of RFP-positive cells by flow cytometry in the 0.9 UCOE and w/o UCOE bulk populations over time (n = 3). F. Reverse Transcriptase Quantitative PCR (RT-qPCR) analysis of transcription levels for rtTA and mScarlet in bulk populations on Day 0 (n = 3). G. RT-qPCR analysis of rtTA and mScarlet transcription levels in bulk populations on Day 30 after 30 days of culture without blasticidin (n = 4). H. RT-qPCR analysis of induced FOXN1 transcription in response to doxycycline on Day 30 after 30 days of culture without blasticidin (n = 4). P-values were calculated using a two-tailed unpaired t-test and one-way analysis of variance with Tukey’s honestly significant difference test. Data are presented as mean ± SEM. For detailed data, statistical analyses, and exact p-values, see source data file
We then evaluated the stability of gene expression in the bulk-gene edited population of cells (Fig. 2C), which we note will contain both targeted and untargeted integrants. Starting from the day blasticidin selection was completed (Day 0), the bulk cells were cultured for 30 days in medium without blasticidin to permit silencing, and the stability of gene expression downstream of UCOE was evaluated by quantifying the number of RFP-positive (mScarlet+) cells via flow cytometry (Fig. 2C). According to fluorescence microscopy, most colonies and cells were RFP-positive on Day 0, but by Day 30 visibly showed a reduction in RFP due to silencing (Fig. 2D). Flow cytometry analysis revealed no significant difference in the percentage of RFP-positive cells (46.4% vs. 41.5%) in the starting Day 0 cells (Fig. 2E). The low fraction of RFP-positive cells in the initial population is likely due to clump passaging of human iPSCs, which may protect some cells from antibiotic selection. Nevertheless, by Day 30, the percentage of RFP-positive cells was significantly higher in the 0.9 UCOE population (32.0%) compared to the w/o UCOE population (14.0%) (Fig. 2E).
Additionally, we evaluated the transcription levels of the introduced genes, rtTA and mScarlet. On Day 0, both rtTA and mScarlet gene transcription levels were approximately 800-fold and 2000-fold higher, respectively, in both the 0.9 UCOE bulk and w/o UCOE bulk groups compared to unmodified parental PGP1 cells. However, there was no significant difference in transcription levels between the 0.9 UCOE and w/o UCOE bulk groups on Day 0 (Fig. 2F). In contrast, on Day 30, while the expression levels of rtTA and mScarlet decreased compared to Day 0 in the 0.9 UCOE group, they remained approximately 400-fold and 1500-fold higher, respectively. In the w/o UCOE group, a substantial decline in expression levels was observed, making them far less usable (Fig. 2G).
More importantly, the bulk UCOE cells after 30 days still responded to doxycycline administration showing significantly enhanced expression of the target gene, FOXN1, whereas by comparison the w/o UCOE group on Day 30 had no response and expression (Fig. 2H). These results suggest that the A2UCOE promotes long-term stable gene expression in gene-edited iPS cells and helps ensure that cells continue to respond to doxycycline for inducing target genes in the Tet-On system in the absence of selection.
Establishment of pre-induced thymic epithelial cell line and differentiation into induced thymic epithelial cells (iTEC)Next, we sought to isolate single-cell-derived clones with the FOXN1 gene circuit containing the UCOE, for stably making induced thymic epithelial cells (iTEC), using the above protocol (Fig. 3A). A total of 24 colonies were picked, and PCR confirmed the correct insertion of the genetic circuit in 9 of these cell lines indicating a 37% integration efficiency (Supplemental Fig. 4). From these, we selected one cell line and established it as our pre-induced thymic epithelial cell line 1 (pre-iTEC1). This cell line exhibited a dense and flat colony morphology indicative of the primed pluripotent state similar to the parental PGP1 cells and strongly expressed mScarlet fluorescent protein (Fig. 3B). Reverse Transcriptase quantitative PCR (RT-qPCR) revealed significant expression of rtTA, BSR, and mScarlet compared to PGP1 cells (Fig. 3C). Additionally, the expression of the pluripotency markers OCT4, NANOG, and DNMT3B were comparable to that in PGP1 cells, indicating that the undifferentiated state was maintained (Fig. 3D).
Fig. 3
Establishment of pre-induced thymic epithelial cell (pre-iTEC) line and induction of differentiation into thymic epithelial cells (iTEC). A. Experimental scheme: Genetic circuits were introduced into iPSCs to create pre-induced thymic epithelial cells (pre-iTEC). Induction into induced thymic epithelial cells (iTEC) was achieved by administering 1 µg/mL doxycycline for 7 days. B. Representative images of the created pre-iTEC1 and PGP1 cells. The RFP signal indicates the expression of the mScarlet gene. C. RT-qPCR comparison of the introduced genes rtTA, BSR, and mScarlet between groups (n = 3). D. RT-qPCR comparison of undifferentiated marker genes OCT4, NANOG, and DNMT3B in PGP1 cells and pre-iTEC1 (n = 3). E. RT-qPCR comparison of FOXN1 gene expression in pre-iTEC1 and pre-iTEC1 treated with doxycycline groups (n = 3). F. Morphological changes in pre-iTEC1 upon doxycycline administration. G. RT-qPCR comparison of undifferentiated markers in pre-iTEC1 with and without doxycycline treatment (n = 3). H. Comparison of TEC markers DLL4 and ENPEP (Ly51) in pre-iTEC1 upon doxycycline treatment (n = 3). I. Representative image of immunofluorescence staining for DLL4 in pre-iTEC1 treated with doxycycline. P-values were calculated using a two-tailed unpaired t-test. The data are presented as mean ± SEM. For detailed data, statistical analyses, and exact p-values, see source data file
Next, we evaluated the forward programming potential of pre-iTEC1 iPSCs into iTECs. Upon treatment with doxycycline (1 µg/mL, 24 h), FOXN1 expression was significantly induced in the doxycycline-treated group, as confirmed by RT-qPCR (Fig. 3E). Moreover, when 1 µg/mL of doxycycline was administered for 7 days in B8-iPSC media, which enforces the pluripotent state, the morphology of the cells changed from the dense colony-like appearance characteristic of iPSCs to a looser and elongated form (Fig. 3F, Supplemental Fig. 5), indicating that pre-iTEC cells underwent morphological changes upon doxycycline treatment even in the presence of media meant to maintain pluripotency. The expression of the pluripotency markers OCT4, NANOG, and DNMT3B was significantly decreased in the doxycycline-treated group (Fig. 3G). Furthermore, we observed an increase in expression of the key TEC markers DLL4 and ENPEP (Ly51) in the doxycycline-treated group (Fig. 3H). Immunostaining further revealed strong DLL4 protein expression in the doxycycline-treated group (Fig. 3I). These results demonstrate that pre-iTEC1 iPSCs reprogram into iTECs upon FOXN1 induction alone.
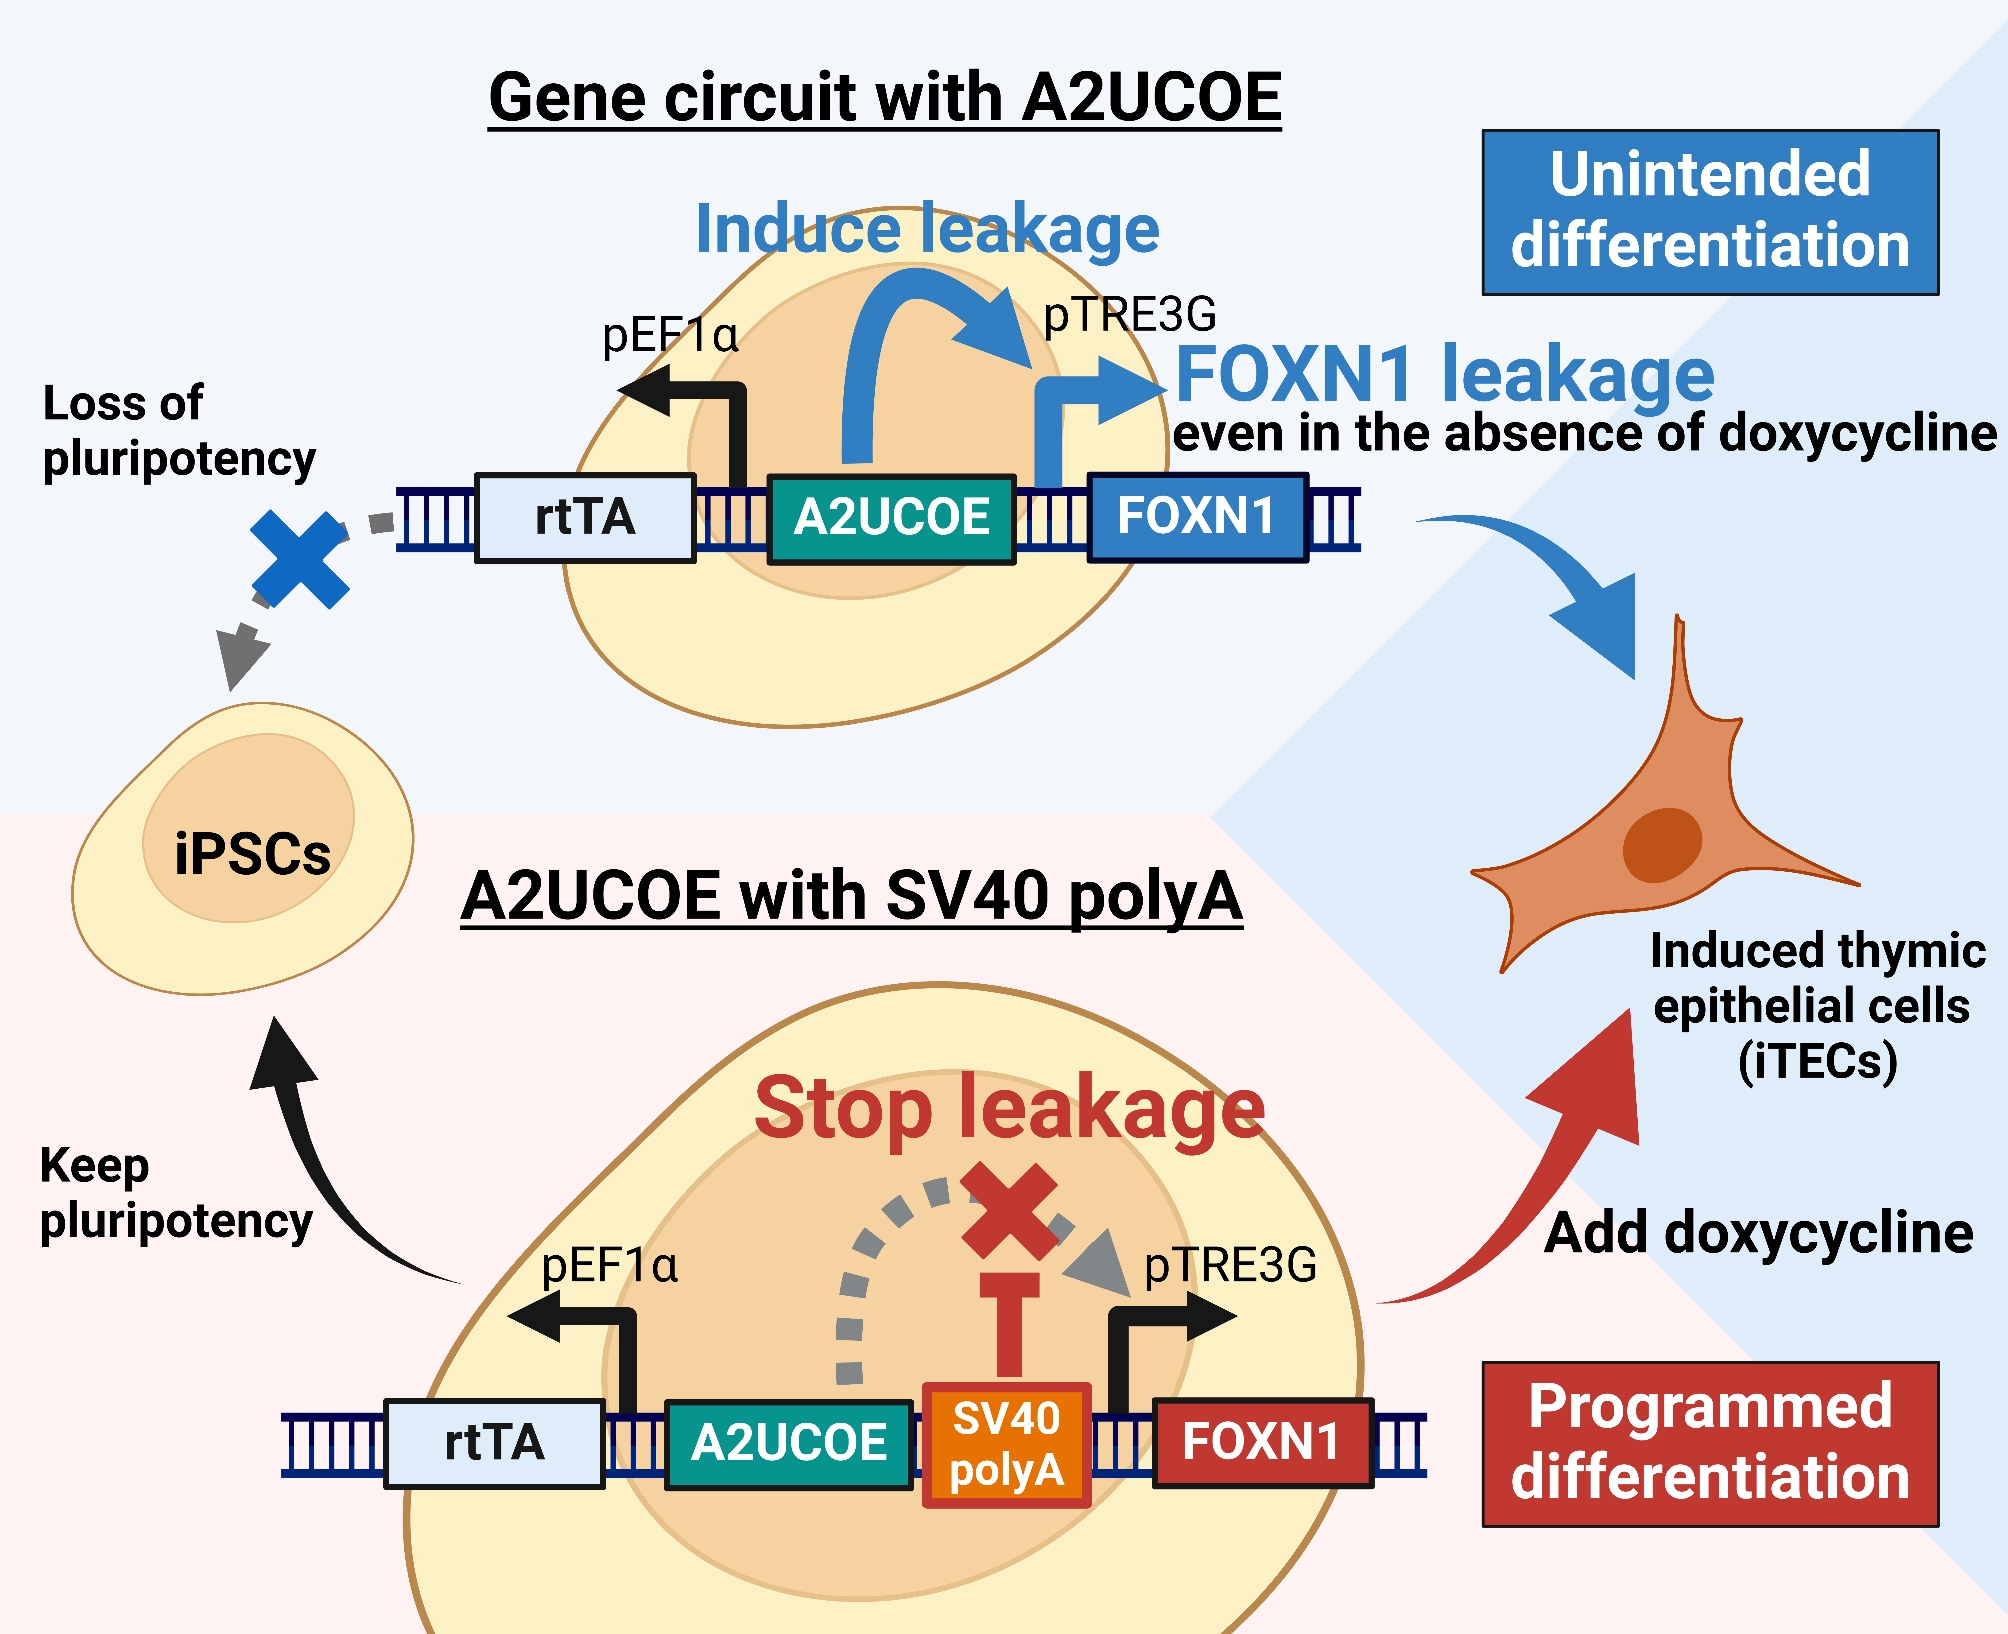
0.9 UCOE induces gene leakage and premature differentiation of iPS cellsHowever, we observed FOXN1 gene leakage in the pre-iTEC1 cell line even in the absence of doxycycline (Fig. 4A). When pre-iTEC1 was cultured without doxycycline for 30 days, we noted a significant decrease in the pluripotency markers OCT4, NANOG, and DNMT3B, indicating premature differentiation, whereas PGP1 cells maintained their pluripotency over the same 30-day culture period (Fig. 4B). Furthermore, after long-term culture for 90 days without doxycycline, we observed increased transcription of the TEC-specific markers DLL4 and ENPEP (Ly51), despite the absence of doxycycline (Fig. 4C). We also observed morphological changes after 30 days as the w/o UCOE bulk group maintained a dense colony-like appearance like iPSCs, whereas some cells in the 0.9 UCOE bulk group exhibited a looser and elongated form like TECs (Fig. 3F, Supplemental Fig. 6).
Fig. 4
0.9 UCOE induces gene leakage and unintended differentiation of iPS cells. A. Analysis of FOXN1 gene leakage in pre-iTEC1 and PGP1 without doxycycline treatment (n = 3). B. RT-qPCR comparison of undifferentiated marker genes OCT4, NANOG, and DNMT3 in pre-iTEC1 and PGP1 cultured without doxycycline for 30 days (n = 3). C. RT-qPCR comparison of TEC-specific markers DLL4 and ENPEP (Ly51) in pre-iTEC1 during 90 days culture without doxycycline (n = 3). D. Analysis of FOXN1 leakage in bulk cell populations of the 0.9 UCOE and w/o UCOE group by RT-qPCR (n = 3). E. FOXN1 leakage and ENPEP (Ly51) expression analysis in single-cell-derived colonies of 0.9 UCOE group and w/o UCOE group by RT-qPCR (n = 10). P-values were calculated using a two-tailed unpaired t-test and one-way analysis of variance with Tukey’s honestly significant difference test. Data are presented as mean ± SEM. For detailed data, statistical analyses, and exact p-values, see the source data file
To test the hypothesis that A2UCOE caused gene leakage, we integrated both 0.9 UCOE and w/o UCOE genetic circuits into PGP1 cells, generated new bulk groups, and evaluated the level of FOXN1 leakage in each group. The w/o UCOE group showed no significant difference in FOXN1 leakage compared to the control PGP1 cells, while the UCOE group exhibited significantly higher FOXN1 leakage in the absence of doxycycline (Fig. 4D). Next, we compared single-cell-derived clones from both groups. Ten colonies each were picked from both the 0.9 UCOE and w/o UCOE groups, and precise integration at Rogi1 was confirmed by PCR (Supplemental Fig. 7). When comparing FOXN1 leakage among these clones, no significant FOXN1 leakage was observed in the w/o UCOE colonies. In contrast, the 0.9 UCOE colonies displayed significant FOXN1 leakage and greater heterogeneity in absolute expression from clone to clone (Fig. 4E). Moreover, the 0.9 UCOE colonies showed elevated expression of the TEC marker ENPEP, even shortly after cell line establishment (Fig. 4E). These findings indicate that 0.9 UCOE contributes to gene leakage in the Tet-On system, leading to unexpected differentiation of iPS cells.
Evaluation of gene stability and gene leakage using various lengths of A2UCOE fragmentsNext, we generated several A2UCOE fragments to investigate whether longer or shorter forms could reduce gene leakage while enhancing expression stability. Previous studies have examined various lengths of A2UCOE fragments and their abilities to promote long-term stable expression; however, no studies to date have evaluated A2UCOE in terms of gene leakage. Using the UCSC Genome Browser, we identified the precise location of A2UCOE in the human genome along with information on nearby promoters and enhancers (Supplemental Fig. 2). Based on this information, we designed three new UCOE fragments (Fig. 5A, Supplemental Table 4). The 1.3 UCOE fragment, contains the untranslated region (UTR) and exon 1 of HNRNAPA2B1, along with EH38E2541925, a promoter-like element associated with HNRNAPA2B1, extending to include EH38E2541926, a promoter region and exon 1 of CBX3. The 0.7 UCOE fragment, 749 bp in length, does not include the HNRNAPA2B1 exon 1 or promoter region but contains the CBX3 exon 1 and promoter region, as well as the intergenic region between EH38E2541925 and EH38E2541926. The CBX UCOE fragment is shorter, at 547 bp, and includes only the CBX3 promoter region and exon 1. These three different UCOE fragments were then used to generate new FOXN1 expressing human iPSC clones as before.
Fig. 5
Evaluation of gene stability and gene leakage using various lengths of A2UCOE fragments. A. Design of different A2UCOE fragments. The 1.3 UCOE (1,337 bp) includes the untranslated region (UTR) and exon 1 of HNRNAPA2B1, as well as the promoter-like regions EH38E2541925 and EH38E2541926 extending to include the CBX3 exon 1. The 0.9 UCOE (863 bp) included the part of the HNRNAPA2B1 promoter and extending to exon 1 of CBX3. The 0.7 UCOE (749 bp) contains only the CBX3 exon 1, promoter region, and intergenic sequence. The CBX UCOE (547 bp) includes only the CBX3 promoter region and exon 1. These fragments were incorporated into the FOXN1 Tet-On inducible gene circuit and integrated into the Rogi1 site of PGP1 iPSCs. B. FOXN1 gene leakage in each UCOE group assessed on Day 0 by RT-qPCR (n = 3). C. Flow cytometry analysis of RFP-positive cells in each UCOE group on Day 0 and Day 30 (n = 3). D. Transcription levels of rtTA and mScarlet on Day 0 in each UCOE group by RT-qPCR (n = 3). E. Transcription levels of rtTA and mScarlet on Day 30 in each UCOE group after 30 days of culture without blasticidin by RT-qPCR (n = 3). P-values were calculated using one-way analysis of variance with Tukey’s honestly significant difference test. The data are presented as mean ± SEM. For detailed data, statistical analyses, and exact p-values, see source data file
We then compared FOXN1 gene leakage and constitutive marker gene expression silencing across the different UCOEs. First, we found that on Day 0 all UCOE fragments exhibited significant FOXN1 gene leakage at comparable levels (Fig. 5B). Using flow cytometry, we then found that on Day 0, the percentages of RFP-positive cells were similar across all UCOE fragments (49.4% for 1.3 UCOE, 43.6% for 0.9 UCOE, 54.6% for 0.7 UCOE, and 48.6% for CBX UCOE). Among these, only the 0.7 UCOE group showed a significant difference compared to the w/o UCOE control group, while the other UCOE fragments did not show any significant differences. By Day 30, the percentages of RFP + cells were also comparable across UCOEs (32.5–38.2%) (Fig. 5C, Supplemental Fig. 8).
We also evaluated the transcription levels of rtTA and mScarlet. On Day 0, transcription levels of rtTA and mScarlet were comparable across all UCOE fragments, with no significant differences relative to the w/o UCOE control group (Fig. 5D). However, by Day 30, transcription levels of rtTA were significantly maintained in the 1.3 UCOE and 0.9 UCOE groups compared to the w/o UCOE group. For mScarlet, transcription levels were significantly maintained in the 1.3 UCOE, 0.9 UCOE, and 0.7 UCOE groups compared to the w/o UCOE group. Notably in the 0.5 CBX UCOE group, transcription levels of both rtTA and mScarlet had decreased to levels comparable to those in the w/o UCOE group (Fig. 5E).
These results indicate that an A2UCOE length of at least 0.7 kb positively influences the maintenance of transcription levels, whereas the CBX-only UCOE fragment is insufficient to sustain transcription. However, when assessing the RFP-positive cell number via flow cytometry, no significant differences were observed between UCOE fragments of 0.7 kb or longer and the shorter CBX UCOE. Nevertheless, examining fluorescence output revealed that the intensity peak for the CBX-UCOE shifted significantly to the left compared to the peaks of the other three UCOE fragments, suggesting that the CBX UCOE results in a higher number of weakly positive RFP cells (Supplemental Fig. 9). Additionally, when doxycycline was administered to the CBX UCOE group after 30 days of culture, FOXN1 transcription levels were significantly higher compared to the w/o UCOE group and comparable to the 0.9 UCOE group (Supplemental Fig. 10). This finding suggests that, despite the lower transcription and protein expression levels of rtTA in the CBX UCOE group, the inducible gene expression function was stably maintained over an extended period. Overall, these results demonstrate that any UCOE fragment can sustain inducible gene expression function over time compared to the condition without UCOE.
SV40 poly-A spacer sequences mitigate gene leakage caused by A2UCOEFinally, we set out to solve the gene leakage caused by A2UCOE. Since UCOE sequences facilitate open chromatin in bidirectional gene clusters, we considered the possibility that it stabilizes RNA polymerase II elongation in both directions, despite the inducible TRE promoter lacking bound rtTA activating proteins. Whereas the UCOE contains a high density of CpG dinucleotides thought to prevent silencing, AT-rich sequences are thought to condense chromatin and resist protein binding, and are often found in termination sequences, matrix attachment regions, and replication origins. We hypothesized that inserting an AT-rich spacer sequence between the A2UCOE and TRE promoter might reduce the leaky gene expression. To test this hypothesis, we introduced several AT-rich spacer sequences between A2UCOE and TRE-FOXN1. We designed random 238 bp spacer sequences with evenly distributed AT content of 35%, 50%, and 65%, labeled AT35, AT50, and AT65, respectively (Fig. 6A, Supplemental Table 5). Additionally, we included a 238 bp spacer sequence with 65% AT content that contained the 122 bp termination sequence SV40 poly-A (SV40), which includes homopolymeric A and T tracts known to terminate transcription by forming hairpin structures and recruiting termination proteins.
Fig. 6
SV40 poly-A spacer sequences mitigate gene leakage caused by A2UCOE. A. Schematic of genetic circuit architecture with various AT-rich spacer sequences between A2UCOE and the TRE-FOXN1 promoter. Spacer sequences were designed randomly with 238 bp lengths and varied AT content: about 35% (AT35), 50% (AT50), and 65% (AT65), as well as a 65% AT-rich spacer containing the 122 bp SV40 poly-A termination sequence (SV40). The dark green and light green bars represent the sequence composition, with A and T shown in dark green and C and G in light green. The SV40 poly-A sequence is highlighted with an orange box. B. Quantification of FOXN1 gene leakage in bulk cell populations following the integration of gene circuits with different AT-rich spacers by RT-qPCR (n = 3). C. Quantification of FOXN1 gene induction in the bulk cell populations after 5 days of culture with blasticidin, followed by doxycycline treatment (n = 4). D. Flow cytometry analysis of RFP-positive (mScarlet+) cells in the SV40 poly-A spacer group after 30 days of culture without blasticidin (n = 3). P-values were calculated using one-way analysis of variance with Tukey’s honestly significant difference test. The data are presented as mean ± SEM. For detailed data, statistical analyses, and exact p-values, see source data file
These genetic circuits were integrated into the Rogi1 site in PGP1 cells as before, followed by a 5-day blasticidin selection to generate bulk populations. We then evaluated FOXN1 gene leakage in these populations. As shown in Fig. 6B, the SV40 spacer significantly reduced FOXN1 leakage to nearly the same level as the control group. In contrast, the AT35, AT50, and AT65 spacers did not show a significant reduction in leakage compared to the UCOE alone, suggesting that a 238 bp separation alone is insufficient to mitigate leakiness, nor does AT content alone seem to influence gene leakage.
Then, we evaluated whether the SV40 poly-A sequence, which effectively eliminated leakage, would impact the drug-inducible gene expression function of the Tet-On system. After a 5-day blasticidin selection following gene editing, doxycycline (1 µg/mL) was administered to the bulk cell populations, and FOXN1 induction was assessed. The results showed that the SV40 poly-A spacer group exhibited significant induction of FOXN1 transcription in response to doxycycline (Fig. 6C). Moreover, there was no significant difference in the level of induced gene transcription between the SV40 poly-A spacer group and the UCOE-only group.
Next, we tested whether this new genetic circuit architecture containing the SV40 poly-A spacer preserved the original UCOE benefits of anti-silencing and enhanced transcriptional stability. As before, cells were cultured without blasticidin for 30 days, and RFP-positive (mScarlet+) cells were quantified by flow cytometry. Even in the group containing the SV40 poly-A spacer, the number of RFP-expressing cells was maintained on Day 30 compared to the w/o UCOE control group (Fig. 6D). Moreover, the SV40 poly-A group also showed significantly better maintenance of RFP + cell numbers compared to the UCOE-only group, enhancing anti-silencing by > 60% compared to UCOE-alone (Fig. 6D). These results demonstrate that the SV40 poly-A termination sequence effectively eliminates gene leakage caused by A2UCOE while also boosting its original anti-silencing and transcription-stabilizing benefits.
Comments (0)