
Remember me


Among the 2017 respondents involved in the final analysis, the mean (SD) age was 29 (± 6.2); (n = 1048, 52%) were males and (n = 969, 48%) were females. The majority of them had a bachelor's degree as their highest educational degree (n = 1549, 76.8%). About (n = 732, 36.3%) were interns, (n = 421, 20.9%) were general practitioners, (n = 274, 13.6%) were junior residents, (n = 246, 12.2%) were specialists, and (n = 343, 17.1%) were senior residents, sub-senior residents, and consultants. Concerning the workload, the median number of working shifts per week was 4 [1,2,3,4,5,6,7,8,9,10], and the mean number of working hours per shift was 11.8 ± 8.3 h, and the mean number of working hours per week was 39.8 ± 26.3. More than half of the participants work 2–5 h per shift (n = 1314, 18.7%) work more than 5 shifts per week, and (n = 325, 16.1%) work less than 2 shifts per week. (n = 1173, 58.2%) work for less than 12 h per shift, (n = 801, 39.7%) work for 12–24 h per shift, and only (n = 43, 2.1%) work for more than 24 h per shift. The sociodemographic characteristics of the study sample are shown in Table 1.
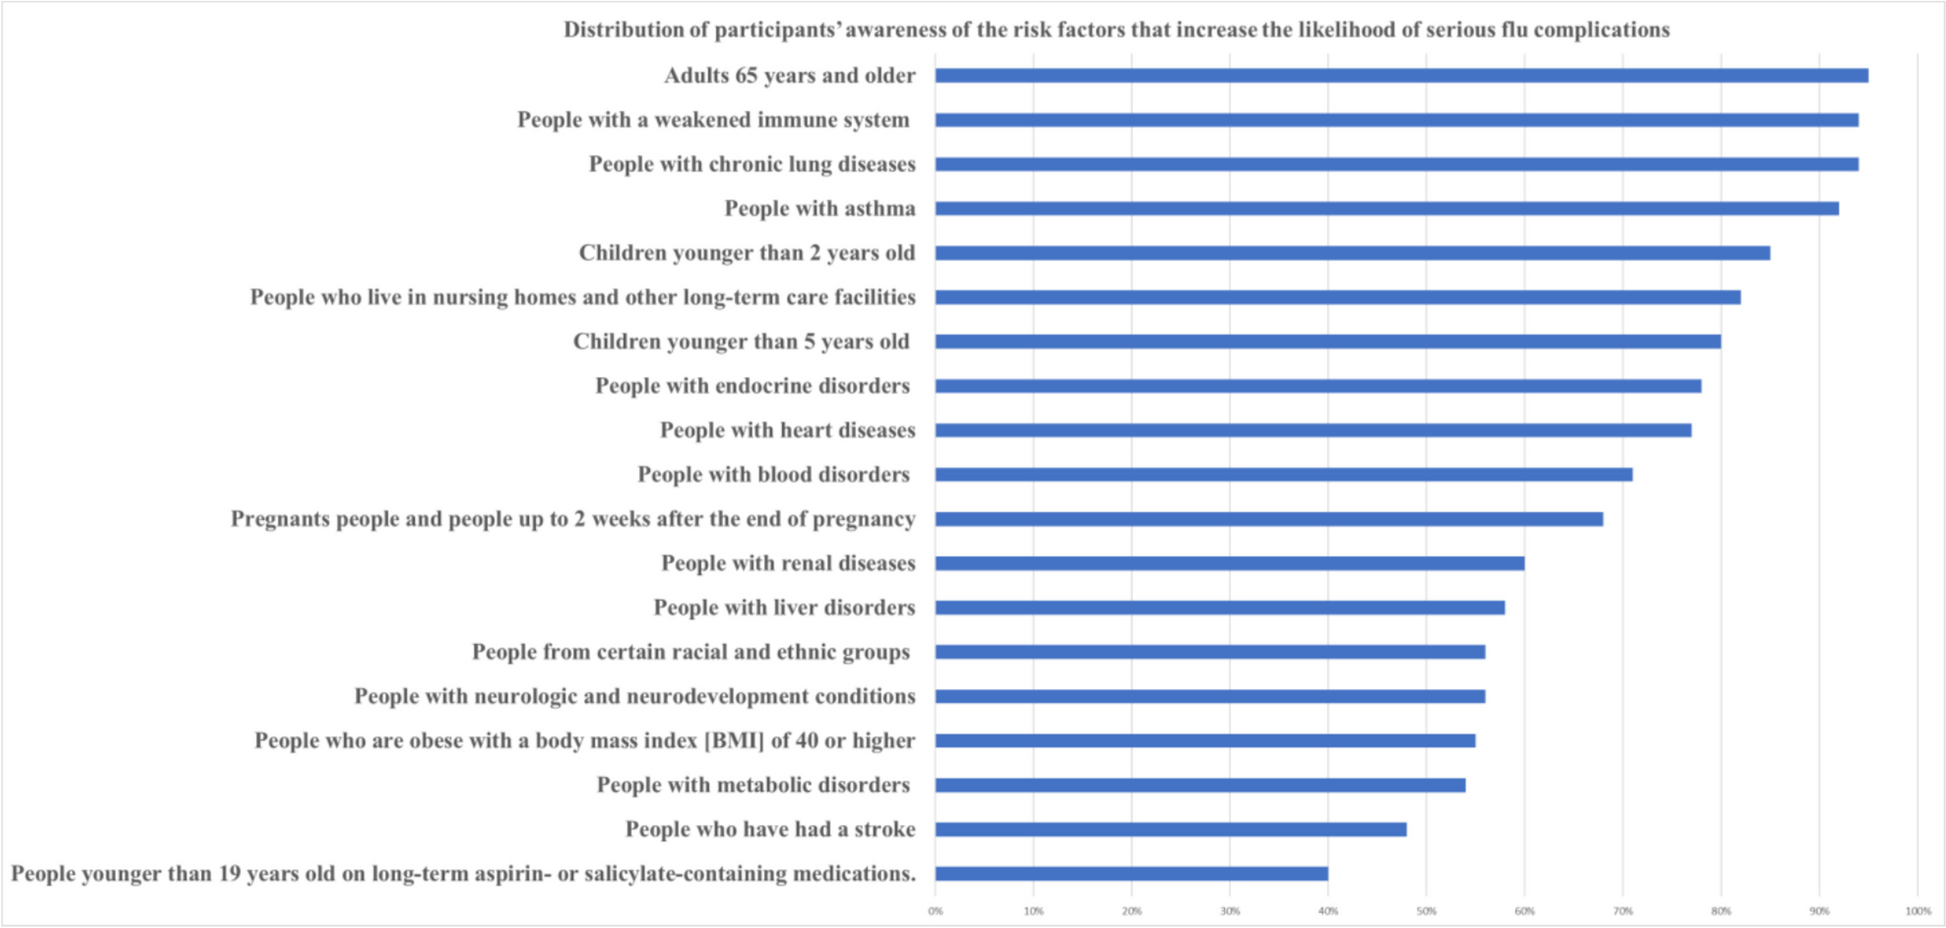
Table 1 Sample characteristicsAwareness of the high-risk groups of patientsRegarding the awareness of the participants with risk factors that are known to increase the likelihood of serious influenza complications, as established by the Centers for Disease Control and Prevention (CDC), the median number of known items was 13 items, with a minimum number of 0 and a maximum known number of 19 items. The item ‘adults 65 years of age and older’ was the highest item reported to be known by participants (n = 1916, 95%), followed by chronic lung disease (n = 1897, 94.1%), weakened immune system people (n = 1887, 93.6%), and asthmatic people (n = 1853, 91.9%). The item that was the least reported to be known by participants was ‘people younger than 19 years old on long-term aspirin- or salicylate-containing medications’ (n = 806, 40%). The distribution of participants’ awareness of the risk factors is shown in Fig. 1.
Fig. 1
The distribution of participants’ awareness regarding different high-risk groups
Physicians’ knowledge and attitude toward influenza vaccineParticipants had a mean knowledge score of 16.6 ± 3.2, about half of the participants (n = 1006,49.9%) had a medium knowledge level, (n = 931, 46.2%) had a low knowledge level, and only (n = 80, 4%) had a high knowledge level.
Physicians had a mean attitude score of 4.7 ± 1.8. The majority (n = 1511, 74.9%) were quite concerned, (n = 468, 23.2%) were little concerned, (n = 20, 1.4%) were not concerned, and only (n = 9, 0.4%) were extremely concerned toward the influenza vaccine. In addition, there was a significant correlation between the total knowledge score and the total attitude score of the participants (r = 0.326, p = < 0.001) (Fig. 2).
Fig. 2
Most of the participants answered the questions regarding the signs of influenza and coughing and sneezing as the primary modes of transmission correctly (n = 1930, 95.7%) and (n = 1922, 95.3%), respectively. However, about one-third only answered the questions regarding the difference between subunit and split influenza vaccines, the specific guidelines on preventive care for influenza, the latent period of influenza, and the difference between trivalent and quadrivalent influenza vaccines correctly. Physician awareness toward influenza and influenza vaccination is shown in Table 2.
Table 2 Shows the physicians knowledge questionnaire percentage of correct answersCorrelated factors with the physician’s knowledge and attitudeThere was a significant correlation between the knowledge total score of the participants and the number of known risk groups, age, average working hours/week, and the number of working shifts/week. (p < 0.05).
In addition, there was a significant correlation between their attitude total score and their number of known risk groups, age, and number of working shifts/week (p < 0.05) as shown in Fig. 2.
Association between the physicians’ knowledge levels and different characteristicsTable 3 shows the association between knowledge levels and different characteristics of the participants. About (n = 552, 52%) of the male participants had a medium level of knowledge, while (n = 485, 50%) of the female participants had a low knowledge level. There was a significant association between the knowledge level and the sex of the participants (p < 0.05).
Table 3 Association between the levels of knowledge and different sample characteristicsBesides, there was a significant association between the participants’ knowledge level and their countries' income (p < 0.05).
More than half of the general practitioners, senior residents, and consultants had a medium level of knowledge, while about half of the junior residents, the sub-senior residents, and the interns had low knowledge levels. Those differences among the seniority groups were statistically significant (p < 0.05).
(n = 216, 57.1%) of the participants who worked for more than 5 shifts per week had a medium level of knowledge, and (n = 661, 50%) of those who worked for 2–5 shifts per week had a medium level of knowledge, while (n = 183,56.3%) of the participants who worked for less than 2 shifts per week had a low level of knowledge. There was a significant association between the number of shifts per week and the level of knowledge of the participants. (p < 0.05).
Association between the physicians’ attitude levels and different characteristicsTable 4 shows the association between the participants’ attitudes and the different characteristics of the participants. (n = 786, 75%) of the male and female participants had quite concerned attitudes. However, there was no significant association between the attitude level and the sex of the participants.
Table 4 Association between the levels of attitude and different sample characteristicsRegarding the highest educational degree of the participants, there was a significant difference between the attitude level and the educational degree of the participants, and the majority of each group were of quite concerned attitude regarding the influenza vaccine (p < 0.05). Besides, the number of hours that the physicians used to work per shift has a statistically significant association with the level of attitude of the physicians. (p < 0.05).
Practice of the physicians towards offering the influenza vaccine to their patientsRegarding the practice of the physicians towards offering the influenza vaccine to their patients, only (n = 509, 25.4%) of the participants offered the influenza vaccine to their patients. Of those who offer the vaccine, (n = 199, 39%) offer it to less than 10% of their patients, (n = 127, 25%) to more than 40%, (n = 117, 23%) to 10–25%, and (n = 61, 12%) to 25–40%.
Furthermore, binomial logistic regression analysis was performed to classify physicians' practice of offering the influenza vaccine based on values of a set of predictor factors. The dependent variable (offering influenza vaccine) involved two levels (offer and didn’t offer the influenza vaccine). We used “didn’t offer influenza vaccine” as a reference level.
Table 5 shows the results of binomial logistic regression analysis. In the multivariable model, age was a significant predictor for offering the vaccine (adjusted odd ratio (AOR) = 1.036, 95%CI = 1.003–1.07, p = 0.031). Furthermore, males tend to offer the vaccine more than females (AOR = 1.39, 95%CI = 1.09–1.77, p = 0.007). The country's income was a significant predictor for offering the vaccine and participants from upper-middle-income countries tended to offer the vaccine more frequently than others (AOR = 3.14, 95%CI = 2.1–4.7, p < 0.001). The probability of offering influenza vaccine was higher among participants with doctoral degrees (AOR = 3.15, 95%CI = 1.47–6.71, p = 0.003), senior residents (AOR = 2.005, 95%CI = 1.147–3.5, p = 0.015), working two to five shifts per week (AOR = 1.55, 95%CI = 1.02–2.35, p = 0.04), working more than five shifts per week (AOR = 1.75, 95%CI = 1.06- 2.88, p = 0.027), and higher attitude score (AOR = 1.33, 95%CI = 1.243- 1.44, p < 0.001). In addition, participants who follow the following practice regarding influenza vaccine for office staff tended to offer the vaccine more: encourage and offer the influenza vaccine (AOR = 5.73, 95%CI = 4.11- 8.007, p < 0.001), require, but do not offer the influenza vaccine (AOR = 3.73, 95%CI = 2.59- 5.38, p < 0.001), require and offer the influenza vaccine (AOR = 6.79, 95%CI = 4.88- 9.45, p < 0.001).
Table 5 Regression analysis for offering the influenza vaccineBarriers that hinder physicians from offering the influenza vaccineRegarding the barriers that hindered the participants from providing the influenza vaccine, (n = 653, 32%) of the physicians reported unawareness of the availability of the vaccine in their settings, (n = 505, 25%) reported the cost of the vaccine, (n = 472, 23.4%) reported that they forgot to offer it, (n = 235, 11.7%) reported that patients scared of needles, (n = 196, 9.7%) reported that they thought it’s not beneficial, and (n = 188, 9.3%) for the history of side effects. Furthermore, approximately (n = 524, 26%) reported not applicable reason, and (n = 505, 25%) mentioned other reasons.
The association between the World Bank classification of participants' countries and their reported barriers to offering the vaccine to their patients was significant (p < 0.001) for all factors except for ‘think it is not beneficial’ (p = 0.22) as shown in Fig. 3.
Fig. 3
Distribution of reported barriers that hinder physicians from offering the influenza vaccine
Comments (0)