Correction: American Journal of Clinical Dermatology https://doi.org/10.1007/s40257-023-00796-2
In this article, a coding error in relation to the analysis of a number of study outcomes has come to the attention of the authors after publication of the article. In summary, the proportion of patients with comorbidities, the proportion of patients receiving certain procedures and treatments, and therefore also HCRU costs for patients, were incorrectly classified during data analysis due to discrepancies in the study codes used for comorbidities. These coding errors have resulted in some minor data inaccuracies being reported in the manuscript and supplementary appendix. In addition, as part of the re-analysis, a minor variation occurred for classification of ethnicity (without any effect on other data analyses) and for patients with a negative total cost (they were removed from the HCRU and cost analysis resulting in minor changes in reported patient numbers).
Careful review of the data have confirmed that the coding errors and re-analysis have had no effects on the study conclusions. Values and text relating to this analysis have been corrected and are outlined below. Changes are highlighted in bold, where applicable.
Text relating to comorbidities, treatment and procedures, and healthcare costs: Abstract (results) page 977
On page 977 (Abstract, results) the following text currently reads as:
“Commonly reported Charlson comorbidities at pre-index in adult patients were diabetes without complications (20.4%), chronic pulmonary disease (16.4%) and diabetes with complications (9.0%), and the most frequent Elixhauser comorbidities were uncomplicated hypertension (38.3%), obesity (22.5%), uncomplicated diabetes (19.0%) and depression (17.4%). The burden of comorbidities generally increased over time after diagnosis in both adults and adolescents. HS-related surgical procedures were uncommon in the 2-years post-index period: an incision and drainage procedure was reported in 7.6% of adults and 6.4% of adolescents. Patients were predominantly treated with both topical and systemic antibiotic treatments (adults: 25.0% and 65.1%, respectively; adolescents: 41.7% and 74.5%, respectively). Biologic prescription was higher in adults than adolescents (3.5% vs. 1.8%). Total healthcare costs for adult and adolescent patients in the 2-years post-index period were US$42,143 and US$16,057, respectively, with outpatient costs accounting for the majority of these costs (US$20,980 and US$8,408, respectively).
The updated text should now read as:
“Commonly reported Charlson comorbidities at pre-index in adult patients were diabetes without complications (21.1%), chronic pulmonary disease (18.6%) and diabetes with complications (9.5%), and the most frequent Elixhauser comorbidities were uncomplicated hypertension (39.2%), obesity (24.6%), uncomplicated diabetes (19.8%) and depression (18.6%). The burden of comorbidities generally increased over time after diagnosis in both adults and adolescents. HS-related surgical procedures were uncommon in the 2-years post-index period: an incision and drainage procedure was reported in 7.6% of adults and 6.4% of adolescents. Patients were predominantly treated with both topical and systemic antibiotic treatments (adults: 23.7% and 56.0%, respectively; adolescents: 39.0% and 59.2%, respectively). Biologic prescription was higher in adults than adolescents (3.4% vs. 1.6%). Total healthcare costs for adult and adolescent patients in the 2-years post-index period were US$36,483 and US$14,449, respectively, with outpatient costs accounting for the majority of these costs (US$18,242 and US$7,529.50, respectively).”
Text relating to comorbidities: 3.2 Comorbidities among Incident Hidradenitis Suppurativa (HS) Patients (page 980)
On page 980 (Section 3.2, right hand column) the following text currently reads as:
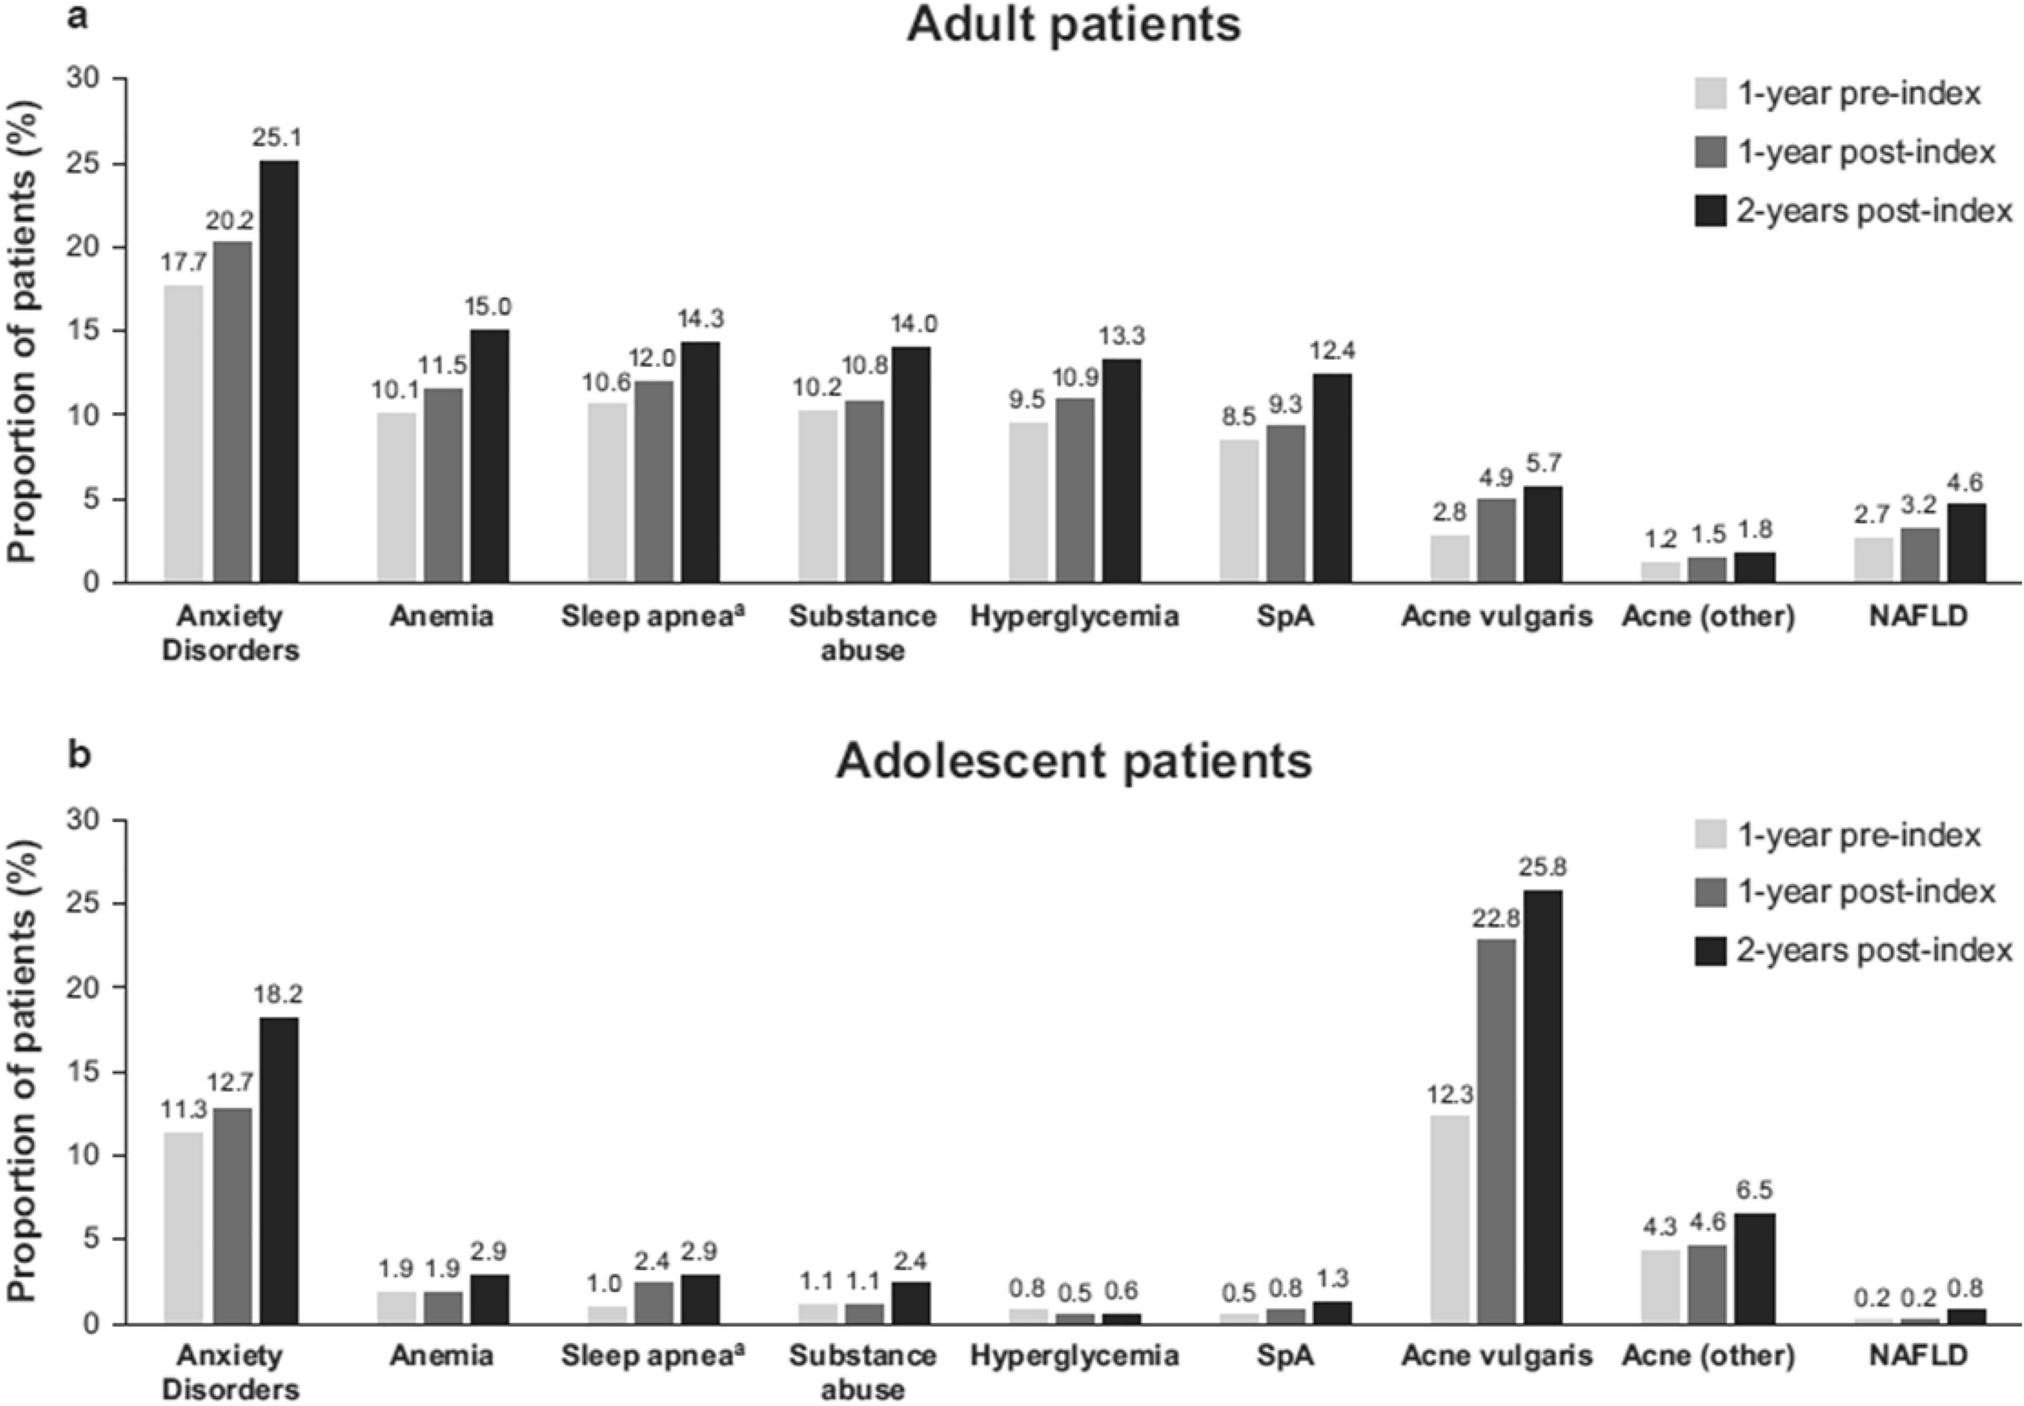
“As expected, the frequencies of Charlson comorbidities were low in adolescents, except for chronic pulmonary disease (likely asthma rather than chronic obstructive pulmonary disease), being present in 8.3%, 8.9% and 10.7% of adolescents in the 1-year pre-index, 1-year post-index and 2-years post-index periods, respectively (Table 2).”
The updated text should now read as:
“As expected, the frequencies of Charlson comorbidities were low in adolescents, except for chronic pulmonary disease (likely asthma rather than chronic obstructive pulmonary disease), being present in 10.2%, 11.2% and 15.1% of adolescents in the 1-year pre-index, 1-year post-index and 2-years post-index periods, respectively (Table 2).”
Text relating to procedures and treatments: 3.3 Procedures and Treatments among Incident Adult and Adolescent HS Patients (page 980/981)
On page 980/981 (Section 3.3) the following text currently reads as:
“Biologic prescription was higher in adults and increased slightly between the 1- and 2-years post-index periods in both adults (2.6% vs. 3.5%) and adolescents (0.6% vs. 1.8%). Most biologic prescriptions were for adalimumab (91.0% [322/354] and 90.9% [10/11] for adult and adolescent patients in the 2-years post-index period, respectively), with the remainder of biologic prescriptions used being off-label for this indication.”
The updated text should now read as:
“Biologic prescription was higher in adults and increased slightly between the 1- and 2-years post index periods in both adults (2.7% vs. 3.4%) and adolescents (0.6% vs. 1.6%). Most biologic prescriptions were for adalimumab (91.0% [314/345] and 90.0% [9/10] for adult and adolescent patients in the 2-years post-index period, respectively), with the remainder of biologic prescriptions used being off-label for this indication.”
Text relating to HCRU and costs: 3.4 HS‑Related Healthcare Resource Utilization and Associated Costs among Incident Adult and Adolescent HS Patients (page 984)
On page 984 (Section 3.4) the following text currently reads as:
“The total healthcare cost (total medical plus total prescription cost) for adult and adolescent patients in the 2-years post-index period was US$42,143 and US$16,057, respectively (Table 6). Outpatient costs accounted for most total medical costs for both adults and adolescent patients. HS-specific total healthcare costs accounted for 4–15% of overall total healthcare costs in adult and adolescent patients in the 1- and 2-years post-index periods (Table 6).”
The updated text should now read as:
“The total healthcare cost (total medical plus total prescription cost) for adult and adolescent patients in the 2-years post-index period was US$36,483 and US$14,449, respectively (Table 6). Outpatient costs accounted for most total medical costs for both adults and adolescent patients. HS-specific total healthcare costs accounted for 4–15% of overall total healthcare costs in adult and adolescent patients in the 1- and 2-years post-index periods (Table 6).”
On page 981, Table 1 is currently displayed as:
Patient demographics
Characteristics
Incident HS patientsa
[N = 10,909]
Incident HS adults
[N = 10,230]
Incident HS adolescents
[N = 628]
Age, years [mean (SD)]
45.1 (18.5)
47.1 (17.3)
15.3 (1.5)
Age at index, years [n (%)]
< 12
51 (0.5)
–
–
12–17
628 (5.8)
–
628 (100.0)
18–29
1816 (16.6)
1816 (17.8)
–
30–39
2062 (18.9)
2062 (20.2)
–
40–49
1945 (17.8)
1945 (19.0)
–
50–59
1723 (15.8)
1723 (16.8)
–
≥ 60
2684 (24.6)
2684 (26.2)
–
Female [n (%)]
7711 (70.7)
7142 (69.8)
533 (84.9)
Ethnicity
Asian
351 (3.2)
328 (3.2)
22 (3.5)
Black
2050 (18.8)
1947 (19.0)
94 (15.0)
Hispanic
1350 (12.4)
1242 (12.1)
99 (15.8)
White
6878 (63.0)
6454 (63.1)
392 (62.4)
Missing
280 (2.6)
259 (2.5)
21 (3.3)
Region of residenceb [n (%)]
Midwest
2635 (24.2)
2428 (23.7)
195 (31.1)
Northeast
986 (9.0)
940 (9.2)
41 (6.5)
South
5303 (48.6)
4981 (48.7)
298 (47.5)
West
1963 (18.0)
1860 (18.2)
93 (14.8)
Other
22 (0.2)
21 (0.2)
1 (0.2)
Insurance type [n (%)]
Commercial
7711 (70.7)
7032 (68.7)
628 (100.0)
Medicare
3198 (29.3)
3198 (31.3)
–
Diagnosing physician [n (%)]
Dermatologist
2459 (22.5)
2256 (22.1)
192 (30.6)
ER/hospital
1055 (9.7)
989 (9.7)
59 (9.4)
GP/pediatrician
4529 (41.5)
4255 (41.6)
249 (39.6)
OBGYN
635 (5.8)
612 (6.0)
23 (3.7)
Other HCPs
1038 (9.5)
972 (9.5)
63 (10.0)
Other specialist
382 (3.5)
366 (3.6)
14 (2.2)
Surgeon
811 (7.4)
780 (7.6)
28 (4.5)
Year of diagnosis [n (%)]
2016
3145 (28.8)
2921 (28.6)
203 (32.3)
2017
3686 (33.8)
3451 (33.7)
218 (34.7)
2018
4078 (37.4)
3858 (37.7)
207 (33.0)
ER emergency room, GP general practitioner, HCPs healthcare providers, HS hidradenitis suppurativa, N number of patients in each group, n number of patients with outcome, OBGYN obstetrician and gynecology, SD standard deviation, US United States
aFifty-one patients were < 12 years of age and were therefore not included in the adult or adolescent cohorts
bRegions of residence were derived from the reported state of residence and were categorized using the US census-defined regions
The updated table should now be displayed as:
Patient demographics
Characteristics
Incident HS patientsa
[N = 10,909]
Incident HS adults
[N = 10,230]
Incident HS adolescents
[N = 628]
Age, years [mean (SD)]
45.1 (18.5)
47.1 (17.3)
15.3 (1.5)
Age at index, years [n (%)]
< 12
51 (0.5)
–
–
12–17
628 (5.8)
–
628 (100.0)
18–29
1816 (16.6)
1816 (17.8)
–
30–39
2062 (18.9)
2062 (20.2)
–
40–49
1945 (17.8)
1945 (19.0)
–
50–59
1723 (15.8)
1723 (16.8)
–
≥ 60
2684 (24.6)
2684 (26.2)
–
Female [n (%)]
7711 (70.7)
7142 (69.8)
533 (84.9)
Ethnicity
Asian
351 (3.2)
328 (3.2)
22 (3.5)
Black
2050 (18.8)
1947 (19.0)
94 (15.0)
Hispanic
1350 (12.4)
1242 (12.1)
99 (15.8)
White
6876 (63.0)
6453 (63.1)
391 (62.3)
Missing
282 (2.6)
260 (2.5)
22 (3.5)
Region of residenceb [n (%)]
Midwest
2635 (24.2)
2428 (23.7)
195 (31.1)
Northeast
986 (9.0)
940 (9.2)
41 (6.5)
South
5303 (48.6)
4981 (48.7)
298 (47.5)
West
1963 (18.0)
1860 (18.2)
93 (14.8)
Other
22 (0.2)
21 (0.2)
1 (0.2)
Insurance type [n (%)]
Commercial
7711 (70.7)
7032 (68.7)
628 (100.0)
Medicare
3198 (29.3)
3198 (31.3)
–
Diagnosing physician [n (%)]
Dermatologist
2459 (22.5)
2256 (22.1)
192 (30.6)
ER/hospital
1055 (9.7)
989 (9.7)
59 (9.4)
GP/pediatrician
4529 (41.5)
4255 (41.6)
249 (39.6)
OBGYN
635 (5.8)
612 (6.0)
23 (3.7)
Other HCPs
1038 (9.5)
972 (9.5)
63 (10.0)
Other specialist
382 (3.5)
366 (3.6)
14 (2.2)
Surgeon
811 (7.4)
780 (7.6)
28 (4.5)
Year of diagnosis [n (%)]
2016
3145 (28.8)
2921 (28.6)
203 (32.3)
2017
3686 (33.8)
3451 (33.7)
218 (34.7)
2018
4078 (37.4)
3858 (37.7)
207 (33.0)
ER emergency room, GP general practitioner, HCPs healthcare providers, HS hidradenitis suppurativa, N number of patients in each group, n number of patients with outcome, OBGYN obstetrician and gynecology, SD standard deviation, US United States
aFifty-one patients were < 12 years of age and were therefore not included in the adult or adolescent cohorts
bRegions of residence were derived from the reported state of residence and were categorized using the US census-defined regions
On page 982, Table 2 is currently displayed as:
Charlson comorbidities in incident adult and adolescent HS patients
1-year pre-index
1-year post-index
2-years post-index
Adults (N = 10,230)
Adolescents (N = 628)
Adults (N = 10,230)
Change vs 1-year pre-index (%)
Adolescents (N = 628)
Change vs 1-year pre-index (%)
Adults (N = 10,230)
Change vs 1-year pre-index (%)
Adolescents (N = 628)
Change vs 1-year pre-index (%)
CCI, mean (SD)
0.7 (1.4)
–
0.8 (1.6)
–
–
–
1.0 (1.8)
–
–
–
Diabetes without complications[n (%)]
2091 (20.4)
5 (0.8)
2291 (22.4)
2.0
6 (1.0)
0.2
2455 (24.0)
3.6
8 (1.3)
0.5
Chronic pulmonary disease [n (%)]
1679 (16.4)
52 (8.3)
1848 (18.1)
1.7
56 (8.9)
0.6
2214 (21.6)
5.2
67 (10.7)
2.4
Diabetes with complications, [n (%)]
924 (9.0)
0 (0)
1078 (10.5)
1.5
1 (0.2)
0.2
1240 (12.1)
3.1
2 (0.3)
0.3
Peripheral vascular disease, [n (%)]
637 (6.2)
1 (0.2)
726 (7.1)
0.9
2 (0.3)
0.1
936 (9.1)
2.9
2 (0.3)
0.1
Renal disease, [n (%)]
603 (5.9)
1 (0.2)
744 (7.3)
1.4
2 (0.3)
0.1
908 (8.9)
3.0
2 (0.3)
0.1
Any malignancy, [n (%)]
490 (4.8)
3 (0.5)
556 (5.4)
0.6
5 (0.8)
0.3
678 (6.6)
1.8
5 (0.8)
0.3
Congestive HF, [n (%)]
424 (4.1)
1 (0.2)
534 (5.2)
1.1
1 (0.2)
0
679 (6.6)
2.5
2 (0.3)
0.1
Mild liver disease, [n (%)]
388 (3.8)
3 (0.5)
429 (4.2)
0.4
1 (0.2)
− 0.3
603 (5.9)
2.1
6 (1.0)
0.5
Cerebrovascular disease, [n (%)]
373 (3.6)
0 (0)
438 (4.3)
0.7
0 (0)
0
579 (5.7)
2.1
0 (0)
0
Rheumatic disease, [n (%)]
337 (3.3)
2 (0.3)
403 (3.9)
0.6
2 (0.3)
0
466 (4.6)
1.3
2 (0.3)
0
Myocardial infarction, [n (%)]
201 (2.0)
0 (0)
243 (2.4)
0.4
0 (0)
0
331 (3.2)
1.2
0 (0)
0
CCI Charlson Comorbidity Index, HF heart failure, N number of patients in group, n number of patients with outcome, SD standard deviation
The updated table should now be displayed as:
Charlson comorbidities in incident adult and adolescent HS patients
1-year pre-index
1-year post-index
2-years post-index
Adults (N = 10,230)
Adolescents (N = 628)
Adults (N = 10,230)
Change vs 1-year pre-index (%)
Adolescents (N = 628)
Change vs 1-year pre-index (%)
Adults (N = 10,230)
Change vs 1-year pre-index (%)
Adolescents (N = 628)
Change vs 1-year pre-index (%)
CCI, mean (SD)
0.8 (1.5)
0.1 (0.4)
0.9 (1.6)
–
0.2 (0.6)
–
1.2 (1.9)
–
0.2 (0.8)
–
Diabetes without complications, [n (%)]
2161 (21.1)
8 (1.3)
2384 (23.3)
2.2
7 (1.1)
− 0.2
2623 (25.6)
4.5
12 (1.9)
0.6
Chronic pulmonary disease, [n (%)]
1906 (18.6)
64 (10.2)
2075 (20.3)
1.7
70 (11.2)
1.0
2621 (25.6)
7.0
95 (15.1)
4.9
Diabetes with complications, [n (%)]
968 (9.5)
0 (0)
1145 (11.2)
1.7
1 (0.2)
0.2
1354 (13.2)
3.7
2 (0.3)
0.3
Peripheral vascular disease, [n (%)]
720 (7.0)
1 (0.2)
828 (8.1)
1.1
2 (0.3)
0.1
1142 (11.2)
4.2
2 (0.3)
0.1
Renal disease, [n (%)]
643 (6.3)
1 (0.2)
792 (7.7)
1.4
2 (0.3)
0.1
995 (9.7)
3.4
2 (0.3)
0.1
Any malignancy, [n (%)]
530 (5.2)
3 (0.5)
596 (5.8)
0.6
5 (0.8)
0.3
748 (7.3)
2.1
5 (0.8)
0.3
Congestive HF, [n (%)]
464 (4.5)
1 (0.2)
574 (5.6)
1.1
1 (0.2)
0
756 (7.4)
2.9
2 (0.3)
0.1
Mild liver disease, [n (%)]
534 (5.2)
4 (0.6)
573 (5.6)
0.4
3 (0.5)
− 0.1
861 (8.4)
3.2
11 (1.8)
1.2
Cerebrovascular disease, [n (%)]
442 (4.3)
0 (0)
520 (5.1)
0.8
0 (0)
0
743 (7.3)
3.0
0 (0)
0
Rheumatic disease, [n (%)]
355 (3.5)
2 (0.3)
434 (4.2)
0.7
4 (0.6)
0.3
527 (5.2)
1.7
5 (0.8)
0.5
Myocardial infarction, [n (%)]
217 (2.1)
0 (0)
271 (2.7)
0.6
0 (0)
0
378 (3.7)
1.6
0 (0)
0
CCI Charlson Comorbidity Index, HF heart failure, N number of patients in group, n number of patients with outcome, SD standard deviation
On page 983–984, Table 3 is currently displayed as:
Elixhauser comorbidities in incident adult and adolescent HS patients
1-year pre-index
1-year post-index
2-years post-index
Adults (N = 10,230)
Adolescents (N = 628)
Adults (N = 10,230)
Change vs 1-year pre-index (%)
Adolescents (N = 628)
Change vs 1-year pre-index (%)
Adults (N = 10,230)
Change vs 1-year pre-index (%)
Adolescents (N = 628)
Change vs 1-year pre-index (%)
ECI, mean (SD)
1.2 (5.7)
–
1.4 (6.3)
–
–
–
2.0 (7.4)
–
–
–
Hypertension, uncomplicated, [n (%)]
3914 (38.3)
5 (0.8)
4232 (41.4)
3.1
8 (1.3)
0.5
4576 (44.7)
6.4
10 (1.6)
0.8
Obesity, [n (%)]
2306 (22.5)
63 (10.0)
2749 (26.9)
4.4
85 (13.5)
3.5
3352 (32.8)
10.3
113 (18.0)
8.0
Diabetes, uncomplicated, [n (%)]
1948 (19.0)
5 (0.8)
2101 (20.5)
1.5
6 (1.0)
0.2
2300 (22.5)
3.5
8 (1.3)
0.5
Depression, [n (%)]
1783 (17.4)
69 (11.0)
2050 (20.0)
2.6
86 (13.7)
2.7
2530 (24.7)
7.3
119 (18.9)
7.9
Chronic pulmonary disease, [n (%)]
1679 (16.4)
52 (8.3)
1848 (18.1)
1.7
56 (9.0)
0.6
2214 (21.6)
5.2
67 (10.7)
2.4
Diabetes, complicated, [n (%)]
1405 (13.7)
4 (0.6)
1603 (15.7)
2.0
1 (0.2)
− 0.4
1801 (17.6)
3.9
2 (0.3)
− 0.3
Hypothyroidism, [n (%)]
1263 (12.4)
18 (2.9)
1347 (13.2)
0.9
22 (3.5)
0.6
1544 (15.1)
2.8
24 (3.8)
0.9
Cardiac arrhythmias, [n (%)]
788 (7.7)
6 (1.0)
900 (8.8)
1.1
10 (1.6)
0.6
1187 (11.6)
3.9
15 (2.4)
1.4
Renal failure, [n (%)]
602 (5.9)
1 (0.2)
744 (7.3)
1.4
2 (0.3)
0.1
907 (8.9)
3.0
2 (0.3)
0.1
Hypertension, complicated, [n (%)]
588 (5.7)
1 (0.2)
741 (7.2)
1.5
2 (0.3)
0.1
964 (9.4)
3.7
4 (0.6)
0.4
Fluid and electrolyte disorders, [n (%)]
570 (5.6)
5 (0.8)
737 (7.2)
1.6
10 (1.6)
0.8
1052 (10.3)
4.7
13 (2.1)
1.3
Peripheral vascular disorders, [n (%)]
637 (6.2)
1 (0.2)
726 (7.1)
0.9
2 (0.3)
0.1
936 (9.1)
2.9
2 (0.3)
0.1
Rheumatoid arthritis/collagen vascular disease, [n (%)]
558 (5.5)
5 (0.8)
619 (6.1)
0.6
6 (1.0)
0.2
755 (7.4)
1.9
10 (1.6)
0.8
Congestive HF, [n (%)]
424 (4.1)
1 (0.2)
534 (5.2)
1.1
1 (0.2)
0
679 (6.6)
2.5
2 (0.3)
0.1
Solid tumor without metastasis, [n (%)]
424 (4.1)
2 (0.3)
490 (4.8)
0.7
3 (0.5)
0.2
604 (5.9)
1.8
3 (0.5)
0.2
Liver disease, [n (%)]
390 (3.8)
3 (0.5)
435 (4.3)
0.5
1 (0.2)
− 0.3
616 (6.0)
2.2
6 (1.0)
0.5
Valvular disease, [n (%)]
348 (3.4)
4 (0.6)
409 (4.0)
0.6
3 (0.5)
− 0.1
563 (5.5)
2.1
5 (0.8)
0.2
Other neurological disorders, [n (%)]
328 (3.2)
4 (0.6)
375 (3.7)
0.5
3 (0.5)
− 0.1
491 (4.8)
1.6
3 (0.5)
− 0.1
Drug abuse, [n (%)]
328 (3.2)
8 (1.3)
363 (3.6)
0.3
7 (1.1)
− 0.2
491 (4.8)
1.6
16 (2.5)
1.2
ECI Elixhauser Comorbidity Index, HF heart failure, N number of patients in group, n number of patients with outcome, SD standard deviation
The updated table should now be displayed as:
Elixhauser comorbidities in incident adult and adolescent HS patients
1-year pre-index
1-year post-index
2-years post-index
Adults (N = 10,230)
Adolescents (N = 628)
Adults (N = 10,230)
Change vs 1-year pre-index (%)
Adolescents (N = 628)
Change vs 1-year pre-index (%)
Adults (N = 10,230)
Change vs 1-year pre-index (%)
Adolescents (N = 628)
Change vs 1-year pre-index (%)
ECI, mean (SD)
1.6 (6.1)
− 0.3 (2.5)
1.8 (6.8)
–
− 0.5 (3.2)
–
2.6 (8.2)
–
− 0.6 (4.2)
–
Hypertension, uncomplicated, [n (%)]
4014 (39.2)
9 (1.4)
4353 (42.6)
3.4
13 (2.1)
0.7
4790 (46.8)
7.6
17 (2.7)
1.3
Obesity, [n (%)]
2518 (24.6)
74 (11.8)
3072 (30.0)
5.4
112 (17.8)
6.0
3888 (38.0)
13.4
157 (25)
13.2
Diabetes, uncomplicated, [n (%)]
2021 (19.8)
8 (1.3)
2190 (21.4)
1.6
7 (1.1)
− 0.2
2469 (24.1)
4.3
12 (1.9)
0.6
Depression, [n (%)]
1903 (18.6)
79 (12.6)
2220 (21.7)
3.1
91 (14.5)
1.9
2847 (27.8)
9.2
130 (20.7)
8.1
Chronic pulmonary disease, [n (%)]
1906 (18.6)
64 (10.2)
2075 (20.3)
1.7
70 (11.2)
1.0
2621 (25.6)
7.0
95 (15.1)
4.9
Diabetes, complicated, [n (%)]
1442 (14.1)
4 (0.6)
1683 (16.5)
2.4
1 (0.2)
− 0.4
1934 (18.9)
4.8
2 (0.3)
− 0.3
Hypothyroidism, [n (%)]
1344 (13.1)
22 (3.5)
1467 (14.3)
1.2
26 (4.1)
0.6
1732 (16.9)
3.8
28 (4.5)
1.0
Cardiac arrhythmias, [n (%)]
942 (9.2)
13 (2.1)
1098 (10.7)
1.5
14 (2.2)
0.1
1522 (14.9)
5.7
24 (3.8)
1.7
Renal failure, [n (%)]


Comments (0)