
Remember me
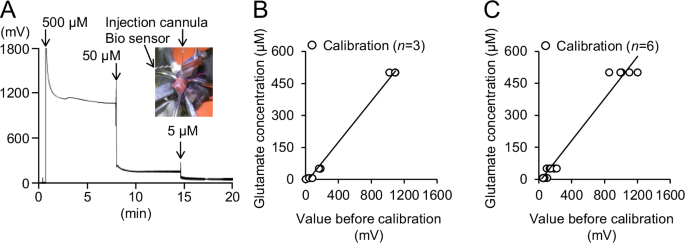
A biosensor was used to record the extracellular glutamate levels in real-time [15]. To prepare a calibration curve, glutamate solutions were prepared at varying concentrations and recorded by the biosensor (Fig. 1A). By modifying a previously published method, the voltage level of the extracellular glutamate was translated into concentration [15]. The pre-calibration titration lines allowed for the accurate conversion of voltage levels into glutamate concentrations [y (µM) = 0.4804x (mV) –17.173 (mV) and y (µM) = 0.0492x (mV) – 15.023 (mV), R2 = 0.9939, n = 3 and R2 = 0.9771, n = 6 respectively; Fig. 1B, C].
A TRPM8 agonist, WS-3, decreases glutamate levels and ED powerA previous study with focal onset seizure model mice demonstrated that WS-3 suppressed drug-induced EDs, while TRPM8 deficiency exacerbated them [5]. Since TRPM8 channels are expressed in inhibitory GABAergic neurons [13], TRPM8 agonists are expected to regulate neuronal excitability. In this study, we investigated the extent to which TRPM8 agonist efficacy correlates with PG-induced changes in extracellular glutamate levels and EDs.
We only compared the effects of WS-3 on PG-induced changes in glutamate levels and EDs between WT and TRPM8-KO mice because we found that DMSO did not affect these parameters (Fig. S2). The seizure inducer increased glutamate levels, ECoG amplitude, beta-band amplitude, and ED power (Fig. 2A). WS-3 decreased glutamate levels, ED power, and beta-band amplitude in WT mice, while no anti-seizure effects were observed in TRPM8-KO mice (Fig. 2A). Magnified traces (yellow columns) highlight the effects of WS-3 on ED power (Fig. 2B).
Fig. 2: Representative effects of WS-3, the TRPM8 agonist, on extracellular glutamate levels and beta-band power in WT and TRPM8-KO mice after the seizure inducer injection.
A Representative changes in glutamate levels, ECoG amplitudes, Beta-band amplitudes, and beta-band power in wild-type (WT) and TRPM8 knockout (TRPM8-KO) mice. B Traces are highlighted by yellow columns. ECoGs at 20 s and 1 s show representative beta-band amplitudes before and after TRPM8 agonist injection in each group. ECoG, electrocorticogram; PG, penicillin G potassium (seizure inducer); TRPM8, transient receptor potential melastatin 8; TRPM8-KO, TRPM8 homozygous knockout; WT, wild type.
Heart rate data indicated no significant difference in the depth of anesthesia between the groups (n = 5 per group; 609.72 ± 18.21 vs. 646.20 ± 16.00, for the PG + WS-3 in WT and TRPM8-KO mice groups, respectively; p = 0.1714; Fig. 3A). To determine the effects of the TRPM8 agonist on glutamate levels and ED power, extracellular glutamate levels and the power of the beta-band in the EDs were evaluated for the WT and TRPM8-KO mice (Fig. 3B–K). The transitions in glutamate levels and ED power every 5 min differed between the WT and TRPM8-KO mice (Fig. 3B, C). The glutamate levels before PG injection were not different between WT and TRPM8-KO mice (0-5 min, p = 0.0653 and 5–10 min, p = 0.1045, respectively, Student’ t-test; Fig. 3B). In WT mice, the latency to reach maximum glutamate levels was 8.38 ± 1.71 min (Fig. 3D), which subsequently induced the development of EDs (25.72 ± 1.84 min, p < 0.0001, paired t-test; Fig. 3E). The area under the curve until the first ED was 1.36 ± 0.17 mM/min (Fig. 3F). Glutamate levels and ED power increased 10 and 60 minutes after PG injection, respectively, in WT mice, while WS-3 significantly decreased both parameters by 44% and 60%, respectively (Glutamate levels: pre-PG: 27.56 ± 5.51 µM, post-PG: 74.65 ± 7.43 µM, p = 0.0049, and pre-injection: 10.97 ± 2.16 µM, post-injection: 5.03 ± 1.60 µM, p = 0.0028, paired t-test; beta-band power: basal: 0.0396 ± 0.0151 nV2, pre-injection: 0.762 ± 0.145 nV2, post-injection: 0.304 ± 0.083 nV2, p = 0.0095 and p = 0.0313, respectively, paired t-test; Fig. 3G, H). These effects were absent in TRPM8-KO mice (Glutamate levels: pre-injection: 23.15 ± 5.16 µM, post-injection: 19.85 ± 3.69 µM, p = 0.2582; beta-band power: pre-injection: 1.87 ± 0.30 nV², post-injection: 2.09 ± 0.34 nV², p = 0.5248, paired t-test; Fig. 3G, H). Data from both groups showed that higher peak glutamate levels were associated with shorter latencies to ED development (r = −0.895, R2 = 0.800, p < 0.001, 95% confidence interval, CI: −0.975, −0.606, Pearson’s correlation coefficients; Fig. 3I). Furthermore, higher peak glutamate levels were correlated with increased ED power, and the effects of WS-3 on glutamate levels and ED power were positively correlated (R2 = 0.6001 and 0.7587, respectively; Fig. 3J, K).
Fig. 3: WS-3, the TRPM8 agonist, decreased extracellular glutamate levels and beta-band power in WT mice after the seizure inducer injection; however, WS-3 did not decrease in TRPM8-KO mice.
A Average heart rate in each group. B Glutamate level transitions averaged every 5 min; n = 5 for each group. Gray columns indicated each evaluation time zone (pre-PG: 5–10 min, post-PG: 15–20 min, per-WS-3: 65–70 min, and post-WS-3: 75–80 min). C Beta-band power transitions averaged every 5 min; n = 5 for each group. Gray columns indicated each evaluation time zone (basal: 5–10 min, per-WS-3: 65–70 min, and post-WS-3: 75–80 min). D Time taken to reach peak glutamate levels. E Latency to the first ED. F Area under the glutamate concentration-time curve, until the first ED. G Glutamate levels for each gray column in B, before and after the seizure inducer and TRPM8 agonist injections (pre-PG: 5–10 min, post-PG: 15–20 min, per-WS-3: 65–70 min, and post-WS-3: 75–80 min). H Beta-band power for each gray column in C: basal activity before and after WS-3, a TRPM8 agonist, injection (basal: 5–10 min, per-WS-3: 65–70 min, and post-WS-3: 75–80 min). Correlation between I peak glutamate levels and latency to the 1st ED (R 2 = 0.800), J peak glutamate levels and beta-band power, at 55–60 min after the seizure inducer injection (R2 = 0.600), and (K) efficacy of the TRPM8 agonist on glutamate levels and beta-band power (R2 = 0.759). In the period, the glutamate level and beta-band power were decreased by WS-3 administrated in WT mice (B-C). Correlation between efficacy of the TRPM8 agonist on glutamate levels and beta-band power during (L) 0-5 and (M) 15–20 min after the end of WS-3 administration (R2 = 0.00289 and R2 = 0.000372, respectively). In each period, only the glutamate level was decreased by WS-3 administrated in TRPM8-KO mice (B, C). Opened blue circles and orange triangles indicate (A, D–M) raw data or (B, C) mean in each group. Data in (A–H) are presented as mean ± SEM (n = 5 mice per group). *p < 0.05 and ***p < 0.001, Student’s t-test. †p < 0.05, ††p < 0.01 and †††p < 0.001, paired t-test. ECoG, electrocorticogram; EDs, epileptiform discharges; PG, penicillin G potassium (seizure inducer); TRPM8, transient receptor potential melastatin 8; TRPM8-KO, TRPM8 homozygous knockout; WT, wild type.
TRPM8 deficiency causes glutamate levels and ED power to increase furtherSince TRPM8 agonists activate GABAergic neurons [13], and TRPM8 deficiency has been shown to exacerbate EDs [5], we hypothesized that TRPM8 deficiency would further elevate glutamate levels following seizure induction. To confirm this, we compared extracellular glutamate levels and ED power between WT and TRPM8-KO mice. TRPM8 deficiency did not significantly affect the time required to reach maximum glutamate levels (7.72 ± 1.02 min, p = 0.752; Fig. 3D). However, TRPM8-deficient mice developed EDs with fewer glutamate exposures, leading to shorter latencies to ED development (0.38 ± 0.11 mM/min, p = 0.0011; 5.00 ± 1.00 min, p < 0.0010, respectively; Fig. 3E-F). Additionally, TRPM8 deficiency significantly increased glutamate levels 5–10 min post-injection (139.84 ± 5.57 µM, p < 0.0001) and ED power 55–60 min post-injection (1.87 ± 0.30 nV2, p = 0.0163) compared to WT mice (Fig. 3G, H). In TRPM8-KO mice, the reductions of WS-3 on glutamate levels were observed at 5 and 20 min after the reduction in WT mice (80–85 min: 13.16 ± 3.04 µM, p = 0.0261, and 95–100 min: 8.60 ± 2.34 µM, p = 0.0308, respectively, paired t-test, vs 65–70 min: 23.15 ± 5.16 µM; Fig. 3B). In contrast, beta-band power was not changed by WS-3 during 0-5 and 15-20 min after the end of WS-3 administration in TRPM8-KO mice (Beta-band power: pre-injection: 1.87 ± 0.30 nV², 80–85 min: 2.21 ± 0.269 nV², 95–100 min: 2.93 ± 0.468 nV², p = 0.3389 and p = 0.1269 vs pre-injection, respectively, paired t-test; Fig. 3C). During the two periods, the efficacy of WS-3 on glutamate levels and ED power was not positively correlated (r = −0.0537, R2 = 0.00289, p = 0.883, 95% confidence interval, CI: −0.661, −0.596; and R2 = 0.000372, p = 0.958, 95% confidence interval, CI: −0.618, −0.641, respectively, Pearson’s correlation coefficients; Fig. 3L-M).
TRPM8 agonist pre-injection reduces an increase in glutamate levels and the development of EDs and ESsTRPM8 agonists have been shown to reduce ED power and seizure severity [5]. The efficacies of the TRPM8 agonist on EDs and glutamate levels were positively correlated (Fig. 3K). This suggests that TRPM8 agonists reduce glutamate level increases following seizure induction and subsequently suppress the development of EDs and seizure severity. In the second half of the study, we investigated the preventive effects of WS-3 on glutamate levels, ED development, and seizure severity. We compared the WT/DMSO + PG, WT/WS-3 + PG, TRPM8-KO/DMSO + PG, and TRPM8-KO/WS-3 + PG groups. To evaluate the preventive effects of WS-3, the TRPM8 agonist was injected 30 min before PG administration in the same somatosensory cortex location. All 18 mice were recorded for electroencephalograms, glutamate levels, and seizures (WT/DMSO + PG, n = 5; WT/WS-3 + PG, n = 5; TRPM8-KO/DMSO + PG, n = 4; TRPM8-KO/WS-3 + PG, n = 4).
Representative changes in glutamate levels and ED power for each group are shown in Fig. 4A–D. Magnified EDs showed that pre-injection of WS-3 in WT mice reduced ED development following PG injection, while this effect was not observed in TRPM8-KO mice (Fig. 4E, F).
Fig. 4: Representative effects of WS-3, the TRPM8 agonist on extracellular glutamate levels, beta-band power, and seizure severity in WT and TRPM8-KO mice before the seizure inducer injection.
A–D Representative changes in glutamate levels, ED amplitudes, and beta-band power in the WT and TRPM8-KO mice. E, F Magnified traces from (A, B) are indicated by the yellow columns. ECoGs at 20 s and 1 s showing beta-band amplitudes during the last 5 min. DMSO, dimethyl sulfoxide; ECoG, electrocorticogram; PG, penicillin G potassium (seizure inducer); TRPM8, transient receptor potential melastatin 8; TRPM8-KO, TRPM8 homozygous knockout; WT, wild type. PG.
Heart rate data confirmed no significant differences in the depth of anesthesia between the groups (496.82 ± 25.21, 492.88 ± 20.32, 480.50 ± 23.31, and 511.31 ± 24.71, respectively, p > 0.7708, Tukey’s test; Fig. 5A). The transitions in glutamate levels and ED power every 5 min differed between the WT and TRPM8-KO mice (Fig. 5B, C). The glutamate levels before DMSO, WS-3, or PG injection did not differ between WT and TRPM8-KO mice (0–5 min, p ≥ 0.1848 and 25–30 min, p ≥ 0.4379, respectively, Tukey’s test; Fig. 5B). Pre-injection of WS-3 in WT mice resulted in a smaller increase in the glutamate levels and a reduction in EDs and maximum seizure scores (47.80 ± 7.21 µM vs. 11.97 ± 3.03 µM, p = 0.0469, Tukey’s test; 0.445 ± 0.078 nV2 vs. 0.121 ± 0.049 nV2, p = 0.0029, Tukey’s test; 4.00 ± 0.00 vs. 1.20 ± 0.490, p = 0.0329, Steel-Dwass test after Kruskal-Wallis test, respectively; Fig. 5D, F). In contrast, WS-3 had no significant effect in TRPM8-KO mice (97.21 ± 16.78 µM vs. 91.74 ± 7.01 µM, p = 0.9772, Tukey’s test; 0.829 ± 0.077 nV2 vs. 0.739 ± 0.097 nV2, p = 0.7326, Tukey’s test; 5.50 ± 0.58 vs. 5.25 ± 0.50, p = 0.9562, Steel-Dwass test after Kruskal-Wallis test, respectively; Fig. 5D, F). In both groups, higher peak glutamate levels were associated with higher ED power and seizure scores (R2 = 0.754, p < 0.001, 95% CI: 0.675, 0.950, Pearson’s correlation coefficients and ρ = 0.905, p < 0.001, Spearman’s correlation coefficients, respectively; Fig. 5G, H). In addition, a higher ED power correlated with a higher seizure score (ρ = 0.908, p < 0.001, Spearman’s correlation coefficients; Fig. 5I).
Fig. 5: Preventive administration of WS-3, the TRPM8 agonist, reduced the elevation of extracellular glutamate levels, beta-band power, and seizure severity in WT mice after the seizure inducer injection; however, WS-3 did not decrease in TRPM8-KO mice.
A Average heart rate in each group. Transitions in (B) glutamate levels and (C) beta-band power were averaged every 5 min. B, C Gray columns indicated each evaluation time zone (B; pre-PG: 35–40 min, post-PG: 55–60 min and C; pre-PG: 35–40 min, post-PG: 95–100 min). D Glutamate levels in each gray column in B: 5 min before and 15–20 min after the seizure inducer injection. E Beta-band power 5 min before the seizure-inducer injection and during the last 5-min period. F Maximum seizure score during the 60 min after the end of inhalation anesthesia. Correlation between (G) peak glutamate levels and beta-band power (R2 = 0.754), H peak glutamate levels and maximum seizure score (ρ = 0.905), and (I) logarithmic value of beta-band power during the last 5 min of anesthesia and the maximum seizure score (ρ = 0.908). Opened black or blue circles and green or orange triangles indicate (B, C) mean or (F–I) raw data in each group. Data in (A–F) are presented as the mean ± SEM, n = 5 WT mice and n = 4 TRPM8-KO mice. *p < 0.05, **p < 0.01, and ***p < 0.001, Tukey’s test. †p < 0.05 and †††p < 0.001, paired t-test. ‡p < 0.05, Steel-Dwass test after Kruskal-Wallis test. DMSO, dimethyl sulfoxide; EDs, epileptiform discharges; PG, penicillin G potassium; TRPM8, transient receptor potential melastatin 8; TRPM8-KO, TRPM8 homozygous knockout; WT, wild-type.
TRPM8 deficiency increases glutamate levels and exacerbates seizure eventsTRPM8 deficiency has been shown to exacerbate EDs and ESs [5] and to further elevate glutamate levels following seizure induction (Fig. 3G). These findings suggest that TRPM8 deficiency increases the severity of epileptic events by more easily elevating extracellular glutamate levels. To confirm this, we compared extracellular glutamate levels, ED power, and seizure severity between WT and TRPM8-KO mice. TRPM8 deficiency significantly increased glutamate levels, ED power, and seizure severity after PG injection (DMSO + PG / WT vs DMSO + PG / TRPM8-KO group, p = 0.0089, Tukey’s test; p = 0.0030, Tukey’s test; p = 0.0492, Steel-Dwass test after Kruskal-Wallis test, respectively; Fig. 5D-F). These results suggest that TRPM8 deficiency facilitates the development of EDs and more severe seizure events by elevating glutamate levels.
Comments (0)