
Remember me
Studies were conducted in both males and females to identify sex differences. Occasional sex differences were observed, frequently without systematic patterns. All such instances are described.
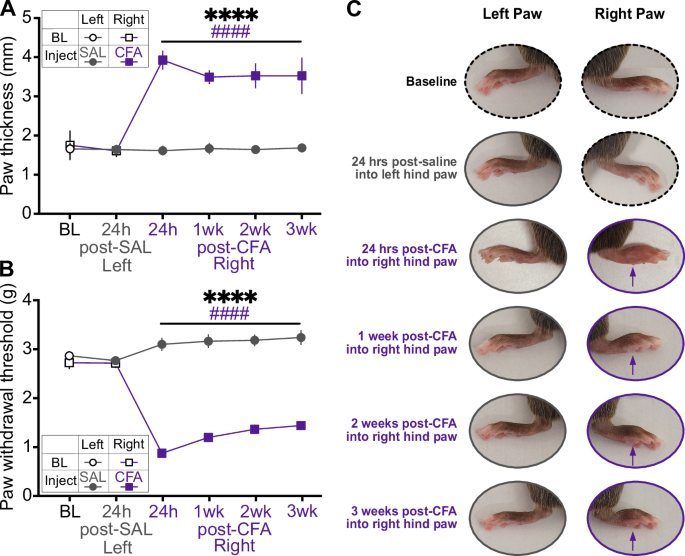
CFA induces persistent swelling and mechanical hypersensitivityWe first confirmed that within-subjects comparisons between saline injection into the left hindpaw and CFA injection into the right hindpaw resulted in acute and persistent CFA-specific inflammation (Fig. 1). Hindpaw thickness and mechanical hypersensitivity (allodynia) were measured at baseline, 24 h after saline injection into the left hindpaw, 24 h after CFA injection into the right hindpaw, and weekly for 3 weeks after. While there were no differences between hindpaws at baseline or after saline injection, CFA induced dramatic swelling that persisted for three weeks (Fig. 1A, C). Similarly, CFA reduced the force required for hindpaw withdrawal, an effect that also lasted for three weeks (Fig. 1B, C). These results confirm our previous findings describing the rapid onset and long persistence of CFA-induced inflammatory pain, and indicate our actigraphy and physiological recordings covered periods of inflammation and associated mechanical sensivity [28].
Fig. 1: Indicators of the inflammatory effect of CFA compared to baseline, 24 h after saline injection, and 24 h, 1 week, 2 weeks, and 3 weeks after CFA injection.
A Hindpaw swelling, measured as increased thickness in mm with a digital caliper (Time x Paw interaction: F(5,55) = 122.8, p < 0.0001; Sidak’s post hoc tests assessing between-groups differences in paw thickness at 24 h post-CFA: p < 0.0001). B Mechanical hypersensitivity, measured by reduced force required in grams for paw withdrawal (Time x Paw interaction: F(5,55) = 49.75, p < 0.0001; between-groups comparisons, p < 0.0001). C Representative images of each paw in a single mouse. Purple arrows indicate CFA-induced inflammation. *indicates a significant main effect of time (****p < 0.0001). #indicates a significant difference from baseline value (####p < 0.0001).
CFA-induced inflammatory pain does not alter circadian rhythmsWe next assessed whether CFA injection affects circadian rhythms via locomotor activity, which was recorded using passive infrared sensor wireless nodes for 7 days of baseline, 7 days after saline injection, and 7 days after CFA injection (Fig. 2A). Relative to baseline, both saline and CFA reduced percent variance, an indirect measure of daily phase stability, indicating less repetitive and more unstable patterns on a daily basis (Fig. 2B). Neither saline nor CFA altered relative amplitude, which is the ratio of the most active 10 h to the least active 5 h (Fig. 2C), with greater relative amplitude indicating a robust 24-h rest-activity (circadian) rhythm. CFA reduced intra-daily variability, a measure of 24-h rhythm fragmentation, from baseline, though this effect did not differ significantly from saline (Fig. 2D). This measure reflects how often activity transitions between high and low levels, and our findings indicate CFA resulted in longer periods of rest and activity, potentially due to brief bouts of sleep during the active phase or deconsolidated sleep. For some mice, both saline and CFA significantly reduced the circadian period—time difference between two peaks or troughs of locomotor activity—from an approximate 24-h baseline (Fig. 2E), suggesting a non-specific effect of the injections themselves. Surprisingly, saline, but not CFA, reduced the difference between the highest point of locomotor activity and the mean activity of the rhythm as calculated by FFT amplitude, indicating less variation in locomotor activity across the circadian period (Fig. 2F). Collectively, these findings suggest that CFA did not have robust or consistent effects on circadian rhythms.
Fig. 2: Actigraphy-based quantification of circadian locomotor activity in light-dark and dark-dark cycles.
A Mice were individually housed in cages equipped with passive infrared sensor wireless nodes. Daily locomotor activity was recorded for 7 days of baseline, 7 days after saline injection, and 7 days after CFA injection. As percent of average baseline (dotted line at 100%), B percent variance (between-groups comparisons: t10 = 0.08684, p = 0.9325; within-group comparisons to 100% baseline SAL: t10 = 3.420, p = 0.0066; within-group CFA: t10 = 2.595, p = 0.0267), C relative amplitude (between-groups Wilcoxon for non-normal distributions: p = 0.1016), D intradaily variability (between-groups: t10 = 2.094, p = 0.0627; within-group CFA: t10 = 3.009, p = 0.0131), E period (between-groups Wilcoxon: p = 0.9658; within-group SAL: p = 0.0010; within-group CFA: p = 0.0010), and F FFT amplitude (between-groups: t10 = 1.231, p = 0.2466; within-group SAL: t10 = 3.436, p = 0.0064; within-group CFA: t10 = 0.07744, p = 0.9398) under 12 h light and 12 h dark cycling conditions. As percent of average baseline, G percent variance (between-groups: t11 = 1.404, p = 0.1878), H relative amplitude (between-groups: t11 = 2.035, p = 0.0667; within-group SAL: t11 = 2.510, p = 0.0290; within-group CFA: t11 = 2.954, p = 0.0131), I intradaily variability (between-groups: t11 = 1.995, p = 0.0715), J period (between-groups Wilcoxon: p = 0.7695, within-group SAL: p = 0.0005; within-group CFA: p = 0.0005), and K FFT amplitude (between-groups: t11 = 1.844, p = 0.0923) under 24 h constant dark conditions. Teal squares indicate males and magenta circles indicate females. Ns indicates not significant. #indicates significant difference from theoretical baseline of 100% (#p < 0.05, ##p < 0.01, ###p < 0.001).
We then repeated the experiment using a constant darkness protocol to determine if effects of CFA on circadian rhythms might be masked by entrainment to the 12h-light/12h-dark cycle. In the dark-dark protocol, mice were tracked for 6 days of baseline under regular light-dark conditions before switching to constant dark conditions 24 h prior to saline injection. Neither saline nor CFA produced significant effects on percent variance (Fig. 2G), intra-daily variability (Fig. 2I), or FFT amplitude (Fig. 2K). Both saline and CFA increased relative amplitude (Fig. 2H) and significantly decreased the period (Fig. 2J). When considered altogether, these findings indicate that CFA did not dramatically alter circadian rhythms during the 2 weeks of inflammatory pain, regardless of the light cycle.
CFA-induced inflammatory pain increases sleep duration and decreases wake bout lengthAlthough CFA did not reliably impact circadian rhythm, some of the metrics suggested it may alter sleep quality. To assess this possibility, we examined whether CFA affects sleep quality using an automated piezoelectric sleep monitoring system to detect breathing and gross body movements, which can be used to estimate sleep and wake patterns. Mouse activity was recorded for 2 days of baseline, 7 days after saline injection, and 14 days after CFA injection in standard light-dark conditions (Fig. 3A). In the first 24 h after injection, saline and CFA both increased sleep duration in the light phase (hours 1–12 after the injection) relative to baseline (Fig. 3B). While saline caused nominal (non-significant) increases in sleep bout length in the light phase, CFA significant reduced it (Fig. 3C). Wake bout length in the light phase was also reduced by both saline and CFA, with the effect being more pronounced following CFA (Fig. 3D). In the dark phase (hours 13–24 after the injection), both saline and CFA again significantly increased sleep duration, the increase was significantly greater with CFA (Fig. 3E). In contrast to effects seen during the light phase, CFA increased sleep bout length in the dark phase (Fig. 3F). As in the light phase, wake bout length in the dark phase was also reduced by both saline and CFA, and more robustly by CFA (Fig. 3G).
Fig. 3: Actigraphy-based quantification of sleep and wake states.
A Mice were individually housed in cages on automated piezoelectric sleep monitoring systems. Sleep and wake behavior were recorded for 2 days of baseline, 7 days after saline injection, and 7 days after CFA injection. Data presented here is for the first 24 h after each injection. As percent of average baseline (dotted line at 100%), B sleep duration (between-groups: t15 = 1.629, p = 0.1242; within-group SAL: t15 = 5.192, p < 0.0001; within-group CFA: t15 = 2.592, p = 0.0204), C sleep bout length (between-groups Wilcoxon: p = 0.0013; within-group SAL: p = 0.3225; within-group CFA: p = 0.0027), and D wake bout length (between-groups Wilcoxon: p = 0.0042; within-group SAL: p = 0.0155; within-group CFA: p < 0.0001) during lights-on. As percent of average baseline E sleep duration (between-groups Wilcoxon: p = 0.0027; within-group SAL: p < 0.0004; within-group CFA: p < 0.0001), F sleep bout length (between-groups: t15 = 0.1013, p = 0.9207; within-group SAL: t15 = 4.1071, p = 0.0010; within-group CFA: t15 = 3.652, p = 0.0024), and G wake bout length (between-groups: t15 = 5.745, p < 0.0001; within-group SAL: t15 = 4.485, p = 0.004; within-group CFA: t15 = 15.34, p < 0.0001) during lights-off. Teal squares indicate males and magenta circles indicate females. Ns indicates not significant. #indicates significant difference from theoretical baseline of 100% (#p < 0.05, ##p < 0.01, ###p < 0.001, ####p < 0.0001). *indicate significant group differences (*p < 0.05, **p < 0.01, ***p < 0.001).
While sleep duration in the light phase remained consistently elevated for both males and females across two weeks (Fig. S2A), sleep bout length increased over this time (Fig. S2B). Light-phase wake bout length increased over two weeks but remained below baseline (Fig. S2C). In the dark phase, sleep duration was elevated most for females in the first week after CFA injection, returning close to baseline during the second week (Fig. S2D). Dark-phase sleep duration was elevated more for females than males in the first week after injection, but both sexes recovered close to baseline in the second week (Fig. S2E). Wake bout length rose steadily, with males showing recovery sooner, but did not go back to baseline for either sex even in the second week (Fig. S2F). When considered altogether, these findings indicate that CFA increased sleep duration and reduced wake bout length. While saline alone also affected some parameters of circadian rhythmicity and sleep-wake behavior, this is most likely a transient effect of restraint, injection, and fluid being injected into and briefly distending the hindpaw. Considering that there was no lasting effect of saline injection on hindpaw size or allodynia during the recording period, the significant differences between the saline injection and the CFA injection a week later indicate a specific effect of inflammatory pain.
CFA-induced inflammatory pain promotes increased but fragmented REM and SWSTo more comprehensively characterize the effect of CFA on sleep, we investigated whether the increased sleep was attributable to REM, SWS, or both using wireless telemetry transmitters to enable untethered and continuous recording of EEG, EMG, locomotor activity, and subcutaneous temperature (Fig. 4A). EEG and EMG were recorded for 7 days of baseline, 7 days after isoflurane exposure (to control for the anesthesia required to inject transmitter-implanted mice), 7 days after saline injection, and 21 days after CFA injection. In separate cohorts of mice, injections occurred either at the onset of the light phase or the onset of the dark phase, to enable assessment of potential contributions of testing during periods when the mice are normally more or less likely to be active. Because these studies required brief ISO anesthesia to perform the hindpaw injections without risking damage to the subcutaneous EEG/EMG leads, comparisons include an ISO alone condition.
Fig. 4: EEG- and EMG-based quantification of sleep telemetry after CFA injection during lights-on.
A Mice were implanted with wireless telemetry transmitters. EEG and EMG were recorded for 7 days of baseline, 7 days after isoflurane exposure, 7 days after saline injection, and 21 days after CFA injection. Data presented here is for the first 24 h after each injection. Mice were injected at the beginning of the light phase. As percent of average baseline (dotted line at 100%), B REM duration (F(1.986,19.86) = 0.02847, p = 0.9714), C REM bout number (F(1.427,14.27) = 0.745, p = 0.4489), D SWS duration (F(1.390,13.90) = 4.341, p = 0.0457; secondary analysis of sexes individually: Time x Sex interaction: F(2,18) = 6.197, p = 0.0090; Female ISO vs. CFA: p = 0.0133; SAL vs. CFA: p = 0.0302), and E SWS bout number (F(1.960,19.60) = 0.8844, p = 0.4269) during lights-on. F Summary radar plot indicating direction of change between saline and CFA for lights-on. As percent of average baseline, G REM duration (F(1.446,13.01) = 10.72, p = 0.0032, ISO vs. CFA p = 0.0224, SAL vs. CFA p = 0.0115; within-group CFA: t9 = 3.462, p = 0.0071), H REM bout number (F(1.716,17.16) = 6.088, p = 0.0126, SAL vs. CFA p = 0.0092; within-group ISO: t10 = 2.740, p = 0.0208; within-group CFA: t10 = 3.455, p = 0.0062; secondary analysis of sexes individually: main effect of Time: F(1.489,13.40) = 6.893, p = 0.0130; Male SAL vs. CFA p = 0.0443), I SWS duration (F(1.976,28.66) = 8.823, p = 0.0011, ISO vs. CFA p = 0.0112, SAL vs. CFA p = 0.0170; within-group SAL: t10 = 3.188, p = 0.0097; within-group CFA: t10 = 6.548, p < 0.0001), and J SWS bout number (Friedman test F = 6.545, p = 0.0435, SAL vs. CFA p = 0.0315; within-group Wilcoxon CFA: p = 0.0010) during lights-off. K Summary radar plot indicating direction of change between saline and CFA for lights-off. Teal squares indicate males and magenta circles indicate females. Ns indicates not significant. #indicates significant difference from theoretical baseline of 100% (#p < 0.05, ##p < 0.01, ####p < 0.0001). *indicate significant group differences (*p < 0.05, **p < 0.01).
Initial analyses focused on the 24 h after CFA injection was given at the beginning of the light phase (when mice are less likely to be active). First, we confirmed that CFA reduces active wake (AW) duration during the light phase when sexes were pooled. Secondary analyses of the sexes individually revealed significant effects of CFA on AW duration in females (Fig. S3A). The AW bouts were unaffected by CFA (Fig. S3B). CFA significantly decreased locomotor activity compared to baseline (Fig. S3C).
During the dark phase of this regimen, CFA had a more pronounced effect, significantly decreasing AW duration when sexes were pooled with secondary analyses of the sexes individually revealed significant effects of CFA on AW duration specifically in males (Fig. S3D). Similarly, CFA also significantly reduced AW dark phase bouts when sexes were pooled with secondary analyses indicated AW bouts were reduced specifically in males (Fig. S3E). CFA reduced locomotor activity when sexes were pooled, but secondary analyses indicated this effect was significant in females only (Fig. S3F).
Next, we assessed if the reduction in wake duration is due to changes in REM and/or SWS. During the light phase, CFA had no effect on REM duration or bouts (Fig. 4B, C). Although CFA appeared to alter SWS duration when sexes were pooled, post hoc analyses indicated that none of the individual comparisons reached significance. Secondary analyses of the sexes individually revealed significant effects SWS duration in females only (Fig. 4D). There were no effects on SWS bouts (Fig. 4E). In summary, in the first 12 h after injection during the light phase, CFA increased REM duration, SWS duration, and wake bouts relative to saline (Fig. 4F).
During the dark phase, however, CFA increased both REM duration (Fig. 4G) and REM bouts (Fig. 4H). REM bouts were most increased for males (Fig. 4H). CFA also affected SWS during the dark phase. SWS duration (Fig. 4I) and bouts (Fig. 4J) were both significantly increased. Thus, when the dark phase begins 12 h after injections, CFA promoted both REM and SWS sleep while suppressing wake (Fig. 4K).
Next, we determined the time course of the dark-phase effects of CFA. Consistent with our piezosensor findings (Fig. 3), EEG and EMG recordings showed that CFA injection primarily affects sleep during the first three days post-injection (Fig. S4). Wake duration, wake bouts, and REM bouts were significantly dynamic across three weeks (Fig. S4A, S4E). When considered altogether, results from this experimental design (injections at the beginning of the light phase) indicate that CFA suppresses active wakefulness, with corresponding elevations in both REM and non-REM, or slow-wave, sleep, during the dark phase when animals are typically more active.
CFA-induced inflammatory pain promotes sleep most consistently in the dark phaseTo determine whether these changes are specific to the dark phase, or if CFA requires ~12 h to produce alterations in sleep, we repeated the experiment but instead performed the injections at the onset of the dark phase. In general, the pattern of effects during the dark phase specifically was similar regardless of whether testing began in darkness immediately after the injection or 12 h later. When the tests in darkness were conducted first, CFA caused immediate reductions in active wakefulness duration (Fig. S5A) and bouts (Fig. S5B). There were no significant changes in dark phase locomotor activity (Fig. S5C). During the light phase, CFA also significantly reduced AW duration (Fig. S5D) without significant effects on AW bouts or locomotor activity (Fig. S5E, F). When considered altogether, these findings show that CFA injection at the beginning of the dark phase reduced active wake duration 13 to 24 h later, during the light phase, and mice sleep even more during what is already their inactive phase. During the dark phase, however, when mice are typically more active, CFA significantly reduced active wake duration, bouts, and bout length regardless of when the injections occurred.
Next, we assessed whether the timing of CFA injections would differentially affect REM and SWS. REM duration during the dark phase was increased. Secondary analyses indicated CFA increased REM duration significantly for females (Fig. 5B). REM bouts were increased during the dark phase (Fig. 5C). Dark phase SWS, however, was affected more by CFA injection at the beginning of the dark phase: CFA increased SWS duration. Secondary analyses of the sexes individually revealed significant effects in females (Fig. 5D). SWS bouts in the dark phase were also increased by CFA (Fig. 5E). Thus, in the first 12 h of the dark phase immediately after injection, CFA promoted SWS and REM sleep while suppressing time spent awake (Fig. 5F). Considering that the pattern of results is similar regardless of when the dark phase occurs (compare Fig. 4K to Fig. 5F), these findings indicate the dark-phase effects seen with light-onset injections did not depend upon a 12-h pretreatment period.
Fig. 5: EEG- and EMG-based quantification of sleep telemetry after CFA injection during lights-off.
A Mice were implanted with wireless telemetry transmitters. EEG and EMG were recorded for 7 days of baseline, 7 days after isoflurane exposure, 7 days after saline injection, and 21 days after CFA injection. Data presented here is for the first 24 h after each injection. Mice were injected at the beginning of the dark phase. As percent of average baseline (dotted line at 100%), B REM duration (F(1.736,13.89) = 6.291, p = 0.0136, ISO vs. CFA p = 0.0313; within-group CFA: t8 = 3.466, p = 0.0085; secondary analysis of sexes individually: main effect of Time: F(1.558,10.91) = 8.791, p = 0.0075, main effect of Sex: F(1,7) = 6.058, p = 0.0434; Female ISO vs. CFA, p = 0.0245), C REM bout number (F(1.671,13.37) = 2.908, p = 0.0961; within-group ISO t8 = 2.429, p = 0.0413; within-group CFA t8 = 2.794, p = 0.0234), D SWS duration (F(1.571,12.57) = 15.37, p = 0.0007, ISO vs. CFA p = 0.0002, SAL vs. CFA p = 0.0127; within-group CFA: t8 = 9.234, p < 0.0001; secondary analysis of sexes individually: (Time F(1.402,9.816) = 13.83, p = 0.0025; Female ISO vs. CFA p = 0.0020), and E SWS bout (F(1.683,13.47) = 5.901, p = 0.0177, ISO vs. CFA p = 0.0305, SAL vs. CFA p = 0.0225; within-group CFA: t8 = 7.063, p = 0.0001) number during lights-off. F Summary radar plot indicating direction of change between saline and CFA for lights-off. As percent of average baseline, G REM duration (F(1.240,9.919) = 1.053, p = 0.3478), H REM bout number (F(1.826,14.61) = 0.259, p = 0.7555), I SWS duration (F(1.948,15.58) = 8.956, p = 0.0027, ISO vs. CFA p = 0.0062; within-group CFA: t8 = 4.117, p = 0.0034; main effect of Time F(1.928,13.50) = 8.119, p = 0.0051; Female ISO vs. CFA p = 0.0149), and J SWS bout number (F(1.619, 12.96) = 6.095, p = 0.0175, SAL vs. CFA p = 0.0193) during lights-on. K Summary radar plot indicating direction of change between saline and CFA for lights-on. Teal squares indicate males and magenta circles indicate females. Ns indicates not significant. #indicates significant difference from theoretical baseline of 100% (#p < 0.05, ##p < 0.01, ###p < 0.001, ####p < 0.0001). *indicate significant group differences (*p < 0.05, **p < 0.01, ***p < 0.001).
During the light phase, CFA did not affect REM duration or bouts (Fig. 5G, H). However, CFA increased SWS duration in the light phase, specifically for females (Fig. 5I). Slow wave sleep bouts in the light phase were also increased with CFA (Fig. 5J). Thus, CFA promoted SWS relative to saline in the light phase, 13 through 24 h after injection (Fig. 5K).
As seen when CFA injections were given during the light phase, EEG and EMG recordings showed that CFA injection given during the dark phase primarily affected sleep during the first two to three days post-injection (Fig. S6). However, CFA administered at the onset of the dark phase resulted in far more significant effects of sex, and time x sex interactions. Wake duration recovered to baseline sooner in females, while male wake duration stay suppressed for almost three weeks (Fig. S6A). In males, REM duration remained elevated for three weeks but closer to baseline after the first week, whereas in females, REM duration dropped and stayed below baseline (Fig. S6B). In females, SWS duration recovered sooner but dropped to below baseline, while males had sustained elevations in SWS duration for three weeks (Fig. S6C). Male wake bouts were persistently lower than in females (Fig. S6D). REM bouts were elevated for the first week after CFA injection but close to baseline without sex differences thereafter (Fig. S6E). Male SWS bouts remained elevated, while female SWS dropped below baseline (Fig. S6F).
Considered altogether, these findings indicate that regardless of whether the mice were injected at the beginning of lights-on (dark phase was 12 h later) or the beginning of lights-off (dark phase was immediate), CFA produced similar effects on sleep patterns during the dark phase. Specifically, CFA-induced inflammatory pain suppresses wakefulness while causing corresponding increases in both REM and SW sleep, primarily in the dark phase when mice are typically more active. In contrast, the effects seen during the light phase differed according to the amount of time after the injections. These findings suggest that the effects on sleep may be most detectable during periods when the mice are normally more likely to be awake, and less detectable during periods when they are normally more likely to be asleep.
CFA-inflammatory pain produces phase-dependent effects on body temperatureThe wireless transmitters also provide subcutaneous body temperature recordings. We hypothesized that CFA and the increased sleep it causes would also increase temperature. Surprisingly, CFA reduced body temperature during both lights-on, particularly for females (Fig. S7A) and lights-off (Fig. S7B). In contrast, CFA injected at dark phase onset significantly increased body temperature during both the dark phase (Fig. S7C) and light phase (Fig. S7D).
Considering that the changes in body temperature differ dramatically after light- and dark-phase CFA injections, our findings suggest that thermoregulation is differentially regulated depending on when inflammatory pain is induced.
Comments (0)