
Remember me
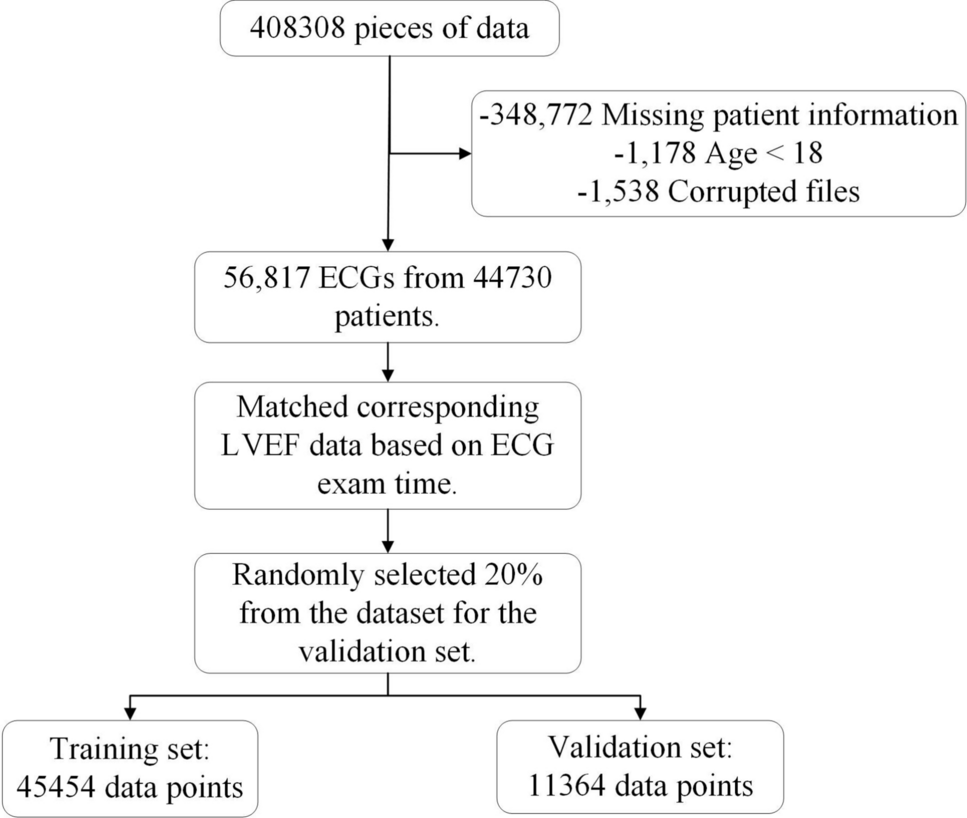


We use a lung CT dataset for COVID-19 screening, compiled from seven publicly available sources [16, 17, 33,34,35,36,37]. CT imaging, shown to outperform chest X-rays (CXR) in diagnostic accuracy [48], is recommended for initial assessments when feasible, considering capacity and radiation exposure [18].
Table 1 Dataset split for 3 labelsThe dataset categorizes CT slices into NonCOVID (normal), COVID (infected), and CAP (community-acquired pneumonia). After excluding 976 low-quality images, a total of 16,128 CT slices remain, which are divided into training and validation subsets (Table 1). To mitigate structural biases arising from various acquisition environments, the \(512\times 512\) CT images are resized to \(256\times 256\), and random zooming (\(1.2\times -1.5\times \)) is applied to generate augmented ground truth (GT) images. Since the original sinogram data used for reconstructing the CT data in this study was not available, sinogram data had to be obtained via forward projection from the CT dataset [12, 23]. When the acquired sinogram was reconstructed into CT images, it exhibited a high average similarity to the original CT images (ssim: 0.8489), confirming that it effectively preserves the original details. The GT CT images are converted into GT sinograms, which consist of 360 projections (\(256\times 360\)) acquired at \(0.5^\) intervals. By removing \(r\%\) of the projections from the GT sinogram and reconstructing the images using filtered back projection (FBP), sparse-view datasets are created with sparsity levels of 50%, 75%, 85%, and 95%. These datasets maintain the same structure as the GT CT dataset.
Fig. 1
Pre-processing CT Images: a Original CT image, b Ground Truth CT image with biased information removed, and c its transformation into a sinogram
2.2 Masking strategy on sinogramProMAE processes sinograms instead of CT images, thereby eliminating the reconstruction step. Each column of a sinogram corresponds to a projection at a specific angle, and each row represents a combination of sine functions. Unlike MAE models that tokenize square-shaped patches (e.g., \(16\times 16\)), ProMAE employs column-wise tokenization to preserve projection information, enabling effective learning even under high masking ratios.
Fig. 2
Masking strategy by model: The column-wise masking approach applied in ProMAE preserves lesion features (highlighted in yellow) better than the square-shaped masking used in MAE
Furthermore, column-wise masking naturally aligns with sparse-view scenarios where specific projection angles are masked. This approach directly incorporates the concept of sparse views into pre-training, as opposed to the square-shaped masking used in MAE, and helps retain lesion information even at high masking ratios. Figure 2 illustrates the application of square-shaped masking and column-wise masking on CT images and sinograms. In MAE’s square-shaped masking approach, as the masking ratio increases, lesion information (highlighted in yellow in Fig. 2) largely disappears. In contrast, ProMAE’s column-wise masking preserves lesion information even at very high masking ratios. This is because sinograms are likely to contain lesion details in every column, enabling effective extraction of lesion features even from a limited number of columns (projections).
In addition, by applying random masking, ProMAE can be trained to provide robust diagnostic results even in adverse situations where sampling is limited (for instance, due to errors in some samples or restrictions in imaging angles). While previous studies [47] have applied random column-wise masking on sinograms for various CT denoising tasks, ProMAE advances this approach by focusing on extracting features critical for disease classification.
The key advantages of column-wise tokenization and random masking are as follows.
1.Restoring masked sinogram columns simplifies interpolation by leveraging the relationships between sine functions [21], making it more efficient than square-shaped masking of CT images. This enables stable learning even at high masking ratios.
2.Column-wise masking naturally aligns with sparse-view sinogram (Fig. 3b), where the masking ratio increases as the number of projections decreases. This masking approach preserves lesion information, enabling effective learning of lesion features required for classification from sparse-view sinograms with varying degrees of sparsity.
3.By applying random masking, the model is capable of processing projections sampled from arbitrary angles. This provides flexibility in imaging system design and enables robust diagnostic performance across diverse acquisition environments and outcomes.
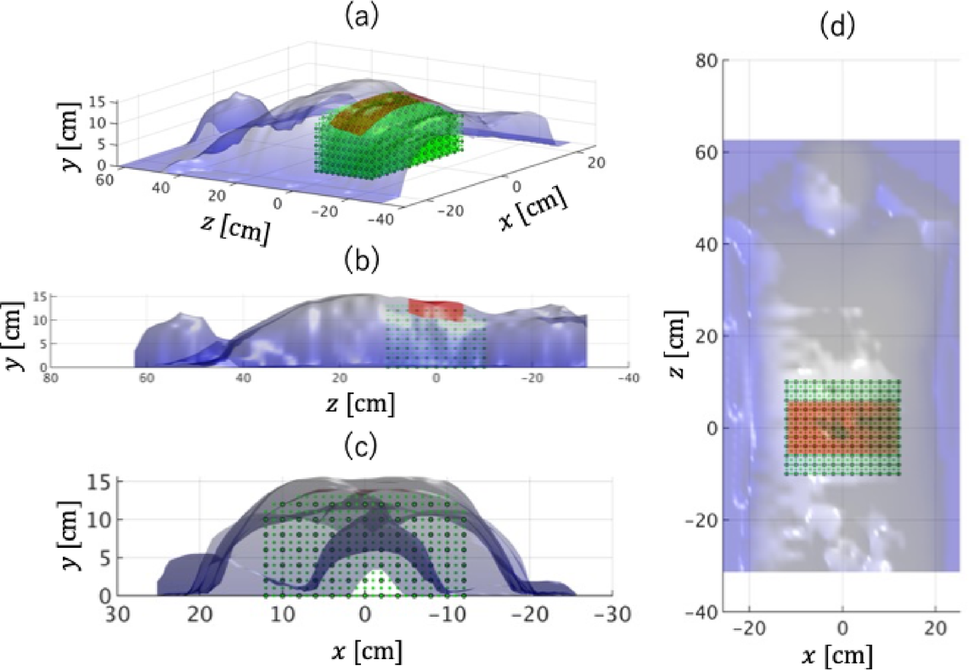
Fig. 3
Randomly column-wise masking of the sinogram: The blue dots in (a) represent the points (angles) at which projections were acquired. These sparse projections form the sparse-view sinogram as shown in (b). This, in turn, is reconstructed to a low-quality CT image, as seen in (c), through Filtered Back Projection (FBP)
In the experiments, we evaluated the performance of models employing various masking strategies. ProMAE uses column-wise masking, while MAE employs square token masking, and both methods were pre-trained with masking ratios of 50%, 75%, 85%, 95%, and 99%. The input data for ProMAE, the sinogram, consists of 360 columns (projections). Depending on the masking ratio, the masked sinogram contains 180, 90, 54, 18, or 4 X-ray projections, representing a sparse-view sinogram (Fig. 3b). When reconstructed, this corresponds to a sparse-view CT (Fig. 3c).
2.3 Pre-trainingFig. 4
Overall Framework of ProMAE: ProMAE takes the GT sinogram (a) as input and performs pre-training using column-wise masking (b). The pre-training process aims to minimize the difference between the restored sinogram (c) and the GT sinogram (a) while encoding the sinogram features into a class token (CLS). Once pre-training is complete, the downstream task (d) involves classification learning using the class token. In the downstream task, both the fully connected (FC) layer and the encoder are fine-tuned, enabling comprehensive learning that enhances classification accuracy
The pre-training of ProMAE (Fig. 4a\(\rightarrow \)b\(\rightarrow \)c) closely follows the Masked Autoencoder approach, utilizing GT sinograms as input. After column-wise tokenization, \(r\%\) of the tokens are masked. The class token (Fig. 4 CLS), which interacts with the unmasked (visible) tokens to learn the key features of the sinogram, is processed simultaneously by the ViT [10] encoder. The encoder outputs comprehensive representations that are passed to the decoder to restore the masked tokens. Restoration accuracy is measured using \(L^2\) loss, aiming to align the full-view sinogram predicted from the sparse-view sinogram with the GT sinogram.
In ProMAE’s pre-training, various masking ratios (50%, 75%, 85%, 95% and 99%) are applied to determine the optimal ratio for extracting features best suited for the task, depending on the data. In fact, many transformer-based studies, including MAE, adjust the masking ratio during training according to the type of data and the difficulty of the task. For example, the language model BERT uses a 15% masking ratio [14], MAE for image data employs a 75% masking ratio [9], and video-MAE achieves optimal performance with a 90% masking ratio for video data [24]. Therefore, this study verifies which masking ratio is most effective in learning the characteristics of COVID-19 lesions during the restoration process.
Both the pre-trained ProMAE and MAE models are evaluated on the GT data validation set, and the model with the lowest validation loss is selected. To assess reconstruction quality, the restored sinogram is converted back into a CT image via Filtered Back Projection (FBP) (Fig. 4c\(\rightarrow \)c’) and compared to the GT CT image using PSNR and SSIM metrics.
To compare ProMAE and MAE, MAE pre-training was performed in two domains: CT and sinogram. While previous studies conducted MAE pre-training only on CT images [32], this study applied square-shaped masking on sinograms to compare restoration performance within the same domain as ProMAE. MAE pre-trained on CT images is denoted as MAE (CT), and MAE pre-trained on sinograms is denoted as MAE (sinogram). The differences between these methods are summarized in Table 2, and the training parameters are provided in Table 3.
Table 2 Comparison of Pre-training2.4 Downstream taskThe downstream task is a key stage of ProMAE, focusing on disease diagnosis using the class token extracted from the pre-trained encoder. An \(r\%\) sparse-view sinogram is passed through the trained encoder to extract the class token, enabling classification based on the features of the sparse-view sinogram.
In the classification training conducted in the downstream task, a fully connected (FC) layer is applied to the 512-dimensional class token extracted from the sparse-view image to form a classifier, which predicts one of three labels: NonCOVID, COVID, or CAP. During this training process, both the FC layer and the encoder are fine-tuned simultaneously to achieve optimal performance. When a sparse-view image passes through the fine-tuned encoder, an enhanced class token is generated, and after processing through the trained FC layer, the diagnostic result is produced. Finally, the model with the highest accuracy on the validation dataset is selected as the final classifier.
Fig. 5
Classifiers of each model: The classifiers are trained in the downstream task following pre-training. The ProMAE classifier is trained to classify sparse-view sinograms after pre-training using random column-wise masking on GT sinograms. In contrast, the MAE classifier is trained to classify sparse-view data (sinograms or CT images) after pre-training on GT data using square-shaped masking
To evaluate the models, experiments were conducted using the fine-tuned classifiers to classify sparse-view images at sparsity levels of 50%, 75%, 85%, 95%, and 99%. In particular, to compare the performance of ProMAE and MAE, the following experiments were carried out (Fig. 5): ProMAE was used to classify sparse-view sinograms, and MAE (sinograms) was used to classify sparse-view sinograms. Additionally, MAE (CT) was used to classify sparse-view CT images, where the sparse-view CT images (\(256\times 256\)) were reconstructed from sparse-view sinograms (\(256\times 360\)).
The model was trained using an NVIDIA GeForce RTX 4090, and the training parameters are presented in Table 3.
Table 3 Training parameters
Comments (0)