General approach
Our study mostly follows the Y-3L international valuation protocol [15]. We elicited preferences from a sample of adults from the general population in Australia. Respondents were asked to value Y-3L health states considering their views about a hypothetical 10-year-old child.
To ensure completeness in reporting, we followed the RETRIEVE checklist for reporting the elicitation of stated preferences for child health related quality of life [19] (reported in the electronic supplementary material (ESM) 1). The study was approved by Curtin University Human Research Ethics Committee (approval number HRE2021-0723).
The instrument
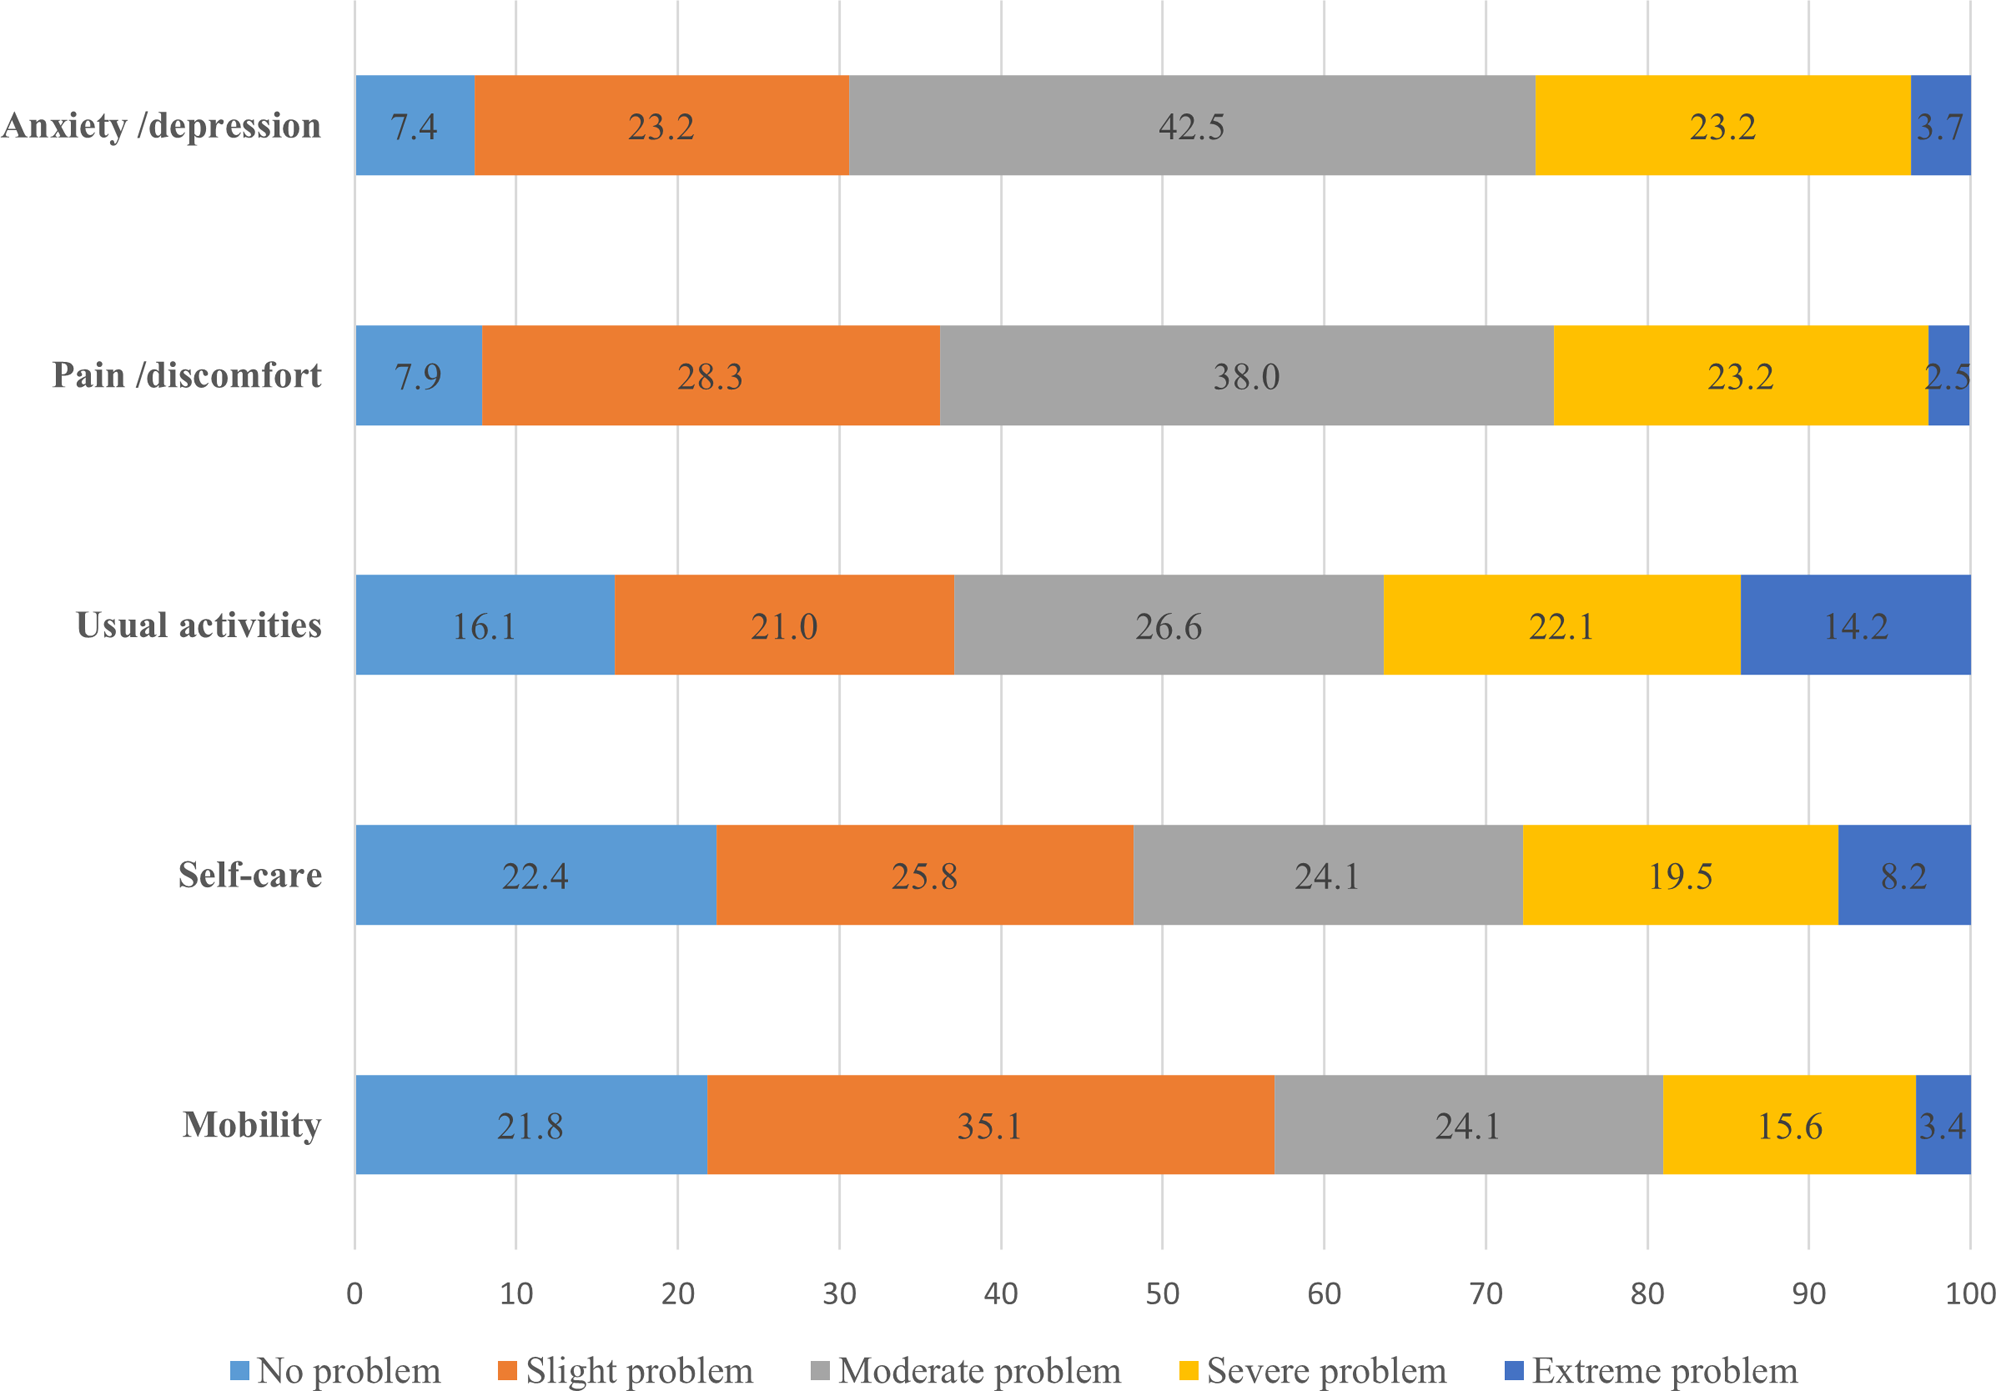
The official Australian (English) Y-3L instrument was used. The Y-3L descriptive system comprises five dimensions: mobility (walking about) [MO], looking after myself (washing or dressing) [SC], doing usual activities (going to school, hobbies, sports, playing, doing things with family or friends) [UA], having pain or discomfort [PD], and feeling worried, sad or unhappy [WSU]. Each dimension has 3 levels: (level 1 = no problems/no pain or discomfort/ not worried, sad or unhappy; level 2 = some problems/some pain or discomfort/a bit worried, sad or unhappy; and level 3 = a lot of problems/a lot of pain or discomfort/very worried, sad or unhappy) [20]. The health state measured by the Y-3L descriptive system can be summarized using a five-digit string, with each digit being the levels in the dimension order presented in the questionnaire. The best health state is therefore 11111 with the worst being 33333.
Valuation methods
The DCE task used pairwise comparisons, with each choice pair including two health profiles defined by the Y-3L descriptive system. The respondent was asked to consider which of two health states, A and B, they preferred for a hypothetical 10-year-old child. The duration of life in each health state was not included. The DCE design was D-efficient and consisted of 150 DCE pairs separated across ten blocks of 15 choices tasks per respondent. A target sample size of 1000 participants was followed, as suggested in the protocol [15].
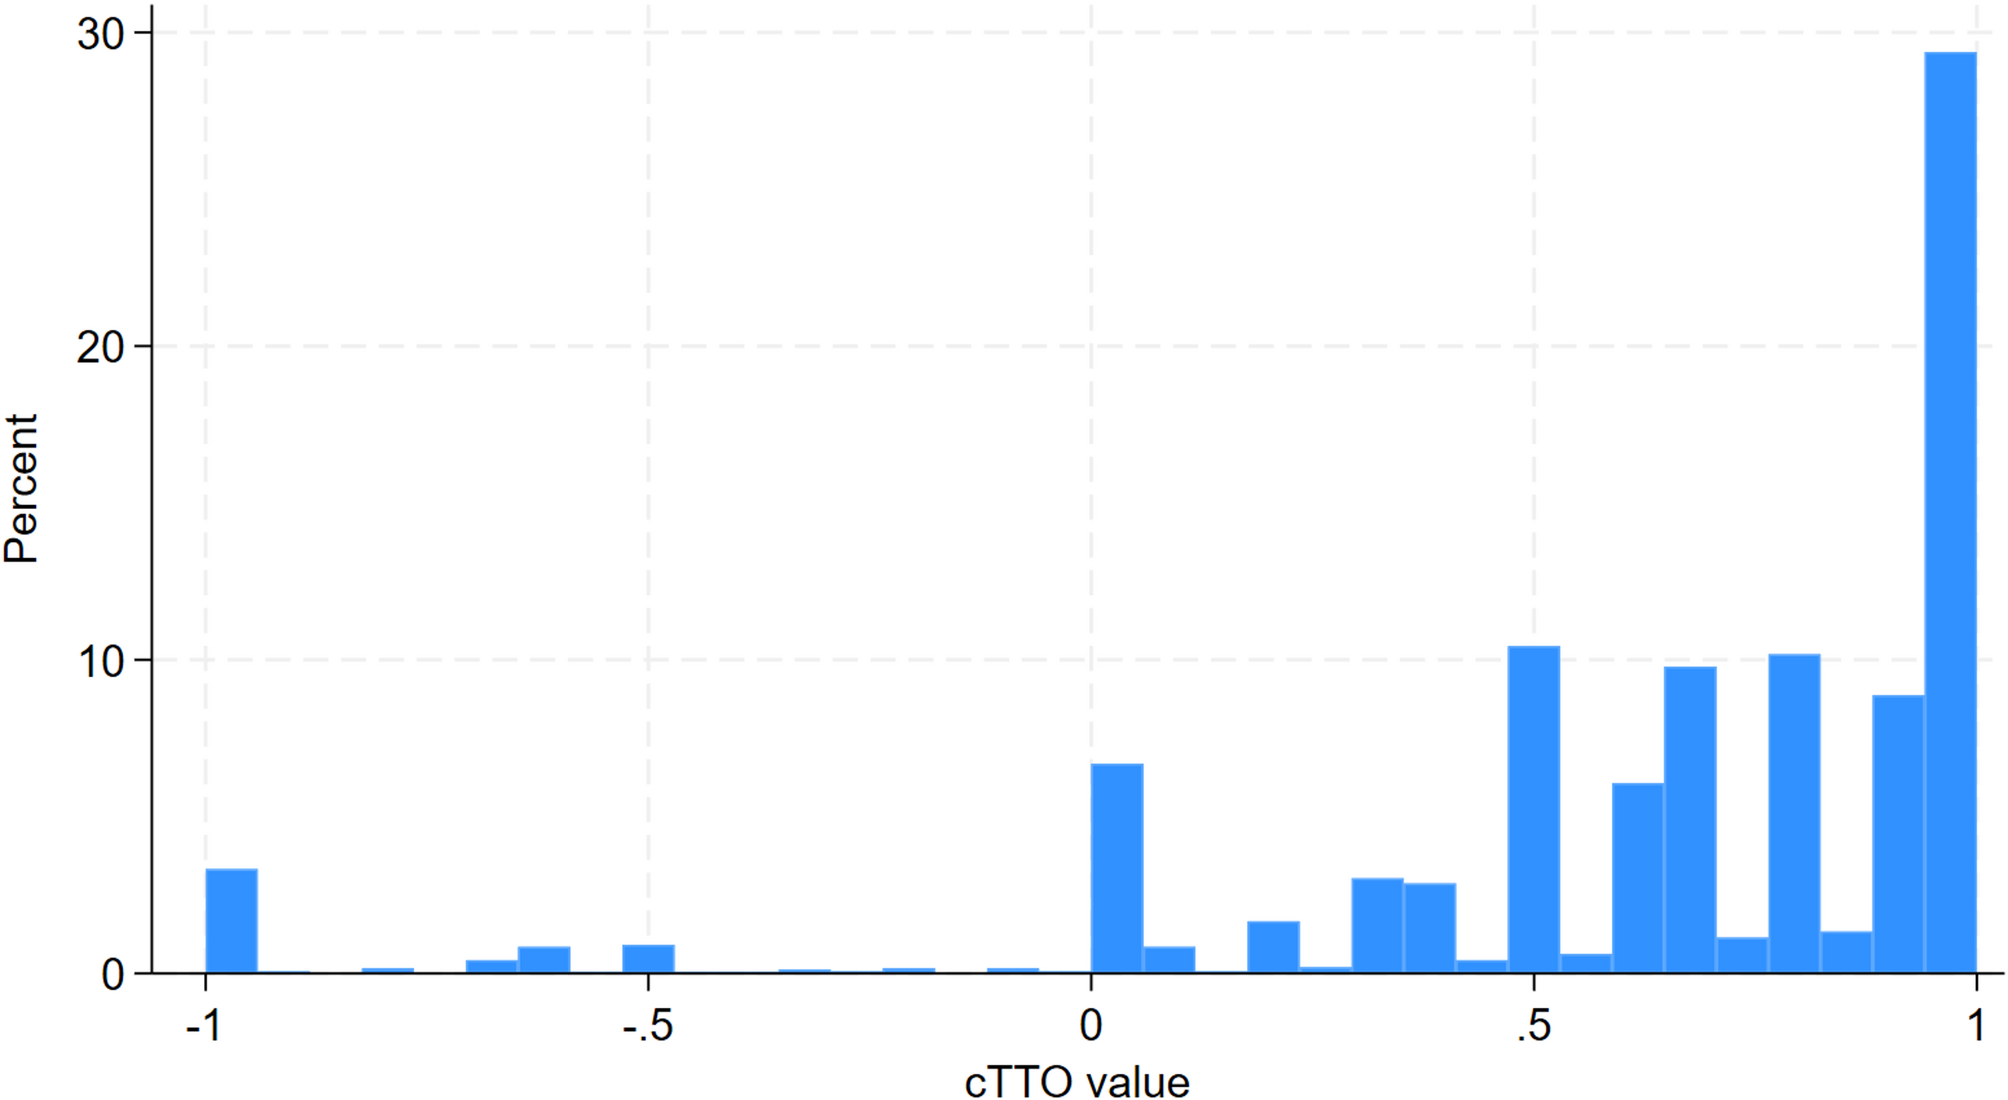
The cTTO tasks comprised a traditional TTO to derive values for states considered better than dead and a lead-time TTO for states which were considered worse than dead. The respondent was asked to select between two lives for a hypothetical 10-year-old child, A and B, or they could state that they are indifferent. For health states considered as being better than dead, life A was a number between 0 and 10 of life-years in full health and life B was 10 years in a specific Y-3L state. The length of life in Life A was varied until the respondent stated they were indifferent. For health states that were considered as worse than dead, life A still equalled a number between 0 and 10 of life-years in full health whereas life B referred to 10 years in full health followed by 10 years in a Y-3L state. Detailed information on the composite TTO has been described elsewhere [21, 22]. The cTTO produces health state values on a scale between − 1 and 1. After completing all the cTTO tasks, respondents were given the opportunity to review their responses, and to flag responses they felt should be reconsidered in the Feedback Module. Details about the feedback module can be found elsewhere [23].
We used an expanded cTTO design of 52 health states, including 50 health states obtained from an orthogonal array [24], and two additional states (i.e., the worst state ‘33333’ and one intermediate state ‘22222’). The orthogonal array included 10 states with a level sum score (LSS) of 7 and 9 respectively, and 30 states with a LSS of 11. The 52 states were assigned into four blocks of 14 health states, with the state 33333 included in each block and state 22222 included in two of the four blocks. We have provided the distribution of the 52 health states by block in Table S1 in ESM2.
As we included a larger number of states than required by the protocol, we estimated that 70 observations per state would be needed, and we estimated the sample size of respondents required to be 260. Details on sample size calculation is provided in ESM2.
Sampling and data collection
The target sample size for the DCE and cTTO survey was 1000 respondents and 260 respondents respectively. Members of the general population (aged 18 years or above) who provided informed consent were included. For the DCE survey, participants were recruited through a market research company (Survey Engine) to complete DCE tasks online through self-completion. Participants were randomly assigned to one of the ten blocks. Quota-based sampling on sex, age, and whether the respondent had ever been a parent was applied. The DCE survey took place between Dec 2021 and Jan 2022.
For the cTTO interviews, respondents were recruited by another market research agency (CRNRSTONE). We used ‘soft’ quotas for age, sex and education– that is, we monitored recruitment continuously in an attempt to achieve a sample which broadly approximated the composition of the adult Australian population, according to census data, as much as possible. Interviewers talked with the respondents through videoconferencing software, sharing their screens to show respondents the tasks to be completed. Studies have demonstrated equivalence in TTO values between in person and online face-to-face interviews [25, 26]. Participants were randomly assigned to one of the four blocks. Detailed information on cTTO survey procedure was reported in ESM2. The cTTO data were collected by three interviewers using the EQ-VT platform between February and May 2023.
Quality control
The DCE tasks followed the design used in the protocol [15]. We did not add repeated pairs or logically dominant pairs in the tasks as Jonker et al. [27] found that these were unreliable screening tests and poor indicators of response quality. Instead, we applied a garbage class mixed logit model (described below) to identify and account for the respondents with low data quality in DCE [28]. Details are provided in Sect. 2.6.
Standard quality control (QC) processes established by the EuroQol Group were used to evaluate the cTTO interviewers’ compliance with the protocol and interviewer effects [29]. Detailed information of the QC process and criteria are reported in ESM2.
Data analysis
All data analyses were performed using Stata (Version 14.2 MP; StataCorp). We reported the descriptive statistics of the respondents’ sociodemographic characteristics for the DCE and cTTO samples respectively.
We modelled the latent scale DCE data using a garbage class mixed-logit model (MIXL) with a linear, additive utility function, with 10 dummy variables representing the two levels beyond level 1 (i.e. level 2 and level 3) for each of the five dimensions. We allowed for correlation between the estimated parameters of the variance-covariance matrix. Garbage class models have been used in latent class logit models to identify respondents with low data quality [30]. Recently, researchers have included a garbage class in the MIXL which estimates the garbage class share, also providing an estimate of the number of low-quality respondents, and accounts for the influences of low quality responses [28]. The garbage class MIXL was estimated using Bayesian methods. The relative importance of dimensions was determined by the size of the level 3 coefficients. As mentioned above, we did not exclude any respondents or responses from the analysis of DCE data.
Mean observed cTTO values were adjusted for censoring at -1 using a Tobit model, given that the cTTO task does not allow for utilities below − 1. No respondents were excluded from the analysis of cTTO data. We did not exclude non-traders (i.e., those who valued all health states = 1) as it could reflect true preferences. However, following literature [31], responses flagged by respondents in the feedback module during cTTO interviews were excluded from the cTTO data analysis. These states were flagged by respondents as those they felt needed reconsideration, but the states were not re-valued.
We explored two methods to anchor the DCE data to the QALY scale: (1) anchoring using the worst health state, where we rescaled the DCE model coefficients by the ratio of the mean cTTO value for 33333 to the predicted DCE value for 33333; (2) mapping by modelling the relationship between predicted DCE values and mean observed cTTO values for the 52 health states included in the cTTO design. We explored linear mapping with and without specifying an intercept.
Two criteria were used to select the best anchoring approach and final value set, including logical consistency, prediction accuracy (R-squared, mean absolute error (MAE) and root mean square error (RMSE) for the 52 health states included in the cTTO design and mild health states.


Comments (0)