
Remember me


A total of 15 BD-nCI, 15 BD-CI patients, and 15 HCs were recruited in this study, and 2 of them with HDRS-17 score of < 14 were excluded. Finally, 14 BD-nCI patients, 14 BD-CI patients, and 15 HCs were included for analysis. Most of the BD patients had co-morbid anxiety, but there was no statistically significant difference in HAMA scores between the BD-nCI and BD-CI groups. There were no significant differences in sex, age, or BMI among the three groups. The T score of Symbol Coding, CPT, Digit Span, and composite scaled score had significant differences between BD-nCI and BD-CI groups. The detailed characteristics of individuals are shown in Table 1. Demographic and clinical characteristics of the BD-nCI, BD-CI patients, and HCs are presented in detail in Additional file 5:Table S4.
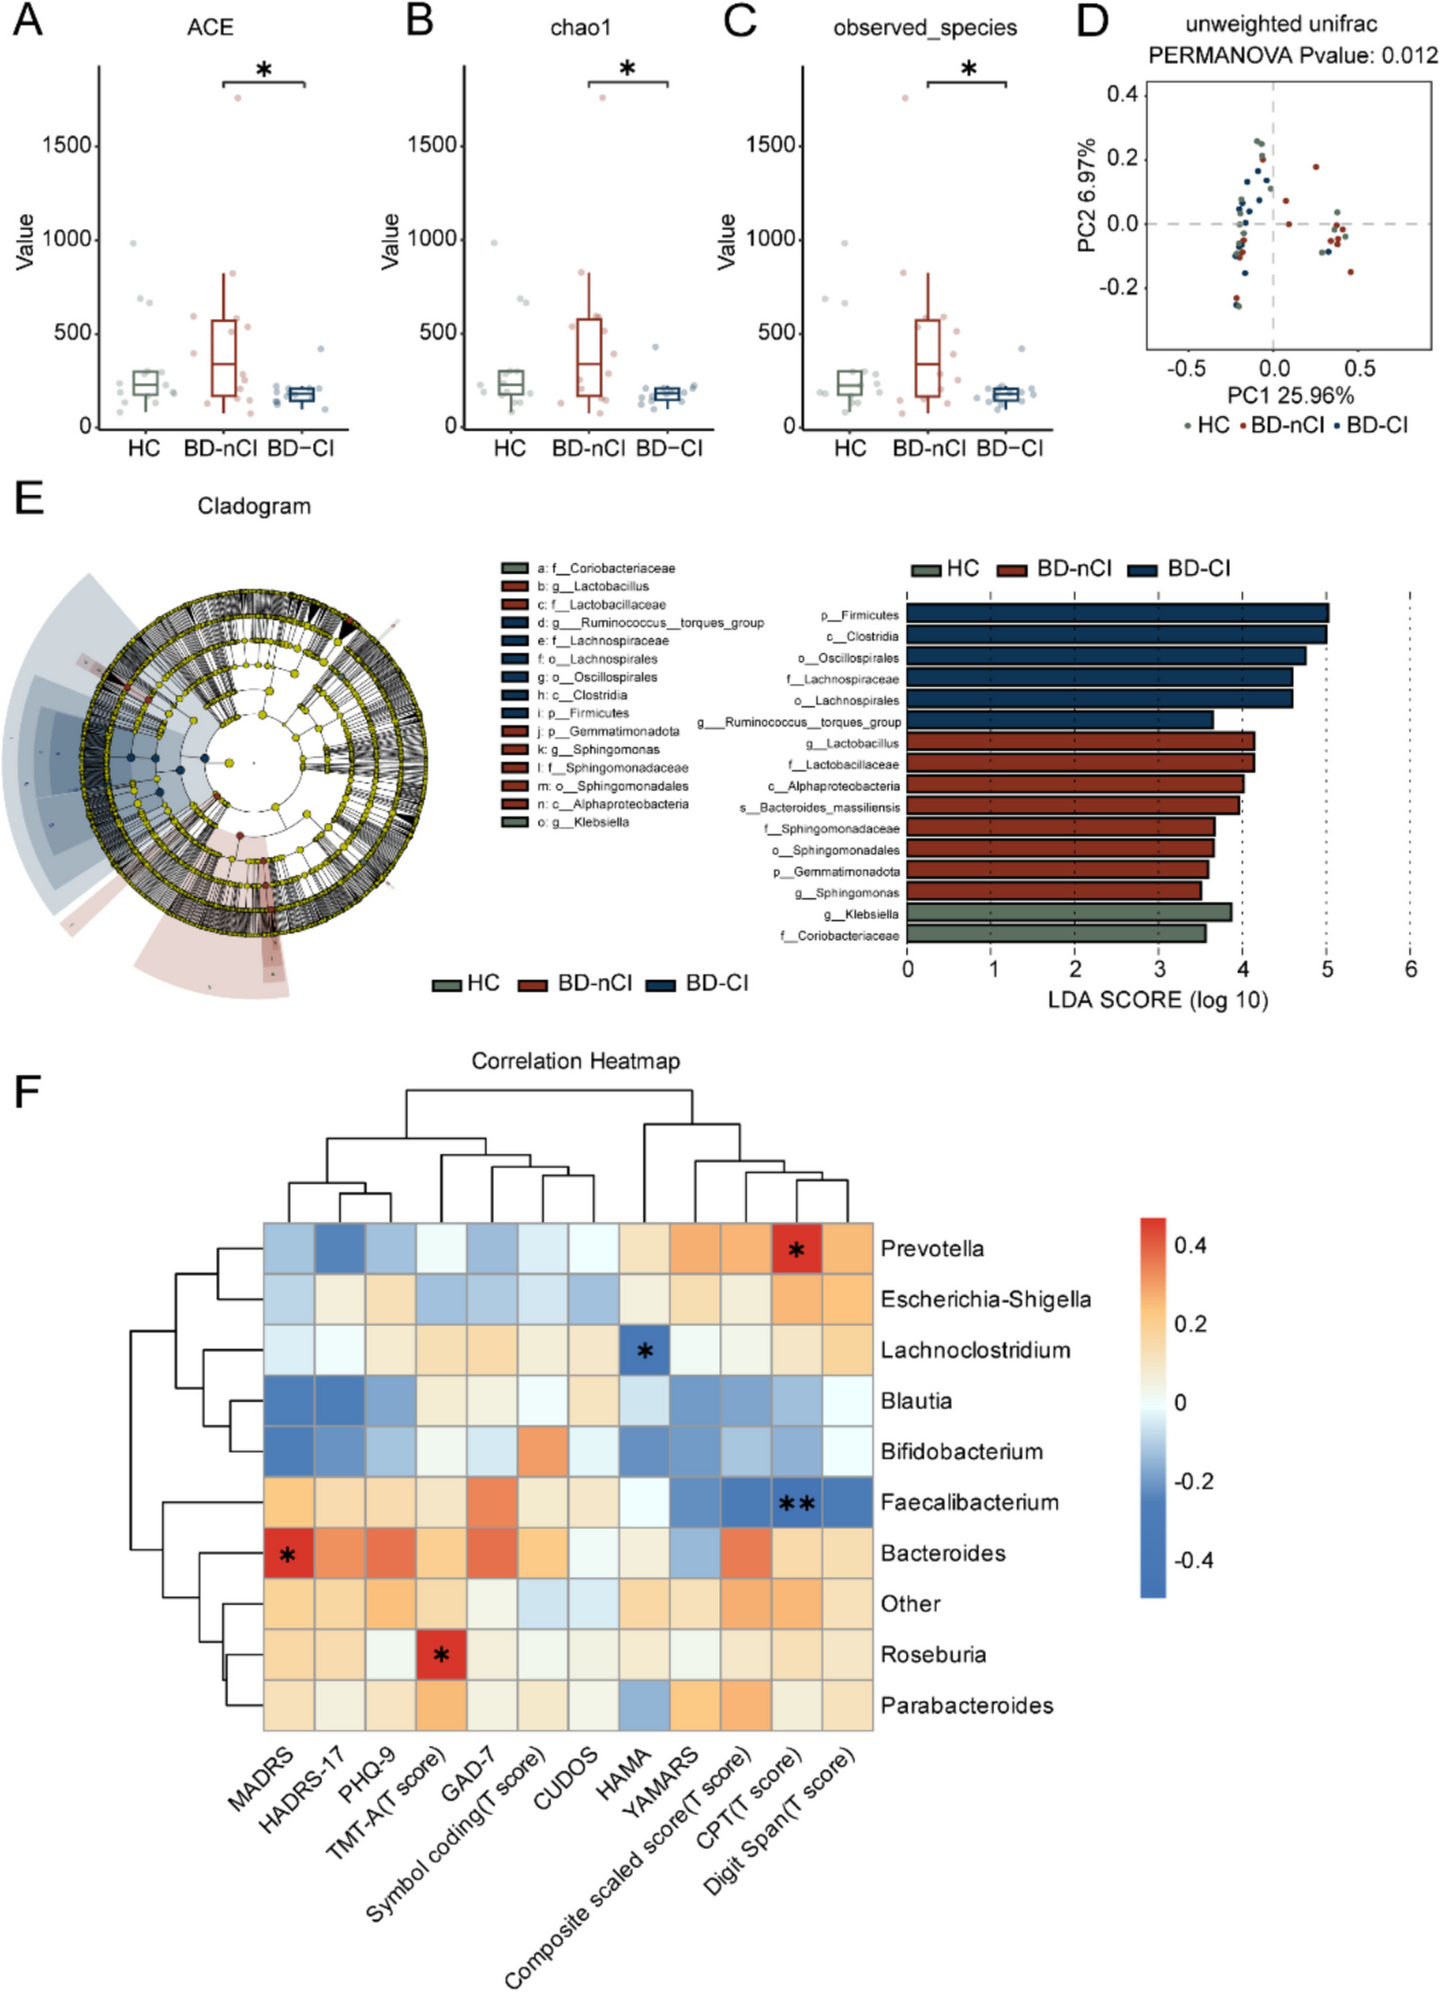
Table 1 Demographic and clinical details of recruited subjectsGut microbiota differs in BD-nCI, BD-CI, and HCsWe identified the bacterial signatures in BD-nCI, BD-CI, and HCs using 16S rRNA sequencing. As estimated by the ACE index, Chao1 index, and observed species, the alpha diversity in the BD-CI group was lower than that in the BD-nCI group (Fig. 1, A–C), while the other indexes were not significant (Additional file 6: Figure S2, A-D). In terms of beta diversity, the principal coordinate analysis (PCoA) on unweighted Unifrac distance identified differential clustering of BD-nCI, BD-CI, and HCs (Fig. 1D). Other 4 different distances in PCoA, such as Bray–Curtis, Binary Jaccard, Euclidean, and weighted UniFrac distances, also distinguished the three groups (Additional file 6: Figure S2, E–H). At the genus level, Bacteroides, Faecalibacterium, Prevotella, Escherichia-Shigella, and Muribaculaceae were the most abundant microbes of BD-nCI, BD-CI, and HCs (Additional file 6: Figure S2, I). Compared to HCs, Escherichia_Shigella, Blautia, and Roseburia were decreased in BD-nCI and BD-CI groups, while the abundance of Parabacteroides and Bifidobacterium were increased (Additional file 6: Figure S2, J). Bacteroides, Escherichia_Shigella, and Prevotella were decreased and Lachnociostridium, Bifidobacterium, and Faecalibacterium were increased in BD-CI, when compared to BD-nCI and HCs (Additional file 6: Figure S2, J). Then, we calculated the percentage of bacterial taxonomic composition and performed linear discriminant analysis (LDA) effect size (LEfSe) to preliminarily reveal the structure features of the microbes (Fig. 1, E). We found that Firmicutes phylum, Clostridia class, Oscillospirales and Lachnospirales order, Lachnospiraceae family, and Ruminococcus_torques_group genera were significantly enriched in BD-CI, while Lactobacillaceae and Sphingomonadaceae family, Alphaproteobacteria class, Bacteroides_massiliensis species, Sphingomonadales order, Gemmatimonadota phylum, and Lactobacillus and Sphingomonas genera were enriched in the BD-nCI group. In addition, the abundance of Klebsiella and Coriobacteriaceae in HCs were higher than that in BD-nCI and BD-CI. We further employed ANOVA-Like Differential Expression (ALDEx2) to further identify key differential genera (Additional file 7: Figure S3, A-C). The results suggested that Klebsiella_variicola showed an increase trend in the gut of BD-CI patients compared with HC, whereas BD-nCI existed a decrease in Pseudomonas and Bacteroides_massiliensis as well as an increase in the remaining 11 genera. Heatmap showed the differential abundance of the six key bacterial genera between the three groups (Additional file 7: Figure S3, D). Next, we explored potential associations between differential genera in BD-CI patients (Additional file 7: Figure S3, E). Overall, we performed co-occurrence analyses of these differential genera and showed that these genera with co-occurring relationships mainly belonged to Firmicutes, Actinobacteriota, Bacteroidote, and Proteobacteria. We found positive correlations between most genera except Haemophilus with UCG-002 and [Ruminococcus]_gnavus_group with NK4A214_group, etc. These findings indicate that these key differential genera may potentially establish symbiotic relationships and ecological interactions within the gut of BD-CI patients.
Fig. 1
Characteristics of the gut microbiota in healthy controls, BD-nCI, and BD-CI patients. A–C The ACE index, Chao1 index, and observed species of Alpha diversity in BD-nCI patients, BD-CI patients, and healthy controls. D Analysis of gut microbiota on principal coordinate analysis (PCoA) of unweighted Unifrac. E LEfSe and LDA analyses revealed differences in taxonomic composition of BD-nCI patients, BD-CI patients, and healthy controls. F The correlation heatmap showed the correlation between the top 10 species of gut microbiota and the scale scores of BD-nCI and BD-CI patients. Data are presented as means ± standard errors of the means (± SEM). Significant differences were measured by Wilcoxon rank-sum test (A–C) and Spearman analysis (F) (*p < 0.05, **p < 0.01, ***p < 0.001, ****p < 0.0001)
In our analysis of the Kyoto Encyclopedia of Genes and Genomes (KEGG) difference pathways in the three groups, we found that the ubiquinone and other terpenoid-quinoe biosynthesis, peroxisome, riboflavin metabolism, lipopolysaccharide biosynthesis, biofilm formation-vibrio cholerae, and citrate cycle (TCA cycle) pathway decreased in BD-CI groups compared to the HC, and in contrast, an increasing trend was observed in the BD-nCI group (Additional file 7: Figure S3, F). We also performed the Spearman correlation analysis of bacterial abundance and clinical parameters in the BD-nCI and BD-CI groups. The results show that Prevotella had a positive correlation with CPT score, while Faecalibacterium had a negative correlation with CPT score. The Lachnoclostridium had a negative correlation with the HAMA score. The Bacteroides was positively correlated with MADRS, and Roseburia was positively correlated with TMT-A score (Fig. 1F).
Together, these findings confirm the differentiated microbial structure across the BD-nCI, BD-CI, and HCs groups, with potential correlation with clinical manifestations.
Depression-like behavior and cognitive impairment in mice following FMTTo investigate whether the gut microbiota from patients with BD-nCI and BD-CI correlates with emotional and cognitive patterns of BD, we performed fecal transplantation by gavage (Fig. 2A). The mice were divided into three groups: (1) the control group, transplantation with 10 μL g−1 gut microbiota from healthy participants for 6 times within 2 weeks; (2) BD-nCI group, transplantation with 10 μL g−1 gut microbiota from BD-nCI patients for 6 times within 2 weeks; (3) BD-CI group, transplantation with 10 μL g−1 gut microbiota from BD-CI patients for 6 times within 2 weeks. All the mice were pre-treated with an ABX by gavage in their drinking water for 7 days to deplete the gut microbiota before FMT.
Fig. 2
Establishment of the FMT mouse model and the behavioral testing. A The schematic diagram of experimental design for the establishment of fecal microbiota transplantation mouse model. B The total distance, total crossing, distance in central area, time in central area and crossing in central area for control, BD-nCI, and BD-CI mice in the open field test. C The diagram of forced swimming test and tail suspension test. D Time spent immobile in the FST. E Time spent immobile in the TST. F The schematic diagram of Y-maze to test spontaneous alternation rate. G The number of entries in Y-maze. H The spontaneous alternation rate in Y-maze. I The schematic diagram of NLR and NOR. J The discrimination index in NLR. K The discrimination index in NOR. Control group (N = 12), BD-nCI group (N = 12), BD-CI group (N = 12). Data are presented as means ± standard errors of the means (± SEM). Significant differences were measured by one-way ANOVA (B,E,G,H,J,K) and Kruskal–Wallis test (D) (*p < 0.05, **p < 0.01, ***p < 0.001, ****p < 0.0001)
Behavioral experiments showed that in the OFT, the number of access and locomotor distance in the central area decreased significantly in both the BD-nCI and BD-CI groups, whereas the total locomotor distance and the total access number were unchanged (Fig. 2B). The difference is that the BD-nCI group spent less locomotor time in the central area, while the BD-CI group did not (Fig. 2B). In the FST, the immobility time of mice in the BD-nCI and BD-CI groups was longer than that of the control group (Fig. 2D), but there was no significant difference in the TST (Fig. 2E). In the Y-maze test, the spontaneous alternation of the BD-CI group mice was less than that of mice in the control group and BD-nCI group (Fig. 2H), with the number of access in the Y-maze balanced among the three groups (Fig. 2G). In the NLR, there was no significant difference in the three groups (Fig. 2J). In the NOR, compared to the control and BD-nCI group, the discrimination index of mice was decreased in the BD-CI group (Fig. 2K).
These results suggested that the microbiota from patients with BD-nCI and BD-CI can induce depression-like behavior in mice, and the BD-CI mice presented impaired ability in working memory and object recognition.
Gut microbiota reconstruction in mice following FMTTo identify which microbiota played a role in the changes of depression-like behavior and cognitive impairment, we performed 16S rRNA-seq on feces from mice that received FMT. The results showed that similar to the results of human donor fecal sequencing, there were significant differences between BD-nCI and BD-CI groups in terms of the ACE index, Chao1 index, and observed species of alpha diversity analysis. Additional difference of the PD whole tree and Shannon index was observed between the BD-nCI and BD-CI mice groups (Fig. 3A–E). We also analyzed the Simpson index and good coverage of alpha diversity, but there was no difference (Additional file 8: Figure S4, A-B). Unweighted Unifrac distance of PCoA at the species-level corroborated an obvious separation between the BD-nCI, BD-CI, and control groups (Fig. 3F). Other four different distances in PCoA were also performed (Additional file 8: Figure S4, C-F). At the genus level, similar to human donors, we found that Escherichia_Shigella, Lachnoclostridium, and Parabacteroides were also the most abundant microbes of BD-nCI, BD-CI, and control mice groups, while there were other highly abundant species like Lactobacillus, Bilophila, Dubosiella, Clostridia_UCG-014, Colidextribacter, Turicibacter, and Streptococcus (Fig. 3G). In the BD-nCI and BD-CI mice groups, we saw a high prevalence of Dubosiella, Turicibacter, and Escherichia_Shigella and a low prevalence of Bilophila, Clostridia_UCG-014, and Streptococcus compared to the control group (Fig. 3G). Compared to BD-nCI and control mice, Parabacteroides, Dubosiella, Lachnoclostridium, Turicibacter, and Escherichia_Shigella were increased in the BD-CI group, while Lactobacillus and Colidextribacter were decreased (Fig. 3G). The LEfSe initially revealed the gut bacterial marker and identified those that significantly contributed to the differences between the groups, particularly Parabacteroides and other 11 bacteria at the genus level were most abundant in BD-CI mice and Lactobacillus, Dubosiella, and other 16 bacteria were highest in the BD-nCI group (Fig. 3H). In control mice, there was high abundance of Clostridia_UCG-014 genera and other 8 genera (Fig. 3H). Our ALDEx2 analysis of gut microbiota of mouse groups (Additional file 9: Figure S5, A-C) showed that in comparison to control mice, a total of 45 genera were increased in the BD-CI mice (including Alistipes, Clostridia_vadinBB60_group, Tuzzerella, Lactobacillus, etc.) and 34 genera of bacteria decreased (including Adlercreutzia, Escherichia-Shigella, Turicibacter). In comparison to control mice, the BD-nCI mice had a total of 43 genera increased (e.g., Alistipes, Parabacteroides, Streptococcus) and 59 genera decreased (including Anaeroplasma, Clostridium_sensu_stricto_1). Meanwhile, the heatmap more visually demonstrated the differing genera between the three groups (Additional file 9: Figure S5, D). In our co-occurrence analysis of differential genera in BD-CI mice, there was a closer genera interaction in the mouse group compared to the BD-CI patients (Additional file 9: Figure S5, E). The co-occurrence network comprised 47 nodes and 126 edges and there was a 43.65% negative and 56.34% positive correlation association in the network. These genera were mainly derived from Phylum of Firmicutes, Actinobacteriota, Bacteroidota, Proteobacteria, and Desulfobacterota, which may serve as key taxa for stabilizing the microbial network in BD-CI mice. Similarly, we also compared the differential KEGG pathway in gut microbiota in mouse. The results showed that compared to control mice, both BD-nCI and BD-CI groups were decreased in the Glycan biosynthesis and metabolism, Energy, cofactors and vitamins, Amino acid and Carbohydrate metabolism pathway (Additional file 9: Figure S5, F).
Fig. 3
The change of gut microbiota in BD-nCI mice, BD-CI mice, and control mice following FMT. A–E The ACE index, Chao1 index, observed species, PD whole tree, and Shannon index of Alpha diversity in BD-nCI mice, BD-CI mice, and control mice. F Analysis of gut microbiota on principal coordinate analysis (PCoA) of unweighted Unifrac. G The top 10 different microbes were compared at the genus level. H LEfSe and LDA analyses revealed differences in taxonomic compositions. Data are presented as means ± standard errors of the means (± SEM). Significant differences were measured by Wilcoxon rank-sum test (A–E), Kruskal–Wallis test (G) (*p < 0.05, **p < 0.01, ***p < 0.001, ****p < 0.0001)
These 16S rRNA-seq data provided evidence for the differentiated gut microbiota across the BD-nCI, BD-CI and control mice groups following FMT treatment.
FMT modulated synaptic plasticity in the PFC of miceConsidering that gut microbiota shapes behavioral patterns through communicating with the central nervous system [49], we further explored the possible link between gut microbiota and neuron plasticity in the PFC region. Observation of dendritic structure can provide direct evidence of changes in neuronal growth [50, 51]. In this study, we observed changes in the dendritic structure of PFC neurons in the BD-nCI, BD-CI, and control mice groups (Fig. 4A). We first assessed the changes in dendrite complexity using Sholl analysis (Fig. 4B) and found that BD-CI mice had decreased neuron dendrite complexity in the distance of 70, 80, and 90 μm from the soma, while the BD-nCI mice had lower neuron dendrite complexity in distance of 70 μm from the soma, compared to the control mice (Fig. 4C). We then examined the density of dendritic spines located on the secondary or tertiary branches of PFC neurons. The density of total spines in control mice was significantly higher than that in BD-nCI and BD-CI mice (Fig. 4D,E), suggesting that gut microbiota from patients with BD-nCI and BD-CI might decreased the plasticity of dendritic spines. We also evaluated the expression of PSD-95 and synaptophysin. PSD-95 is an essential component involved in glutamatergic transmission, synaptic plasticity, and dendritic spine morphogenesis [52, 53]. Synaptophysin is associated with neural function and neurotransmitter release [54]. The results showed that PSD-95 protein expression was significantly decreased in BD-CI mice, whereas there was no significant change in BD mice when compared to the control mice (Fig. 4F,G). In addition, no significant difference in synaptophysin expression was found across the three groups (Fig. 4H). We selected indicators of behavioral change and the differential genus that were different between three groups of mice and explore whether these indicators were strongly correlated with synapse-related indicators by Spearman’s correlation analysis. We found that the expression of Synaptophysin protein was negatively correlated with time in central area in OFT, while was positively correlated with spontaneous alternation in Y-maze. The expression of PSD-95 protein in the PFC was correlated negatively with immobile time in FST and TST and positively with discrimination index of NOR. Furthermore, the number of neuronal dendritic spines was positively correlated with indicators of OFT (Additional file 10: Figure S6, A). On correlation analyses of differential genera and indicators of synaptic plasticity, we saw that lactobacillus was strongly positively correlated with PSD95 and synaptophysin, and conversely, Erysipelatoclostridium was strongly negatively correlated with PSD95. In addition, Dubosiella and [Eubacterium]_xylanophilum_group were positively correlated with dendritic spine density, and Escherichia-Shigella was negatively correlated (Additional file 10: Figure S6, B).
Fig. 4
Gut microbiota linked to impaired drendritic plasticity and decreased the PSD-95 protein expression. A Representative PFC neurons in Golgi staining of BD-nCI mice, BD-CI mice and control mice. N = 20 neurons from 4 mice per group, captured with a × 10 objective. B The schematic representation of a neuron drawn. Quantitative Sholl analysis of neuron by counting the number of intersections. C Sholl analysis of neuron dendrites of from the PFC region. D Representative images of the secondary branch of apical dendrites of neurons in the PFC captured with a × 40 objective. E Quantitation of the total spine densities in mice. F–H Representative immunoblots and densitometry analysis of PSD-95 and synaptophysin. Control group (N = 7), BD-nCI group (N = 7), BD-CI group (N = 7). Data are presented as means ± standard errors of the means (± SEM). Significant differences were measured by one-way ANOVA (E, G, H), two-way ANOVA (C) (*p < 0.05, **p < 0.01, ***p < 0.001, ****p < 0.0001)
These findings demonstrated that the gut microbiota from BD-nCI and BD-CI patients was associated with impaired synaptic plasticity, and the gut microbiota associated with cognitive impairment may cause more significant changes in synaptic plasticity.
Supplement microbiota from healthy donors partially reversed behavioral phenotypes and synaptic plasticity in BD-CI miceThe above findings suggested that BD-CI patients harbored different gut microbiota from BD-nCI patients, and the gut microbiota associated with cognitive impairment may play an important role in the synaptic plasticity changes in the brain. We attempted to rebuild the gut microbiota of BD-CI mice by transplanting gut microbiota from healthy participants, and then observed whether the behavioral and synaptic plasticity changes were reversed (Fig. 5, A). The mice were divided into the following four groups: (1) control group, transplantation with 10 µL g-1 gut microbiota from healthy participants for 6 times within 2 weeks, and treated with saline in intervention period for two weeks; (2) BD-nCI group, transplantation with 10 µL g-1 gut microbiota from BD patients without cognitive impairment and treated with saline in intervention period for 2 weeks; (3) BD-CI (Saline) group, transplantation with 10 µL g-1 gut microbiota from BD patients with cognitive impairment and treated with saline in intervention period for 2 weeks; (4) BD-CI (HC) group, transplantation with 10 µL g-1 gut microbiota from BD patients with cognitive impairment and treated with gut microbiota from health participants in intervention period for 2 weeks. All the mice were pre-treated with an ABX by gavage in their drinking water for 7 days to deplete the gut microbiota before FMT period.
Fig. 5
Supplementation of gut microbiota from healthy individuals ameliorated depression-like behavior and cognitive impairment in BD-CI mice. A The schematic diagram of supplementation of gut microbiota from healthy individuals. B The total distance, total crossing, distance in central area, time in central area and crossing in central area for control, BD-nCI, BD-CI (Saline), and BD-CI (HC) group mice in the open field test. C Time spent immobile in the FST. D Time spent immobile in the TST. E The number of entries in Y-maze. F The spontaneous alternation rate in Y-maze. G The discrimination index in NLR. H The discrimination index group mice in NOR. Control group (N = 15), BD-nCI group (N = 16), BD-CI (Saline) group (N = 16), BD-CI (HC) group (N = 16). Data are presented as means ± standard errors of the means (± SEM). Significant differences were measured by one-way ANOVA (B,C,E,G,H), and Kruskal–Wallis test (D,F) (*p < 0.05, **p < 0.01, ***p < 0.001, ****p < 0.0001)
The behavioral experiments showed that in the OFT, the number of access and locomotor distance both in the central area and total area in BD-CI (HC) group mice was improved compared to BD-nCI and BD-CI (Saline) groups (Fig. 5B). In the FST, the BD-CI (Saline) mice presented similar behavioral performance to BD-nCI and BD-CI (Saline) mice, and the immobility time of these three groups were all longer than the control group (Fig. 5C). In the TST, the immobility time of BD-CI (HC) mice was shorter than BD-nCI and BD-CI (Saline) mice, but there was no significant difference (Fig. 5D). The BD-CI (HC) mice had higher spontaneous alternation than the BD-CI (Saline) mice in Y-maze (Fig. 5E, F). In NLR, there was no significant difference among the four groups (Fig. 5G). In NOR, the discrimination index of BD-CI (HC) mice was higher than BD-CI (Saline) group mice and was similar to the control mice (Fig. 5H).
To determine how bacteria ameliorate depressive-like behaviors and cognitive deficits in BD-CI mice, we analyzed changes of gut microbiota structure with 16S rRNA sequencing. Although the BD-nCI, BD-CI (Saline), and BD-CI (HC) groups were lower than control mice on Simpson’s index, ACE index, and Chao1 index, and the BD-CI (HC) group did not change significantly in these measures compared to the BD-CI (Saline) group, we found that on the PD_whole_tree the BD-CI (HC) group diversity index was significantly higher than that of the BD-CI (Saline) group and approach to that of the control group (Fig. 6A–D). LEfSe analyses initially showed the differential microbes in each group, and in the BD-CI (HC) group highlighted genera of Bacteroides, Butyricimonas, Clostridia_vadinBB60_group, Aeromonas, Holdemania, and Shuttleworthia (Fig. 6E). PCoA based on the Bray–Curtis distance matrix showed that the microbe structure had significant spatial differentiation between groups (PERMANOVA, p < 0.001). The BD-nCI group and the BD-CI (Saline) group, formed a significant separation from the control group and the BD-C I(HC) group, suggesting that the behavioral changes correlated with the intestinal flora structural changes. The distribution of BD-CI (Saline) samples was closer to control group and overlapped with the confidence interval of the control group, suggesting that supplementation of healthy microbiota could partially reverse disease-related microbiota disorders and restore their community structure similarity (Fig. 6F). We used ALDEx2 to further pinpoint exactly which bacteria altered the colony structure in BD-CI mice. We found that comparing BD-CI (Saline) mice, the genus of Muribaculaceae, species of Lachnospiraceae_bacterium was elevated in the BD-CI (HC) group, species of Bacteroides_massiliensis, the family of Lachnospiraceae and Oscillospiracea decreased (Fig. 6G). The heatmap showed the four genera with the largest mean changes between the BD-CI (Saline) and BD-CI (HC) (Fig. 6H). Similarly, we pair-wise compared the changes in bacteria before and after supplementation with healthy microbiota in the BD-CI (HC) group, allowing us to more intuitively visualize the changes in bacteria in the same mice. Notably, supplementation of healthy microbiota greatly enhanced the alpha diversity indices (ACE index, Chao1 index, Simpson’s index, Shannon’s index, and PD-whole tree) of the BD-CI mice (Additional file 11: Figure S7, A-E). PCoA analysis demonstrated significant spatial differences in the bacteria of the two groups (Additional file 11: Figure S7, F). In the volcano and heatmap, we observed that supplementation of healthy microbiota improved the abundance of species of Bacteroides_dorei and Bacteroides_uniformis (Additional file 11: Figure S7, G-H). We also tested the neuronal structure and protein expression of PSD-95 and synaptophysin in the four groups. As expected, transplanting gut microbiota from healthy participants substantially improved PSD-95 protein expression, and there was no significant difference in synaptophysin expression among the four groups (Fig. 7A–C). The Sholl analysis reflected the gut microbiota from healthy controls enhanced dendritic complexity at distances of 50, 60, and 70 μm from the soma (Fig. 7D–F). Meanwhile, we found the gut microbiota from healthy donors could slightly improve dendritic spine density, but there was no significant difference (Fig. 7G,H).
Fig. 6
Supplementation of the gut microbiota from healthy individuals improves gut microbe diversity and structure in BD-CI mice. A–D The Simpson index, ACE index, Chao1 index, and PD_whole_tree of Alpha diversity in control, BD-nCI, BD-CI (Saline), and BD-CI (HC) group. E Lefse and LDA analyses revealed differences in taxonomic composition of control, BD-nCI, BD-CI (Saline), and BD-CI (HC) group. F Analysis of gut microbiota on principal coordinate analysis (PCoA) of Bray-Crutis. G The volcano plots of up- and downregulated differential microbes between BD-CI (Saline) and BD-CI (HC) under ALDEx2 analysis. Features with we.ep < 0.05 were considered significantly different. Taxa with an absolute effect size > 1 were highlighted for emphasis. H The heatmap of differential genus between BD-CI (Saline) and BD-CI (HC) under ALDEx2 analysis. Data are presented as means ± standard errors of the means (± SEM). Significant differences were measured by Wilcoxon rank-sum test (A–D) (*p < 0.05, **p < 0.01, ***p < 0.001, ****p < 0.0001)
Fig. 7
Microbiota supplement from healthy individuals partially reversed the impaired neuronal synaptic structure and the PSD-95 protein expression. A–C Representative immunoblots and densitometry analysis of PSD-95 and synaptophysin. Control group (N = 5), BD-nCI group (N = 5), BD-CI (Saline) group (N = 5), BD-CI (HC) group (N = 5). D Representative PFC neurons in Golgi staining of BD-nCI mice, BD-CI (Saline) mice, BD-CI (HC) mice, and control mice. N = 20 neurons from 4 mice per group, captured with a × 10 objective. E Representative tracing images of PFC neurons in four groups. F Sholl analysis of neuron dendrites of PFC from mice. G Representative images of the secondary branch of apical dendrites of neurons in the PFC captured with a × 40 objective. H Quantitation of the total dendritic spine densities in mice. Data are presented as means ± standard errors of the means (± SEM). Significant differences were measured by one-way ANOVA (B,C,H), two-way ANOVA (F) (*p < 0.05, **p < 0.01, ***p < 0.001, ****p < 0.0001)
These data showed that supplementation with gut microbiota from healthy individuals could partially reverse both the depression-like behavior and impaired cognition and improved the impaired synaptic plasticity induced by BD-CI gut microbiota.
Comments (0)