
Remember me
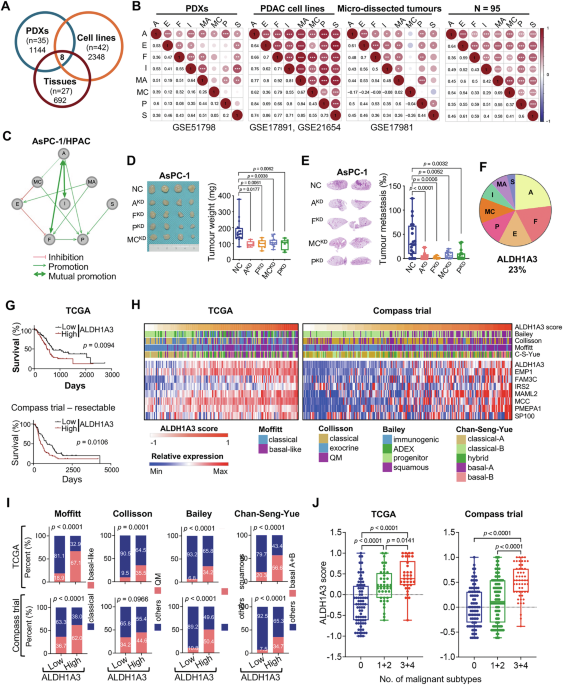
We analyzed three microarray datasets from the Gene Expression Omnibus (GEO) database (patient-derived xenografts (PDXs): GSE51798, cell lines: GSE17891 + GSE21654, tissues: GSE17891) to investigate the relationship between ALDH1A3 expression and the aggressive basal-like PDAC subtype [7]. This analysis identified eight key genes (ALDH1A3, EMP1, FAM3C, IRS2, MAML2, MCC, PMEPA1, SP100) that distinguish ALDH1A3-positive from negative samples, based on k-means clustering (k = 2, Fig. 1A, Fig. S1A). RNA-seq of samples from 95 patients with PDAC confirmed these results (Fig. 1B). RNA-seq data from TCGA supported these findings and additionally showed an association between the expression of these genes (excluding MCC and IRS2) and lower survival rates in PDAC patients (Fig. S1B). Immunohistochemical (IHC) analysis verified the expression of ALDH1A3, FAM3C, IRS2, MCC, and SP100 in PDAC cells, further validating the association between high ALDH1A3 levels in patient tissues and poor prognosis in a larger cohort of 145 patients (Fig. S1, C, D). However, limited by the semiquantitative nature of IHC, we were not able to establish the correlation between ALDH1A3 expression and these proteins.
Fig. 1: Enriched ALDH1A3-network signature in aggressive PDAC subtypes.
A Venn diagram showing differentially expressed genes between ALDH1A3-positive and -negative samples in patient-derived xenografts (PDXs), cell lines, and tissues. B Spearman´s correlation matrix of 8 genes. ***p < 0.001, **p < 0.01, *p < 0.05. C Interaction network analysis depicting relationships among the genes: ALDH1A3 (A), EMP1 (E), FAM3C (F), IRS2 (I), MAML2 (MA), MCC (MC), PMEPA1 (P), and SP100 (S). D Subcutaneous xenotransplantation of parental AsPC-1 cells (NC) to immunodeficient mice or genetically manipulated AsPC-1 cells with knockdown (KD) of ALDH13 (A), FAM3C (F), MCC (MC), or PMEPA1 (P), demonstrating effects on tumor 1size and weight. Left: images of tumor xenografts; Right: mean weights and standard deviations. Control (NC, n = 18), ALDH1A3KD (n = 5), FAM3CKD (n = 7), MCCKD (n = 11), PMEPA1KD (n = 7); p values via unpaired Student’s t test. E Metastatic lung colonization following tail vein injection in mice; NC (n = 20), ALDH1A3KD (n = 22), FAM3CKD (n = 13), MCCKD (n = 12), PMEPA1KD (n = 15); p values by unpaired t test. F Pie chart detailing weight parameters. A (ALDH1A3: 23.08%), F (FAM3C: 19.23%), E (EMP1:15.38%), P (PMEPA1: 11.54%), MC (MCC: 11.54%), I (IRS2: 7.69%), MA (MAML2: 7.69%), S (SP100: 3.85%). G Survival analysis for ALDH1A3High versus ALDH1A3Low patients in TCGA and Compass (stage I-III) datasets. H Heatmap demonstrating the ALDH1A3 network score and molecular subtype in TCGA and Compass datasets; High-risk PDAC subtypes are highlighted in purple. I Proportion of aggressive subtypes versus others in the ALDH1A3High and ALDH1A3Low groups from TCGA and Compass datasets. J ALDH1A3 network score in TCGA and Compass datasets, divided by aggressive subtype. p values via unpaired t-tests.
To study the interplay among these eight key genetic markers, we used lentiviral shRNA particles to knock down these genes in human AsPC-1 and HPAC PDAC cell lines. We confirmed efficient suppression of these genes at the protein (Fig. S2A) and mRNA levels (Fig. S2B). Functional analysis revealed that the loss of function of any of these genes affected the expression of the others, suggesting potential interactions (Fig. S2C).
Specifically, we observed potential interactions between ALDH1A3 and FAM3C, MCC, PMEPA1, and IRS2. This was demonstrated by constructing an oncogenic network based on transcriptional data (Fig. 1C). Knockdown experiments showed that reducing ALDH1A3 levels decreased the expression of IRS2, FAM3C, MCC, and PMEPA1, and vice versa. These data suggest strong mutual regulation among these genes, as confirmed by western blot analysis (Fig. S2D).
Furthermore, overexpressing ALDH1A3 in ALDH1A3-negative PDAC cells (PANC-1/ALDH1A3OE) increased the expression of FAM3C, MCC, and PMEPA1 (Fig. S2E), which was supported by our previous data demonstrating that ALDH1A3 overexpression in PANC-1 cells promoted tumor invasion in vitro [24]. Additionally, cells with knocked down ALDH1A3 or the other key genes FAM3C, PMEPA1, and MCC showed reduced tumor xenograft growth and metastasis in mice, highlighting their role in tumor progression (Fig. 1D, E, Fig. S2, F, G). Knockdown of MAML2 significantly affected cell colony formation in vitro (Fig. S2H), the knockdown of EMP1, IRS2, and SP100 did not affect tumor growth or metastasis (Fig. S2I).
To quantify the impact of individual network genes on the overall network, we developed an ALDH1A3-network score from PDAC mRNA data by assigning numerical weights to each gene based on connectivity (Fig. 1F). Analysis of TCGA (n = 150) and Compass (n = 241) datasets revealed that samples with higher ALDH1A3-network scores correlated with shorter patient survival (Fig. 1G). These scores were also aligned with known unfavorable molecular PDAC subtypes-basal-like, quasi-mesenchymal, squamous, and basal-A/B [2,3,4,5] across both datasets (Fig. 1H).
ALDH1A3 mRNA expression was higher in samples from subtypes associated with worse prognosis (Fig. S3A). Specifically, samples identified as unfavorable by three or more classification systems exhibited the highest ALDH1A3-network scores: 85.3% (29/34) in TCGA and 83.3% (45/54) in Compass (Fig. 1I+J). High ALDH1A3-network scores were also prevalent in the glycolytic subtype, which aligns with the role of ALDH1A3 in promoting glycolysis and is indicative of poor prognosis (Fig. S3B–D) [25]. To maintain clarity, we focused on the function of ALDH1A3 in differentiating between classical-like and basal-like PDAC subtypes.
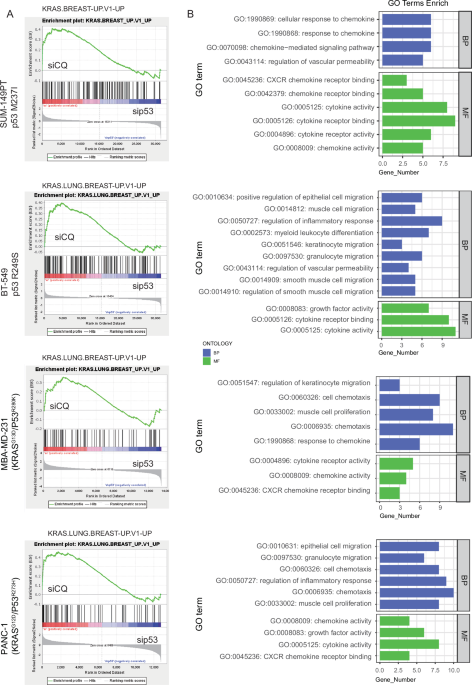
ALDH1A3 enhances AP-1 activity through FOS family membersIn silico analysis identified conserved AP-1 binding sites in the promoters of the network genes, except for ALDH1A3 (Fig. 2A). Examination of the TCGA dataset revealed a strong correlation between the expression of ALDH1A3 and AP-1 subunits belonging to the JUN and FOS families (Fig. 2B). Following ALDH1A3 knockdown, there was a notable decrease in the expression of FOSL2 and FOSB, phosphorylation of JUN and activity of c-Jun N-terminal kinase (JNK) in the AsPC-1 and HPAC PDAC cell lines (Fig. 2C, Fig. S4A).
Fig. 2: ALDH1A3 regulates AP-1 activity through the FOS family.
A Screening results for AP-1 binding sites in the promoters of candidate genes. B Heatmap illustrating Pearson correlation coefficients between candidate genes and AP-1 subunits from the FOS and JUN families. ***p < 0.001, **p < 0.01, *p < 0.05. C Western blot analysis showing protein levels before (NC) and after ALDH1A3 knockdown (AKD#1; AKD#2) in HPAC and AsPC-1 cells. Key proteins detected include JNK activity markers (p-JNKT183/Y185; p-c-JUNS73) as well as expression of FOS subunits (FOSB, FOSL1, FOSL2). This panel shows one representative experiment out of three conducted. D TF enrichment analysis in PANC-1 and AsPC-1 cells affected by altered ALDH1A3 expression. Analysis based on RNA-seq data from three biological replicates. E Contingency table analysis for co-expression of ALDH1A3 and FOSL2 in PDAC sections; statistical significance assessed by Chi-square (χ2) test). IHC images displaying FOSL2/ALDH1A3 staining in PDAC sections, scale bars represent 50 μm. F Results from AP-1 luciferase reporter assays in cells subjected to dual or triple knockdown of FOS subunits. Data are presented as mean values from three independent experiments: p values calculated via unpaired t test. G RT-qPCR (left) and western blot analysis (right) performed on AsPC-1 cells before and after knockdown of multiple FOS subunits, examining the expression of the previously described 8 candidate genes. One representative result from three independent experiments is displayed.
TF enrichment analysis of AsPC-1 cells with ALDH1A3 knockdown and PANC-1 cells with ALDH1A3 overexpression revealed ATF3 and FOSL2 as the top enriched AP-1 related candidates (Fig. 2D). Immunohistochemical analysis of PDAC sections showed a positive correlation between ALDH1A3 and FOSL2 staining, but not with FOSL1 or FOSB (Fig. 2E, Fig. S4B, C), suggesting that ALDH1A3 predominantly modulates AP-1 activity via FOSL2. In support of this, a luciferase reporter assay showed that both knockdown of endogenous ALDH1A3 and overexpression of exogenous ALDH1A3 significantly affected AP-1 activity in the AsPC-1 and PANC-1 cell lines, respectively (Fig. S4D).
Subsequent experiments involving the knockdown of FOSB, FOSL1, or FOSL2 in AsPC-1 and HPAC cells demonstrated that single gene knockdown marginally affected AP-1 activity and the expression of other ALDH1A3 network genes (Fig. S4E–G). However, knockdown of one FOS gene often resulted in the upregulation of other FOS proteins, indicating a possible compensatory mechanism. Only the combined knockdown of two or more FOS proteins significantly reduced AP-1 activity and decreased expression of ALDH1A3 network components, as evidenced by AP-1 luciferase reporter assays, RT-qPCR, and western blot analyses (Fig. 2F–H, Fig. S4H).
Aldh1a3 is crucial for Jnk/Ap-1 activation and pancreatic carcinogenesis in vivoTo investigate the correlation between Aldh1a3 expression and Jnk/Ap-1 activation in pancreatic carcinogenesis, we treated KC (p48Cre/+; LSL-KrasG12D/+) mice with caerulein to induce pancreatitis and Jnk/Ap-1 activity as previously described [26, 27]. Pancreatic tissues collected at various time points after treatment were analyzed by western blotting (Fig. 3A). Following caerulein treatment, we observed coordinated expression of Aldh1a3 and activated Jnk, Fosl1, Fosl2, and Fosb (Fig. 3A, Fig. S5A). In addition, Aldh1a3 was predominantly found in neoplastic lesions of KC pancreata but not in acinar cells, as confirmed by immunohistochemistry and immunofluorescence staining (Fig. 3B, Fig. S5B, C).
Fig. 3: Aldh1a3 is crucial for Jnk/AP-1 activation and pancreatic carcinogenesis in vivo.
A Scheme of treatment of KC mice with cerulein. Western blot analysis of pancreata from KC mice 0, 3, 96 h (h) and 14 days (d) after cerulein treatment and detection of Jnk activity (p-JnkT183/Y185, p-c-JunS73), expression of Fos subunits (Fosb, Fosl1, Fosl2), and Aldh1a3 ; n = 3/group. B IHC displaying Aldh1a3 expression in KC pancreata 14 days after cerulein treatment. Immunofluorescence revealing Aldh1a3/α-amylase and Aldh1a3/Krt19 co-staining; scale bar: 50 μm; n = 3. C KC mice and KC; Aldh1a3-/- underwent cerulein treatment and subsequent analysis of protein expression in their pancreas by western blot, as described above. n = 3. D Pancreas proteins analyzed by western blot post-cerulein treatment, n = 5. E H&E- and α-SMA-stained sections from KCERT; Aldh1a3OE or KCERT control mice 14 days post-treatment; scale bars: 50 μm, n = 5/group. F Differential gene expression analyzed in RNA-seq between KCERT; Aldh1a3OE (n = 3) and KCERT pancreata, (n = 4). Among 987 upregulated genes the top ten enriched TFs were shown. Among 1, 610 downregulated genes five enriched TFs were shown. (G) H&E-stained pancreas sections depicting KC and KC; Aldh1a3–/– pancreata at 30 weeks. IHC showing Krt19 and α-amylase-positive cells; scale bars: 50 μm, n = 3 (KC), n = 4 (KC; Aldh1a3–/–). p values by unpaired t test. H IHC results of H&E, Krt19, or α-amylase-stained pancreas sections from one-year-old KC and KC; Aldh1a3–/– mice. Scale bars: 50 μm, n = 5/genotype.
To explore a causal relationship between Aldh1a3 expression and Jnk/Ap-1 activation, we used KC mice with a targeted deletion of Aldh1a3 (p48Cre/+; LSL-KrasG12D/+; Aldh1a3flox/flox, referred to as “KC; Aldh1a3–/–”, Fig. S5D, E). Compared to parental KC mice, Aldh1a3 deletion resulted in reduced expression of Fosb and Fosl1 and decreased Jnk pathway activation, although Fosl2 protein levels remained unchanged (Fig. 3C, Fig. S5F). To confirm these findings, we generated a transgenic mouse line overexpressing Aldh1a3 (LSL-RosaCAG-Aldh1a3) by introducing loxP-STOP-loxP Aldh1a3 cDNA into the Rosa26 locus. Upon tamoxifen-induced removal of the STOP cassette by p48CreERT, exogenous Aldh1a3 was expressed under the control of the CAG promoter in pancreatic acinar cells (Aldh1a3OE), followed by caerulein treatment for 2 days (Fig. S6A). As expected, Aldh1a3 overexpression led to increased expression of Fosl1 and Fosb and enhanced Jnk pathway activity (Fig. 3D, Fig. S6B, C), correlating with carcinoma in situ formation and a significant stromal reaction compared to control mice (Fig. 3E, Fig. S6D). RNA-seq of KCERT; Aldh1a3OE (n = 3) versus KCERT mice (n = 3) revealed 2,597 differentially expressed genes, with Fosl1 and Fosl2 among the top enriched TFs associated with Aldh1a3-mediated upregulated genes (Fig. 3F). Despite these changes, neither loss nor overexpression of Aldh1a3 alone had any apparent physiological effects based on histological analysis of exocrine markers (keratin 19, α-amylase or muc5ac) (fig. S5E, S6D).
Long-term studies revealed that aging KC; Aldh1a3–/– mice (n = 20) for up to one year showed fewer acinar-do-ductal metaplasia (ADM) and intraepithelial neoplasia (PanIN) lesions at 20 and 30 weeks compared to controls, with no invasive PDAC development at one year (0/5), unlike KC mice, where 50% (4/8) developed invasive PDAC (Fig. 3H, I, Fig. S7A, B).
In conclusion, the obtained evidence cross-species underscores that Aldh1a3 is pivotal in promoting Ap-1 activity and PDAC progression.
ALDH1A3 promotes basal-like transcription by AP-1-mediated enhancer activityTo explore the relationship among ALDH1A3 expression, AP-1 activity, and basal-like differentiation, we performed an Assay for Transposase-Accessible Chromatin using sequencing (ATAC-seq) to profile global chromatin accessibility. Over 50,000 genomic sites were analyzed, revealing differential chromatin accessibility at 8781 genomic loci in PANC-1/ALDH1A3OE cells (compared to PANC-1/NC cells) and 2763 genomic loci in AsPC-1/ALDH1A3KD cells (compared to AsPC-1/NC cells). We identified 190 loci with differential accessibility associated with ALDH1A3 expression in both cell types (Fig. 4A). Specifically, PDAC cells expressing ALDH1A3 exhibited increased accessibility in 107 genomic regions and decreased accessibility in 83 genomic regions. TF motif enrichment analysis of these 190 genomic sites using Hypergeometric Optimization of Motif EnRichment (HOMER) highlighted enrichment for AP-1 subunits, particularly the FOS family (Fig. 4B). The 107 regions with increased accessibility (“ALDH1A3-associated open peaks”) were mainly distal intergenic and intronic, indicating enhanced functionality (Fig. 4C, p = 4.0 × 10⁶). Functional annotation of these ALDH1A3-associated open sites using Cistrome-GO predicted functions of cis-regulatory regions (http://go.cistrome.org), showing significant enrichment in “MAPK signaling,” “RAS signaling,” and “TGF-beta signaling” pathways, which are known to promote PDAC and basal-like differentiation (Fig. 4D).
Fig. 4: ALDH1A3 promotes an oncogenic, basal-like specific transcriptional program by regulating AP-1-mediated enhancer activity.
A Heatmap showing differential ATAC-seq results that identify ALDH1A3-associated accessible or inaccessible chromatin regions in PANC-1 and AsPC-1 cells. B Identification of the top five TF motifs found at ALDH1A3-accessible or -inaccessible chromatin sites in AsPC-1 and PANC-1 cells, analyzed with n = 2 biological replicates. C Pie charts illustrating the genomic distribution of ATAC-seq peaks associated with ALDH1A3, highlighting enrichment of intergenic and intronic sites within open peaks, p = 4.0×10⁻⁶, chi-squared test. D KEGG pathway analysis of genes corresponding to ALDH1A3 open peaks derived from ATAC-seq data. E Quality control analysis of H3K4me1 and H3K27ac CUT&Tag profiles in PANC-1 and AsPC-1 cells, detailing the distribution of all peaks relative to transcription start sites (TSS) in base pairs (bp), with n = 2 biological replicates. F Identification of the top five enriched TF motifs in H3K27ac CUT&Tag data comparing ALDH1A3OE overexpressing and control PANC-1 cells, as well as ALDH1A3KD knockdown versus control AsPC-1 cells, with n = 2 biological replicates. G Visualization of overlapping data showing upregulated genes alongside H3K27ac-associated peaks in specific cellular comparisons; accompanied by KEGG pathway analysis, with n = 2 biological replicates in each group. H GSVA displaying expression profiles of basal-like and classical markers in 22 patient-derived xenografs (PDXs) with high (ALDH1A3High) and low (ALDH1A3Low) ALDH1A3 expression. I H3K27ac ChIP-seq intensity profiles for basal-like and classical markers across ALDH1A3High and ALDH1A3Low PDXs groups. J Top five enriched TF motifs identified in H3K27ac CUT&Tag profiles comparing ALDH1A3High versus ALDH1A3Low PDXs groups. K Pie chart showing RNA-seq-based upregulated gene overlap with ALDH1A3-associated H3K27ac peaks in ChIP-seq data between ALDH1A3High versus ALDH1A3Low groups, including KEGG pathway analysis.
Given the enhancer characteristics of genomic sites with differential chromatin accessibility upon ALDH1A3 expression, we used the Cleavage Under Targets and Tagmentation (CUT&Tag) assay to map H3K27ac (Histone H3 lysine 27 acetylation) and H3K4me1 (H3K4 monomethylation) in PDAC cell lines, histone markers for active and poised gene enhancer sites [28]. The analysis identified 17,998/16,975 ALDH1A3-associated open/closed H3K27ac peaks, and 24,142/46,627 ALDH1A3-associated open/closed H3K4me1 peaks in PANC-1/ALDH1A3OE cells (compared with PANC-1/NC cells). Similarly, we found 22,329/16,773 ALDH1A3-associated open/closed H3K27ac peaks and 27,149/17,020 ALDH1A3-associated open/closed H3K4me1 peaks in AsPC-1/NC cells (compared to AsPC-1/ALDH1A3KD cells). Quality control analysis showed H3K27ac peaks at a median distance between 103 bp and 105 bp from the transcription start site (TSS) and H3K4me1 peaks at 104 bp to 105 bp, typical for enhancers (Fig. 4E). HOMER motif analysis consistently identified AP-1 consensus motifs as the most significant of these ALDH1A3-associated enhancer regions (Fig. 4F). Additionally, motif analysis identified other PDAC-related TFs, such as SMADs (SMAD2, SAMD3), TEADs (TEAD1, TEAD3), and STATs (STAT5, STAT4, STAT6), which are linked to the basal-like differentiation of PDAC [29].
To identify the gene networks regulated by ALDH1A3-associated enhancers, we integrated RNA-seq and CUT&Tag data for H3K27ac. In PANC-1/ALDH1A3OE cells, 58.0% (411/709) of the upregulated genes had increased H3K27ac peaks (compared to PANC-1/NC), and 57.5% (597/1039) of the upregulated genes in AsPC-1/NC cells exhibited H3K27ac open peaks (compared to AsPC-1/ALDH1A3KD cells, Fig. 4G). KEGG pathway analysis of these genes identified “MAPK signaling,” and “TNF signaling,” pathways as relevant pathways promoting basal-like differentiation of PDAC. Similar results were obtained when an integrated analysis of RNA-seq and CUT&Tag data of H3K4me1 was performed (Fig. S8A, B).
Western blot analysis showed that ALDH1A3 knockdown slightly reduced H3K27ac levels in PDAC cell lines (AsPC-1 and HPAC); however, it had no detectable impact on H3K4me1 levels (Fig. S9A). To assess whether ALDH1A3 influences A-CoA biosynthesis-previously reported to be regulated by ALDH1A3 and involved in histone acetylation [9]-we measured nuclear A-CoA levels using ELISA assays in control and ALDH1A3KD PDAC cell lines. No significant differences were observed (Fig. S9B).
To validate these findings in vivo, we analyzed publicly available Chromatin Immunoprecipitation DNA-Sequencing (ChIP-seq) data for H3K27ac (E-MTAB-5632) and paired transcriptional data (E-MTAB-5639) from 22 patient-derived xenograft (PDX) PDAC tumors [28]. We classified samples into ALDH1A3High and ALDH1A3Low based on the median ALDH1A3 network score. By comparing the transcriptional profiles, we found 1,408 differentially expressed genes (Fig. S8C). We further observed that ALDH1A3High PDX tumors were enriched for basal-like markers, whereas ALDH1A3Low PDX tumors were enriched for classical markers by GSVA [3], consistent with previous observations in human PDAC tissues (Fig. 4H). Comparison of H3K27ac peaks between ALDH1A3High and ALDH1A3Low PDX tumors revealed higher signals at basal-like gene loci in ALDH1A3High tumors, with summits near 3 kb from TSS, and consistently higher signals at classical gene loci in ALDH1A3Low tumors (Fig. 4I). Differential comparison via DESeq2 identified 22,129 H3K27ac peaks (targeting 8,466 genes) more represented in ALDH1A3High PDX tumors, and 18,395 H3K27ac peaks (targeting 8, 356 genes) more represented in ALDH1A3Low PDX tumors. Homer’s motif analysis identified AP-1 as the most significant TF for ALDH1A3High tumors, while GATAs (e.g., GATA4, GATA6) and HNFs (e.g., HNF4A, HNF1B) were significant for ALDH1A3Low tumors (Fig. 4J). Notably, 59% (472/800) of genes elevated in ALDH1A3High tumors had H3K27ac open peaks (Fig. 4K). KEGG pathway analysis highlighted “MAPK signaling,” “TNF signaling,” and “Proteoglycans in cancer” as relevant PDAC pathways. Similar findings were obtained using ChIP-seq data for H3K4me1 (Fig. S8D–F).
Taken together, ALDH1A3 promotes an oncogenic, basal-like transcriptional program by regulating AP-1-mediated enhancer activity, converging on the oncogenic MAPK and TNF signaling pathways.
An AP-1-dependent enhancer network converges on oncogenic MAPK signaling in ALDH1A3High PDACReferring to our finding that AP-1, particularly FOSL2, is significantly prevalent in ALDH1A3High PDAC cells and tissues we profiled FOSL2-DNA interactions using the CUT&Tag assay in PANC-1/ALDH1A3OE and AsPC-1/ALDH1A3KD cells. We detected FOSL2 binding peaks at median distance of 104 bp and 105 bp from the TSS (Fig. 5A). We detected 1,580 FOSL2-binding sites targeting 1,173 genes in PANC-1 cells (PANC-1/ALDH1A3OE compared to PANC-1/NC) and 2,419 sites in AsPC-1 cells targeting 1,811 genes in AsPC-1/NC compared to AsPC-1/ALDH1A3KD. Integrating FOSL2 CUT&Tag data with histone markers (H3K4me1/H3K27ac), we observed a significant overlap of FOSL2-binding genes with active enhancers, specifically 62.2% (730/1, 173) in PANC-1 cells and 79.3% (1, 436/1, 811) in AsPC-1 cells (Fig. 5B). This underscores the critical role of FOSL2 in the enhancement of gene regulation. HOMER motif analysis confirmed the dominant role of AP-1 (Fig. 5C).
Fig. 5: Convergence of the AP-1-dependent enhancer network on the oncogenic MAPK pathway in ALDH1A3High PDAC.
A Quality control (QC) analysis of FOSL2 CUT&Tag in PANC-1 and AsPC-1 cells, illustrating peak distances from the transcription start side (TSS) in base pairs (bp). Data shown for n = 2 biological replicates. B Overlapping pie charts depicting ALDH1A3-associated histone modifications (H3K4me1, H3K27ac) and FOSL2 peaks in PANC-1 cells with ALDH1A3 overexpression (ALDH1A3OE) versus control, and AsPC-1cells with ALDH1A3 knockdown (ALDH1A3KD) versus control. Analysis conducted with n = 2 biological replicates per group. C Top five enriched TF motifs identified in FOSL2 CUT&Tag analysis with open or closed chromatin states in PANC-1/ALDH1A3OE versus PANC-1/control cells and AsPC-1/ control versus AsPC-1/ALDH1A3KD cells. Performed with n = 2 biological replicates. D Overlapping charts illustrating upregulated genes co-localized with ALDH1A3-associated FOSL2 peaks across different cell line comparisons including KEGG pathway analysis of these genes. Performed with n = 2 biological replicates. E Heat map showing significantly upregulated genes and their association with FOSL2-binding sites linked to the MAPK pathway in PANC-1/ALDH1A3OE versus PANC-1/control cells, and AsPC-1/ control cells versus AsPC-1/ALDH1A3KD cells. IGV tracks showed open chromatin peaks of MAP2K3 and EREG in PANC-1/ALDH1A3OE versus PANC-1/control cells, and NFκB1 and EGFR in AsPC-1/control versus AsPC-1/ALDH1A3KD cells.
Further analysis integrating CUT&Tag and RNA-seq data revealed that 8.6% (61/709) of the genes upregulated in PANC-1/ALDH1A3OE and 8.6% (89/1,039) of the upregulated genes in AsPC-1/NC showed corresponding changes in FOSL2 peaks (Fig. 5D). KEGG pathway analysis indicated that the MAPK, TNF, and HIF-1 signaling pathways are correlated with ALDH1A3High PDAC cells. For instance, mitogen-activated protein kinase kinase 3 (MAP2K3), epiregulin (EREG), epidermal growth factor receptor (EGFR) and nuclear factor kappa B subunit 1 (NF-κB1) are important components of oncogenic MAPK and inflammatory pathways (Fig. 5E).
RUNX2 is a druggable target in ALDH1A3High PDACTo identify potential therapeutic targets in ALDH1A3High PDAC, we combined data from RNA-seq, ATAC-seq, and FOSL2 CUT&Tag assays performed on PDAC cell lines with either overexpressed or knocked down ALDH1A3. RUNX2 and CD55 were identified as strong candidate targets (Fig. 6A, B, Fig. S10A). We focused on RUNX2 because of several compelling findings: (1) TCGA and Compass trial data indicated higher RUNX2 mRNA levels in ALDH1A3High samples than in ALDH1A3Low samples (Fig. 6C); (2) Runx2 expression was lower in pancreata from KC; Aldh1a3–/– mice than in control KC mice (Fig. 6D, Fig. S10B); and (3) RUNX2 was recently reported as a potential marker for basal-like PDAC [29].
Fig. 6: RUNX2 as druggable target of ALDH1A3High PDAC.
A Integrated analysis of RNA-seq up, ATAC-seq open, and FOSL2 peaks open under ALDH1A3 regulation in PANC-1 and AsPC-1 cells, identifying intersections with RUNX2 and CD55 as shared candidate targets. B ATAC-seq data revealing open chromatin sites at the RUNX2 locus in PANC-1 cells overexpressing ALDH1A3 (ALDH1A3OE) compared to controls. C RUNX2 mRNA expression levels in ALDH1A3High versus ALDH1A3Low groups from TCGA and Compass datasets. D Western blot analysis showing RUNX2 protein levels in KC; Aldh1a3–/– pancreata against KC controls, conducted with n = 3 per genotype. E Western blot indicating RUNX2 levels post-knockdown of dual or triple FOS subunits in AsPC-1 cells; representative of three similar experiments. F Quality control (QC) analysis of RUNX2 CUT&Tag in HPAC cells, showing all peak distances from the transcription start side (TSS) in base pairs (bp). Data from n = 2 biological replicates. G Top five enriched TF motifs in RUNX2-binding open chromatin sites in HPAC cells, identified from the RUNX2 CUT&Tag experiment with = 2 biological replicates. H Western-blot analysis demonstrating RUNX2 expression in HPAC cells transduced with negative controls (NC) or RUNX2-specific shRNAs; one of three independent experiments is shown. I Overlapping charts displaying upregulated genes in HPAC/NC versus HPAC/RUNX2KD and RUNX2-binding genes in HPAC cells, accompanied by KEGG pathway analysis of overlapping genes. Performed with n = 2 biological replicates. J Western-blot analysis illustrating activation levels of oncogenic MAPK pathways (p-ERKT202/Y204, p-c-JUNS73, p-p38T180/Y182 and p-JNKT183/Y185) and expression of RUNX2 in HPAC/RUNX2KD and control cells treated with FBS for 1 h or irradiated with UV for 30 min, representative of three independent experiments with similar outcome. K Xenograft model of HPAC cells demonstrating the effect of RUNX2 knockdown on tumor growth, with n = 4, p values by unpaired Student’s t test. L Tumor growth curves, treated with CADD522 (a RUNX2 inhibitor, n = 4) or control (n = 4), in a subcutaneous tumor model generated by HPAC cells; p values by unpaired Student’s t test.
Western blot analysis showed the higher expression of RUNX2 in ALHD1A3-positive PDAC cell lines (AsPC-1 and HPAC) and the lower expression of RUNX2 in ALDH1A3-negative PDAC cell line (PANC-1) (Fig. S10C). Furthermore, we found the elevated expression of RUNX2 after overexpressing ALDH1A3 in PANC-1 cell line, and the diminished expression of RUNX2 after knocking down ALDH1A3 in AsPC-1 and HPAC cell lines, respectively (Fig. S10D). Knockdown of FOSL2, along with FOSB or FOSL1, led to a significant decrease in RUNX2 expression, underscoring its regulatory role (Fig. 6E, Fig. S10E). We performed a CUT&Tag assay on the HPAC PDAC cell line, which is high in ALDH1A3, to map RUNX2 binding sites. This assay revealed 10,097 RUNX2 peaks, targeting 6,942 genes, with a median distance of 104 bp to 105 bp from the TSS (Fig. 6F). Motif enrichment analysis using Homer highlighted not only AP-1 motifs (FOS, FOSL1, FOSL2), but also BACHs (BACH2, BACH1), RUNXs (RUNX2, RUNX1), KLFs (KLF5, KLF1, KLF6), and TEADs (TEAD3, TEAD1, TEAD4) among the top-ranked (Fig. 6G).
To further investigate the functional impact of RUNX2, we decreased its expression in HPAC cells by lentiviral gene transfer (Fig. 6H). A comparison between HPAC cells with normal controls (NC) and those with RUNX2 knockdown (HPAC/RUNX2KD) revealed 664 upregulated genes in the HPAC/NC setup, with 32.1% (213 out of 664) directly regulated by RUNX2, as they had RUNX2 binding sites (Fig. 6I). KEGG enrichment analysis of these genes suggests that the MAPK and TNF signaling pathways were highly enriched.
Further experiments showed that reducing RUNX2 expression diminished JNK, p38, and ERK activities induced by UV light or FBS in HPAC cells, underscoring RUNX2’s crucial role in activating key components of the MAPK pathway (Fig. 6J). When these modified cells were transplanted into immunodeficient mice, RUNX2 suppression significantly slowed down primary tumor growth, demonstrating its therapeutic potential (Fig. 6K). This effect was mirrored in native HPAC cells treated with the RUNX2 inhibitor CADD522 (Fig. 6L). These results are consistent with those of another ALDH1A3High PDAC cell line, AsPC-1 (Fig. S10F–I). In vitro results confirmed RUNX2 inhibitor CADD522 diminished the cell proliferation ability of AsPC-1 and HPAC (Fig. S10J).
Comments (0)