
Remember me


Mouse experiments were conducted according to the guidelines and regulations approved by the Institutional Review Board of Tongji Hospital (approval number TJH-202305017). All animal experiments were performed based on the Animal Research: Reporting In Vivo Experiments (ARRIVE) guidelines.
Animals and treatmentsSeven-week-old female C57 mice and 11-week-old male C57 mice were purchased from Jiangsu Jicui Animal Company. The mice were housed under a regulated environment (temperature 22 °C, humidity 60%, and a 12-h light-dark cycle) in the Experimental Animal Center of Tongji Hospital, and had free access to food and water. Before the commencement of the experiment, all mice were acclimatized for a week, and then randomly assigned to different experimental groups.
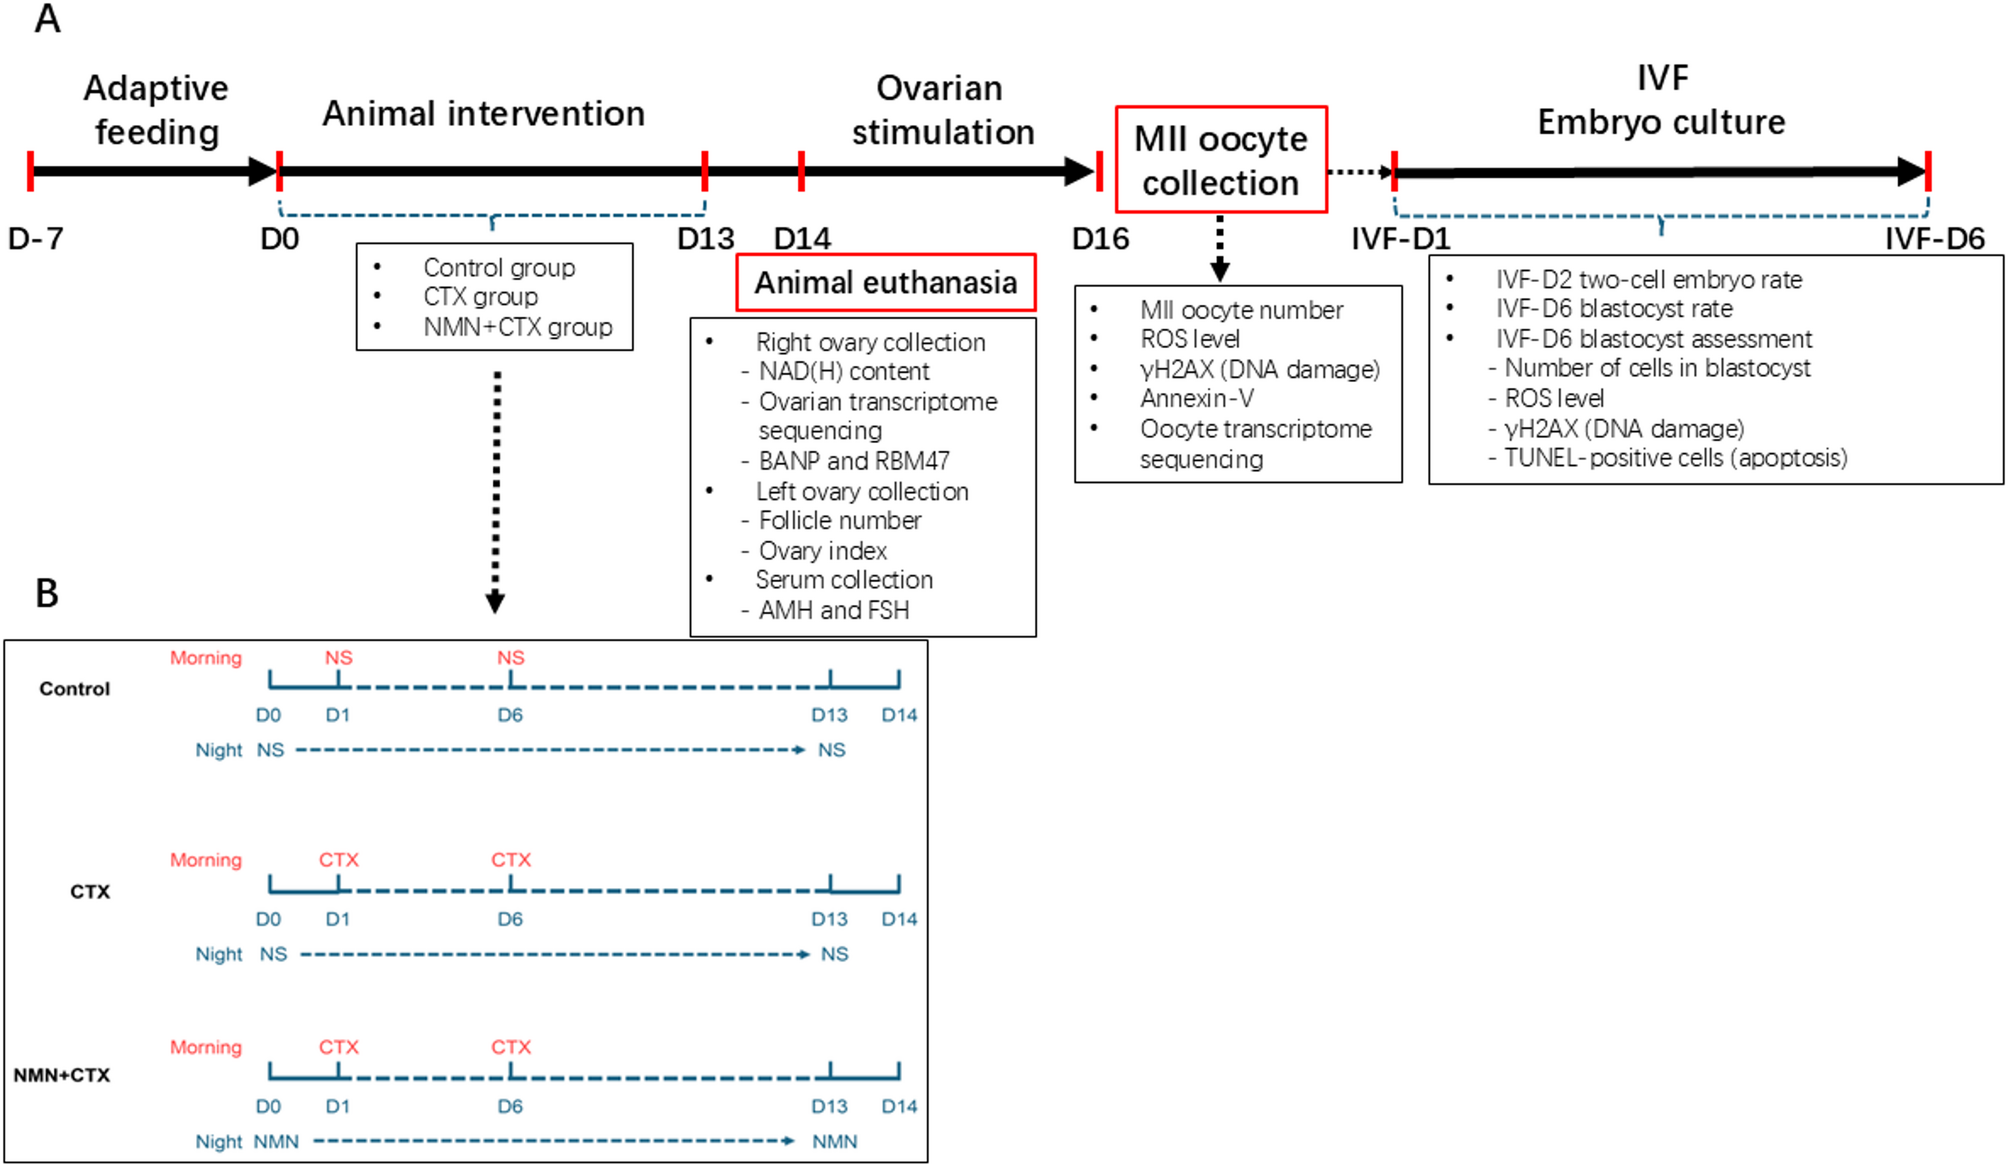
The 8-week-old female mice were randomly divided into three groups: blank control (control group), CTX-treated (CTX group), and NMN-protected (NMN + CTX group) (Fig. 1A). Mice in the CTX group and NMN + CTX group were intraperitoneally injected 150 mg/kg aqueous CTX on the morning of Day 1 (D1) and Day 6 (D6) [22]. Meanwhile, mice in the control group were injected with an equal volume of saline at the corresponding time points (Fig. 1B). In the NMN + CTX group, mice received intraperitoneal injections of NMN (200 mg/kg) once per night from Day 0 (D0) to Day 13 (D13) [23]. Meanwhile, mice in both the control and CTX groups were injected with an equal volume of saline during the same period (Fig. 1B). On the morning of D14, mice from each group were to be euthanized by cervical dislocation (a method used to rapidly euthanize the animals). Thereon, the left ovary, right ovary, and serum samples were collected separately for further analysis; alternatively, some mice underwent superovulation to obtain MII oocytes for in vitro fertilization (IVF) and subsequent embryo culture (Fig. 1A). Detailed information regarding the number of mice, ovaries, oocytes and/or blastocysts utilized in each individual experiment is included in the figure legends.
Fig. 1
Outline of the study design (Fig. 1A) and Animal treatment (Fig. 1B). (Control: control group; CTX: CTX group; NMN + CTX: NMN + CTX group). Mice in the CTX and NMN + CTX groups received intraperitoneal injections of 150 mg/kg aqueous cyclophosphamide on the morning of Day 1 (D1) and Day 6 (D6), while mice in the control group received an equal volume of saline at the same time points. In the NMN + CTX group, mice were also injected intraperitoneally with NMN (200 mg/kg) once nightly from Day 0 (D0) to Day 13 (D13), while an equal volume of saline was injected simultaneously into mice in both the control and CTX groups (Fig. 1B). On the morning of D14, mice from each group were to be euthanized by cervical dislocation (a method used to rapidly euthanize the animals). Thereon, the left ovary, right ovary, and serum samples were collected separately for further analysis; alternatively, some mice underwent superovulation to obtain MII oocytes for in vitro fertilization (IVF) and subsequent embryo culture (Fig. 1A)
Measurement of NAD(H) content in the ovariesOn Day 14, an NAD/NADH quantification kit (Beyotime, Shanghai, China) was applied to determine the concentration of NAD+ of the right ovaries of each euthanized mouse from each experimental group, following the manufacturer’s instructions (Fig. 1A). Briefly, the mouse ovaries were weighed, and NAD(H) was extracted using a NAD(H) extraction solution. Subsequently, 100 µL of the supernatant was subjected to a 30-min incubation in a water bath at 60 °C to obtain the NAD(H) sample. Then, each well was supplemented with 20 µL of the sample and 90 µL of alcohol dehydrogenase, and incubated at 37 °C for 10 min. Subsequently, 2 µL of colour development solution was added to each well and incubated at 37 °C for 1 h. The absorbance at a wavelength of 450 nm was measured using an ELx808IU microplate reader (BioTek, Winooski, VT, USA). Finally, the concentrations were established by extrapolating the standard curves.
Follicle number assessmentOn day 14, the left ovaries collected from each mouse were fixed, embedded, and serially sectioned into a series of 5-µm-thick sections for haematoxylin and eosin staining (Servicebio, Wuhan, China) (Fig. 1A). Follicles were counted in every fifth section to avoid duplication and ensure representative sampling. Follicles were categorized into developmental stages based on morphological features, including PmFs, early growing follicles (EgFs), antral follicles (AnFs), and atretic follicles (AtFs). Primary and secondary follicles were classified as EgFs [24]. The total amount of follicles was the sum of PmFs, EgFs and AnFs, excluding AtFs. Subsequently, the proportion of follicles at various developmental stages in each ovary was analysed. Additionally, the ovary index (OI) was used to accurately assess changes in ovarian mass relative to body weight ratio [25].
Enzyme-linked immunosorbent assay (ELISA)Serum was extracted from the venous blood of mice in each experimental group on the morning of D14 (Fig. 1A). Serum concentrations of anti-Müllerian hormone (AMH) and follicle-stimulating hormone (FSH) were assessed using enzyme-linked immunosorbent assay (Elisa) kits for AMH (CEA228Mu, Cloud-CLONE, Houston, TX, USA) and FSH (CEA830Mu, Cloud-CLONE) following the manufacturer’s instructions.
After collecting the right ovaries of each mouse on the morning of D14 (Fig. 1A), the protein expression levels of RNA-Binding Protein 47 (RBM47) and BTG3 Associated Nuclear Protein (BANP) were evaluated using mouse RBM47 ELISA Kit (abx541619, Abbexa Ltd., Cambridge, United Kingdom) and mouse BANP ELISA Kit (abx392280, Abbexa Ltd.) following the manufacturer’s guidelines.
Ovarian transcriptome sequencingThe total RNA was extracted from the right ovaries of the mice on day 14, after euthanasia (four ovaries per group) (Fig. 1A). Subsequently, RNA libraries were then constructed and quantified using Qubit 3.0 and quantitative polymerase chain reaction (qPCR). Following successful quality control of the libraries, sequencing was carried out using the Illumina NovaSeq 6000 sequencing platform (Illumina, San Diego, CA, USA) in PE150 mode. Initial quality control of the raw sequencing data was performed, and high-quality reads were aligned to the reference genome (GRCh38) was performed for gene expression profiling and structural analysis.
Sequencing data underwent further quality control for downstream bioinformatic analyses. All downstream transcriptome analyses were conducted in R (version 4.3.1; Vienna, Austria) using the official DESeq2 pipeline (version 1.42.1). Differentially expressed genes (DEGs) were identified based on an absolute fold change of > 1.5 and a p-value < 0.05. The results were visualised using heatmap (version 1.0.12) and ggplot2 (version 3.5.0). Gene ontology (GO) enrichment analysis was performed utilizing the R package clusterProfiler (version 4.10.1). Enriched pathways with p-values < 0.05 were identified, and the intersection of different datasets was visualised by the R packages UpsetR (version 1.4.0) and VennDiagram (version 1.7.3).
Ovarian stimulation, in vitro fertilisation, and embryo cultureOn D14, female mice from each group received an intraperitoneal injection of 10 IU of pregnant mare serum gonadotropin (Solarbio, Beijing, China), followed by an injection of 10 IU of human chorionic gonadotropin (HCG) (LIVZON, Zhuhai, China) after 48 h. The mice were euthanised 14–16 h post-HCG injection, and the cumulus-oocyte complexes (COCs) were collected from the oviducts in M2 medium (Aibei, Nanjing, China) (Fig. 1A).
Sperm was initially released from the cauda epididymis of both testes into a pre-equilibrated 900 µL of G-IVF solution (Vitrolife, Stockholm, Sweden) and capacitated for 1 h (37 °C, 5% CO2, 5% O2, and N2 balance). Then 10 µL of sperm was added to the pre-equilibrated 90 µL drops of G-IVF medium containing up to 20 COCs per drop. They were incubated together for 4 h in a humidified environment with 37 °C, 5% CO2, 5% O2, and N2 balance, after which the putative zygotes were denuded. Subsequently, ten zygotes were placed into a 20 µL drop of G1 solution (Vitrolife), which was covered with paraffin oil (Sigma-Aldrich, St Louis, MO, USA), within a humidified atmosphere (37°C, 5% CO2, 5% O2, and N2 balance). Two-cell embryo rate was assessed on IVF-Day 2 (IVF-D2) (IVF day is considered to be IVF-D1), whereas the blastocyst formation rate was assessed on IVF-D6 [26].
ROS level assessmentAfter collection, live MII oocytes or IVF-D6 blastocysts were washed three times in M2 medium (Aibei), followed by incubation with 20 µL of M2 medium containing 0.1 µL of 2’,7’- dichlorodihydrofluorescein diacetate (Beyotime) for 30 min at 37 °C in the dark. Subsequently, they were washed three additional times in M2 medium and mounted on glass slides. Fluorescence was observed and recorded by a fluorescence microscope under consistent conditions. The fluorescence intensity of ROS within the oocytes/blastocysts was measured on the ImageJ software (Version 1.53, NIH, Bethesda, MD, USA) [27].
γH2AX level assessmentAfter collection, The MII oocytes or IVF-D6 blastocysts were fixed in 4% paraformaldehyde (Servicebio, Wuhan, China) for 30 min, and permeabilizated in 0.1% Triton-X-100 (Sigma-Aldrich, St Louis, MO, USA) for 20 min at room temperature. After blocking in 3% BSA (Sigma-Aldrich, St Louis, MO, USA) for 1 h, they were washed with 1% BSA and incubated with an anti-γH2AX antibody (1:200; CST, Toronto, Canada) at 4 °C overnight. Subsequently, they were washed with a 1% bovine serum albumin (BSA) solution for three times. Oocytes/blastocysts were incubated with Cy3-labeled Goat Anti-Rabbit IgG (H + L) (1:200; Servicebio, Wuhan, China) for 1 h at 37 °C, and then were stained with Hoechst 33,258 (Servicebio, Wuhan, China) for 10 min at 37 °C. Finally, they were mounted on glass slides and examined under identical conditions using a fluorescence microscope (Zeiss Axio Observer. A1, Oberkohen, Germany). Fluorescence intensity was analysed on ImageJ (version 1.53, NIH, Bethesda, MD, USA). The relative fluorescence intensity of γH2AX was determined as the ratio of fluorescence intensity at 570 nm to that at 460 nm.
Oocytes apoptosis assessmentThe MII oocytes were stained using an Annexin-V Staining Kit (Beyotime). After washing with M2 medium, the oocytes were incubated in 20 µL of M2 medium containing 2 µL of Annexin-V-FITC for 10 min in darkness. Subsequently, they were washed three times in M2 medium and mounted on glass slides for observation under identical conditions using a fluorescence microscope. Fluorescence intensity was analysed using ImageJ software (Version 1.53, NIH).
Number of cells in blastocysts assessmentIVF-D6 blastocysts were fixed in 4% paraformaldehyde (Servicebio, Wuhan, China) for 30 min, and permeabilizated in 0.1% Triton-X-100 (Sigma-Aldrich, St Louis, MO, USA) for 20 min at room temperature. Subsequently, the blastocysts were stained with Hoechst 33,258 (Servicebio, Wuhan, China) for 10 min at 37 °C. Then they were mounted on glass slides and examined under identical conditions using a fluorescence microscope at 570 nm (Zeiss Axio Observer. A1, Oberkohen, Germany). Finally, the number of cells in blastocysts was counted using ImageJ software (version 1.53, NIH, Bethesda, MD, USA).
Blastocysts apoptosis assessmentThe terminal deoxynucleotidyl transferase dUTP nick-end labelling (TUNEL) apoptosis detection kit (Beyotime) was used to assess apoptosis in IVF-D6 blastocysts, following the manufacturer’s instructions. Briefly, blastocysts were incubated with the TUNEL assay solution and subsequently stained with Hoechst 33,258. Subsequently, the labelled blastocysts were examined under a fluorescence microscope using the same parameters. Images were analysed using ImageJ software (Version 1.53, NIH).
Oocytes transcriptome sequencingThe oocyte transcriptome was sequenced using the Smart-seq 2 methodology. Three sets of samples, each containing eight MII oocytes, were collected from each group. Nucleic acid sequences were reverse transcribed using Oligo dT to generate first-strand cDNA. Subsequently, PCR amplification was performed to enrich the nucleic acids. The library was constructed through various steps, such as DNA fragmentation, end repair, the addition of ‘A’ junctions, and PCR amplification. Quality control measures were implemented during library preparation. An Illumina platform with a PE 150 sequencing strategy was employed to sequence the libraries, and raw reads obtained from Hi-Seq sequencing were subjected to preprocessing steps to remove low-quality sequences and splice contamination, resulting in high-quality clean reads that served as the basis for all subsequent analyses. Bioinformatic analysis was conducted following the previously described methods outlined in the section ‘Ovarian transcriptome sequencing’.
RNA isolation and quantitative real-time PCR (RT-qPCR)Oocyte RNA was exacted and amplified with a Single Cell Sequence Specific Amplification Kit (Vazyme, Beijing, China) based on the manufacturer’s instructions. Ovary RNA was exacted with the RNA-easy Isolation Reagent and reversed to cDNA by HiScript ll Q RT SuperMix (Vazyme). PCR amplification was performed by Taq Pro Universal SYBR qPCR Master Mix (Vazyme). Table 1 presents the primer sequences.
Table 1 Sequences of PCR primers used for RT-PCRStatistical analysisData were analysed using GraphPad Prism 9 (GraphPad Software, San Diego, CA, USA). Normally distributed data were analysed using Student’s t test, whereas non-parametric data were assessed with a two-tailed Mann–Whitney U test. Dichotomous data were assessed using the two-sided Fisher’s exact test. The data are presented as means ± standard errors of the mean (SEMs). Statistical significance was set at p < 0.05.
Comments (0)