Reagents, plasmids, cell transfection, and viral infection procedures
Vinburnine (Vin), N-acetylcysteine (NAC), and SB203580 were purchased from MedChemExpress (MCE, Wuhan, China). The cell stimulation cocktail was obtained from eBioscience (San Diego, CA, USA). The plasmids (shATF3, shIL-24 and shIL-20R2) were purchased from GeneChem (Shanghai, China). The pCCLc-MNDU3-Luciferase-PGK-EGFP-WPRE vector was obtained from Addgene (Watertown, MA, USA), while the ATF3 overexpression plasmid was sourced from Vigene Biosciences Co., Ltd (Jinan, Shandong, China). For lentiviral vector production, HEK-293T cells were plated in 10 cm culture dishes and transfected with TurboFect transfection reagent (Thermo Fisher Scientific, Waltham, MA, USA), following the manufacturer’s instructions. The plasmid mixture, consisting of the target lentiviral plasmid, pspAX2, and pMD2G, was prepared at a mass ratio of 4:3:1. After 24 h of incubation, the medium was replaced with fresh complete culture medium. Lentiviral-containing supernatants were collected at 48 h and 72 h post-transfection, pooled and filtered through a 0.45 μm filter to eliminate cell debris. For viral infection, melanoma cells were incubated with the filtered viral supernatants, supplemented with polybrene (10 µg/mL) for 24 h. Infected cells were then selected using puromycin and used for subsequent experiments.
Cell culture
A375, SK-MEL-28, SK-MEL-5, and HEK-293T cells were obtained from American Type Culture Collection (ATCC, Manassas, VA, USA) and maintained in DMEM (Gibco, Pittsburgh, PA, USA), 10% Fetal Bovine Serum (FBS) (ExCell Bio, Shanghai, China), and 1% P/S (BI, Beit Haemek, Israel). B16F10 and Jurkat cells were sourced from the ATCC and cultured in RPMI 1640 (Gibco), supplemented with 10% FBS and P/S as described above. All cells were cultured in a humidified, 37 °C incubator with a gaseous environment of 5% CO2.
Cell viability and colony formation assay
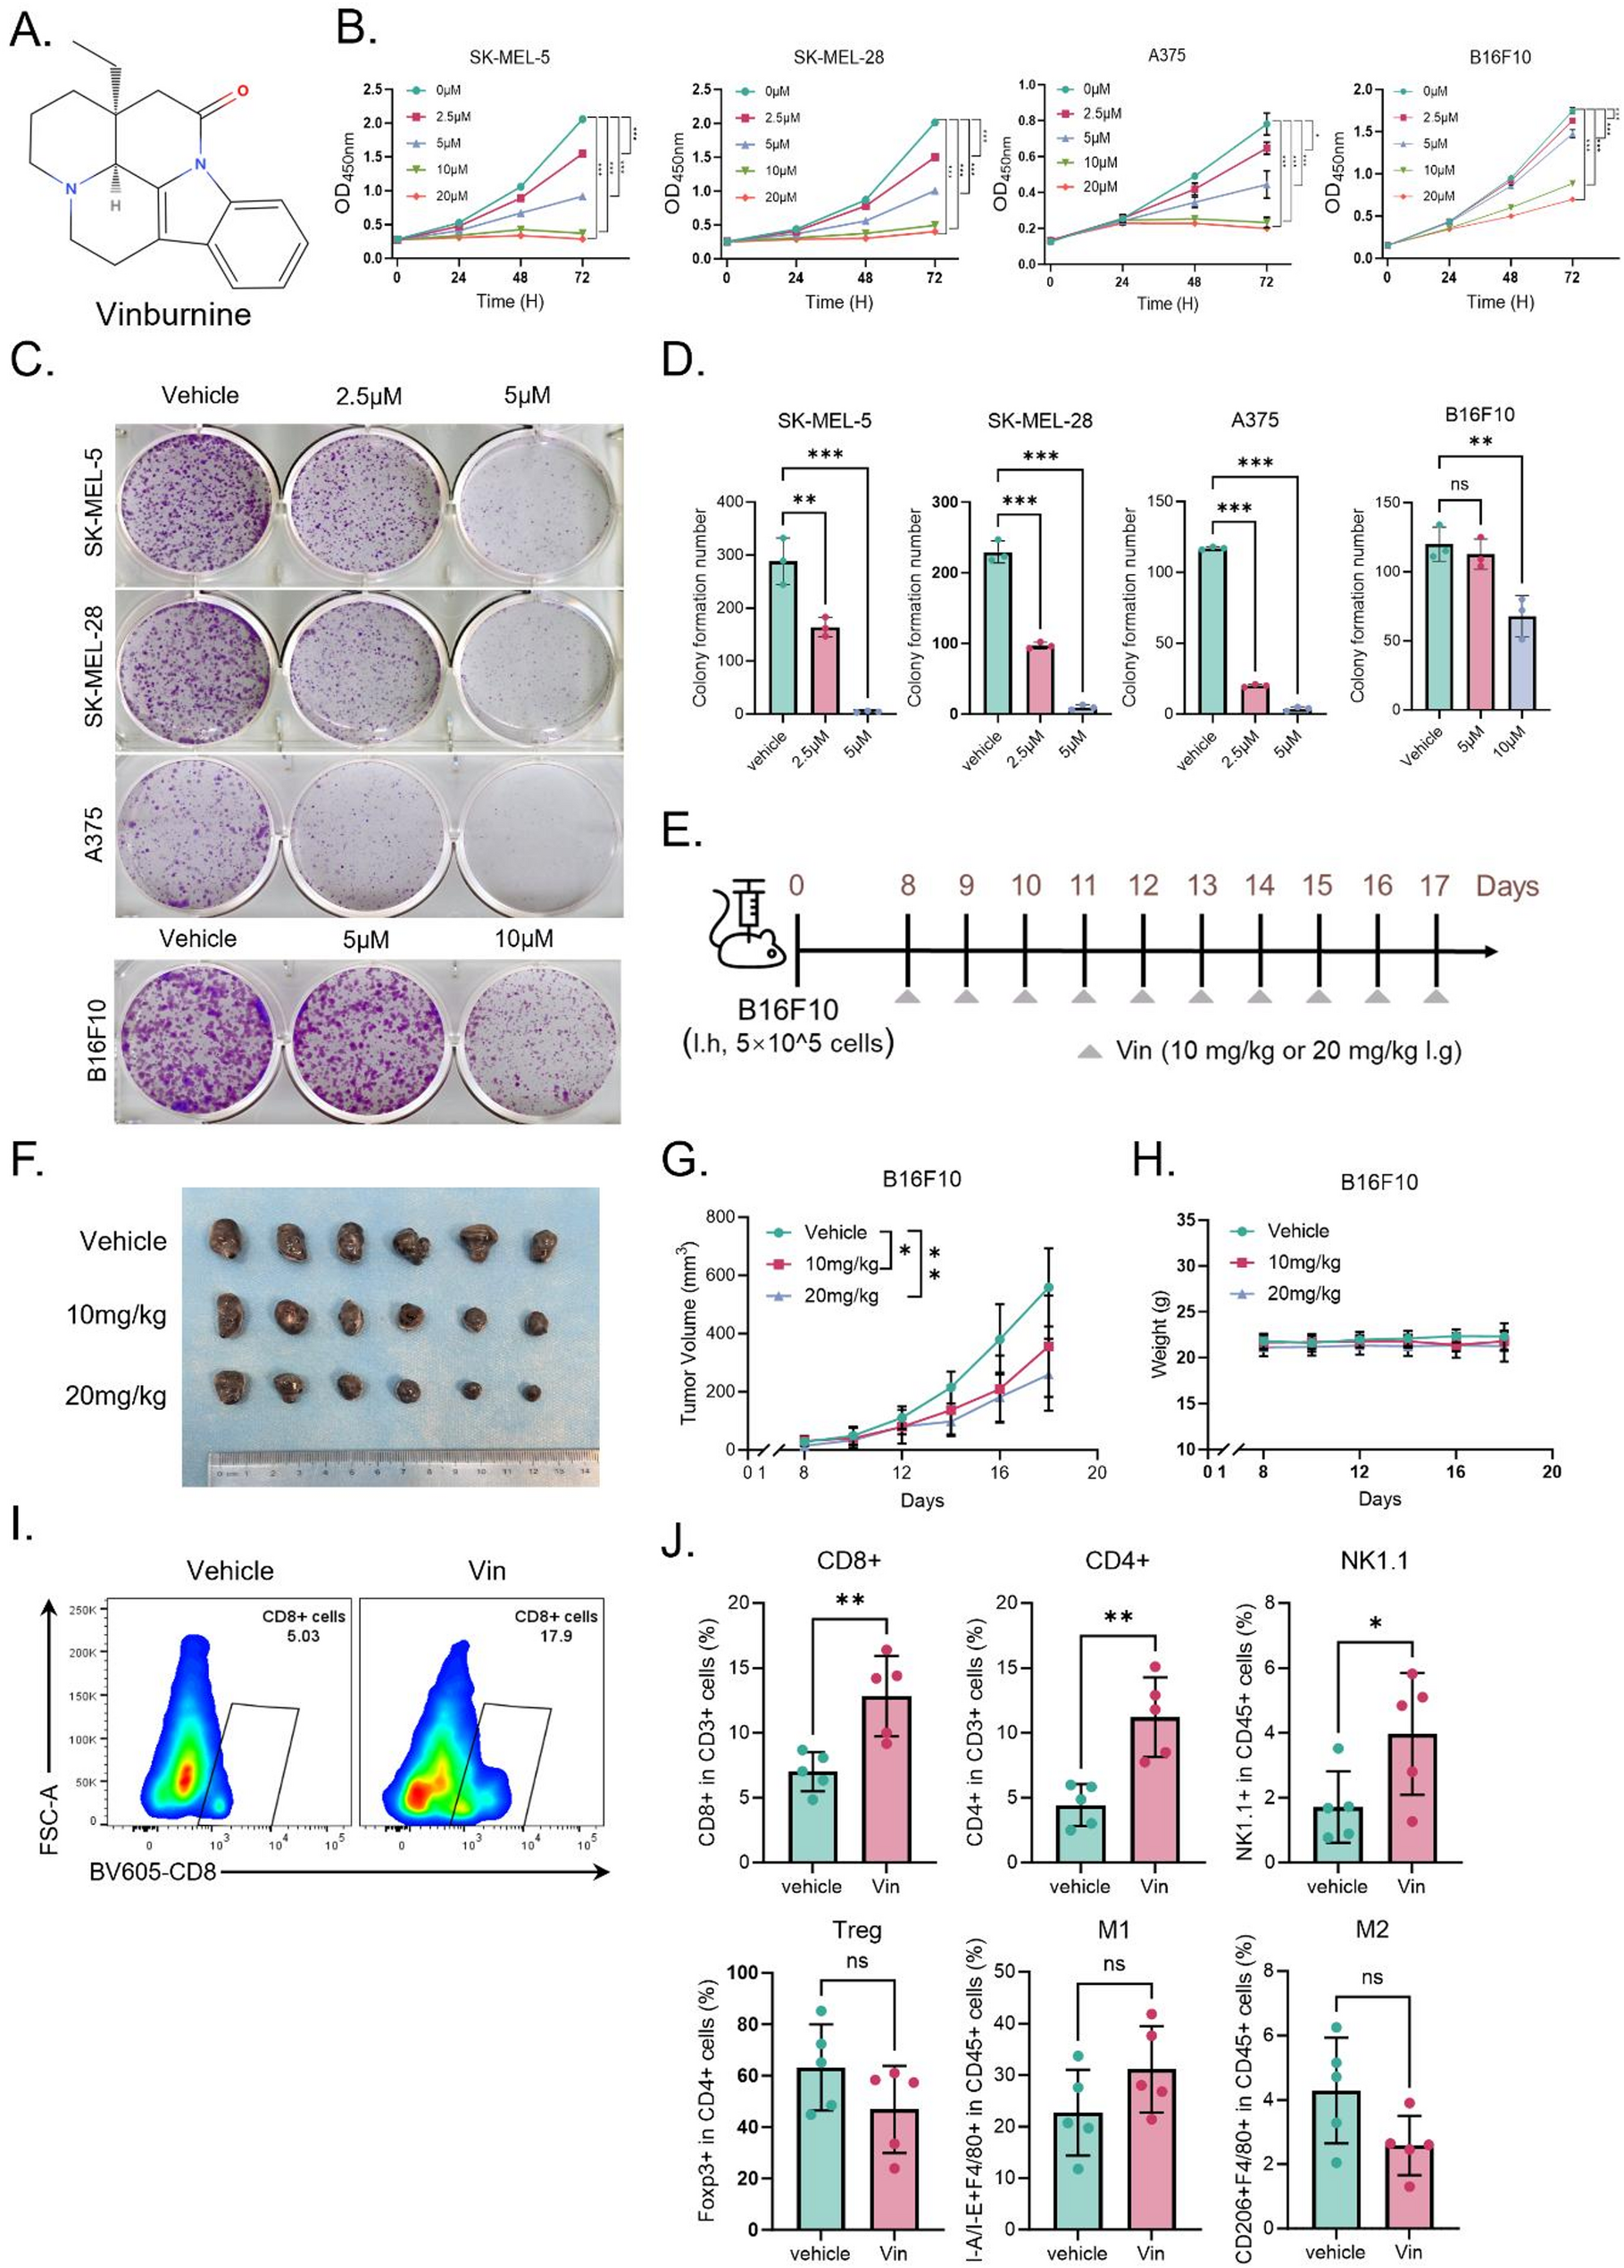
3 × 10³ cells/well were plated in 96-well plates and cultured overnight; Vin was diluted to serial concentration in the medium and added to the well. Cell viability assay was assessed with Cell Counting Kit-8 (CCK-8) (Selleck, Shanghai, China) by a microplate at 450 nm reader after 24, 48, and 72 h of exposure to a serial dilution of Vin (2.5–20 µM), with DMSO used as the vehicle control. To assess cell colony formation, a total of 1 × 10³ cells/well were plated in 6-well plates and cultured overnight, and were incubated with Vin-free DMEM medium along with various concentrations of Vin for 48 h. Subsequently, the medium was replaced, and the cells were incubated for 14 days. The colonies were then fixed in 4% formaldehyde and stained with 0.1% crystal violet. After staining, the colonies were counted and analyzed using ImageJ software.
Cell migration and invasion assays
Cell migration and invasion were measured using wound healing and Transwell assays. In the wound healing assay, 8 × 10⁵ cells were seeded into 6-well plates and allowed to adhere overnight. A linear scratch wound was then created using a micropipette tip, and the cells were treated with Vin for 48 h. Images of cell migration were captured at 0, 24, and 48 h. For the Transwell assay, 5 × 10⁴ cells in 100 µL of serum-free DMEM were placed in the upper chamber (8 μm, Corning, NY, USA) with or without Matrigel (BD Biosciences, Franklin Lakes, NJ, USA). The bottom chamber was filled with 500 µL of DMEM containing 30% FBS as a chemoattractant. After 12 and 24 h of Vin treatment, cells that had migrated or invaded were collected, fixed, and stained with crystal violet. The cells were then photographed using an inverted microscope, and the number of migrated cells was quantified using ImageJ software.
Reactive oxygen species (ROS) detection
Cellular ROS levels were measured by using the DCFH-DA ROS assay kit (Solarbio, Beijing, China) according to the manufacturer’s protocol. In short, A375, SK-MEL-28, and SK-MEL-5 cells treated with Vin were washed with buffer solution when the appropriate density was reached. Then, the cells were stained with 10 µM DCFH-DA at 37 ℃ for 30 min without light. After washing with buffer solution, the samples were detected by flow cytometry.
Comet assay
The comet assay was conducted according to the protocol provided by the manufacturer (Beyotime, Shanghai, China). Briefly, A375, SK-MEL-28, and SK-MEL-5 cells were treated with or without Vin for 24 h, followed by cell collection and washing with phosphate-buffered saline (PBS). A total of 104 cells in 10 µL were mixed with 75 µL of agarose. Transfer the mixture onto a comet slide (Beyotime) and let it solidify at 4 ℃ for 10 min. Cells were lysed at 4°C for 1 h and then subjected to dark electrophoresis using cold alkaline electrophoresis buffer for 30 min. The comet slide was incubated in a neutral buffer at 4°C for 10 min, followed by the removal of the buffer. The slide was stained with propidium iodide solution in the dark for 15 min and examined under a fluorescence microscope. Quantification was performed using CASP software.
Cell cycle and apoptosis analysis
To assess the impact of Vin treatment on melanoma cell cycle progression and apoptosis, A375, SK-MEL-28, and SK-MEL-5 cell lines were cultured in a complete medium and exposed to Vin at concentrations of 2.5 and 5 µM for 24 h. Following treatment, cells were harvested by trypsinization, washed with PBS, and fixed in 70% ethanol at -20 °C for at least 2 h. For cell cycle analysis, the fixed cells were stained with propidium iodide (PI) at 50 µg/mL in the presence of RNase A (100 µg/mL) to digest RNA. The cells were then incubated at 37 °C for 30 min in the dark. Cell cycle distribution was analyzed by flow cytometry using a BD FACSymphony, and the data were processed with FlowJo software. For apoptosis detection, treated cells were resuspended in a binding buffer and stained with Annexin V-FITC and PI, following the manufacturer’s protocol (Beyotime). Flow cytometric analysis was performed on a BD FACSymphony, and apoptotic cell percentages were determined based on Annexin V+PI− (early apoptosis) and Annexin V+PI+ (late apoptosis). All experiments were performed in triplicate, and results are presented as the mean ± standard deviation (SD).
RNA isolation and quantitative real-time PCR (qRT-PCR)
Total RNA from melanoma cells and Jurkat cells samples were extracted using MagZol reagent (Guangzhou, Guangdong, China) according to the manufacturer’s protocol, and cDNAs were synthesized using the Hifair® Ⅲ kit (Yeasen, Shanghai, China). Then, Quantitative real-time PCR assays were conducted using SYBR Green qPCR Master Mix (Selleck) with QuantStudio 3 Real-Time PCR System (Thermo Fisher Scientific) to assess the gene expression. The gene expression was normalized to β-actin mRNA expression using the ΔCt method (2–ΔΔCt) and expressed as a ratio relative to the untreated control. All primers used are listed in table S1a and table S1b.
Western blotting
As previously described [25]. The primary antibodies were diluted as follows: anti-p-ATM (1:1000, CST, #5883s, Boston, USA), anti-p-ATR (1:1000, CST, #2853s), anti-γH2AX (1:1000, CST, #9718s), anti-ATF3 (1:1000, Abcam, ab207434), anti-Bcl2 (1:1000, Proteintech, #12789, Chicago, USA), anti-BAX (1:1000, Proteintech, #50599), anti-Cleaved Caspase-3 (1:1000, CST, #9664S), anti-caspase-9 (1:1000, Proteintech, #66169), anti-p-JNK (1:1000, Proteintech, #80024), anti-JNK (1:200, Santa Cruz, sc-7345, Biotechnology, CA, USA), anti-p-ERK1/2 (1:1000, Proteintech, #28733), anti-ERK (1:1000, Proteintech, #11257), anti-p-P38 (1:1000, Proteintech, #28796), anti-P38 (1:200, Santa Cruz, sc-7972), anti-IL-24 (1:1000, Proteintech, #26772), anti-β-Actin (1:5000, Proteintech, #66009). The bands were visualized with a gel documentation system (Bio-Rad, Hercules, California, USA), and row values were quantified by ImageJ.
Transcriptome sequencing (RNA-seq)
RNA-seq was performed on cells treated with vinburnine (2.5 µM and 5 µM) and untreated controls, with three biological replicates per group. The analysis was conducted using Illumina technology by Wuhan Huada Gene Company. Genes with a fold change greater than 2 and a P-value below 0.05 were identified as differentially expressed.
Enzyme-linked immunosorbent assay (ELISA)
The levels of interleukin-24 (IL-24) in the cell culture supernatant (Solarbio) and tumor tissues from mice (Solarbio) were determined using a commercially available ELISA kit, following the manufacturer’s instructions.
Dual luciferase reporter assay
The IL-24 core promoter region was identified and cloned into the pGL3 Basic vector (Promega Corporation, Madison, WI, USA). TurboFect Transfection Reagent was used to transfect the plasmids according to the manufacturer’s instructions. At the same time, the cells were treated with or without Vin. The cells were collected 48 h post-transfection to assess luciferase activity. The measurement was performed using a dual luciferase reporter assay system (Promega Corporation) according to the manufacturer’s protocol, with results normalized to renilla luciferase activity.
Chromatin immunoprecipitation (ChIP)
SimpleChIP® Enzymatic Chromatin IP Kit (CST) was used to verify the interaction between ATF3 protein and IL-24 promoter. Briefly, SK-MEL-28 cells were treated with Vin (2.5 and 5µM) for 48 h. DNA and proteins were cross-linked by incubation with 1% formaldehyde at room temperature for 10 min, lysed and sonicated to obtain chromatin fragments. Then chromatin fragments with about 150–900 bp base pairs of DNA in size were prepared by sonication, incubated with IgG and anti-ATF3 (1:100, Abcam, ab207434) antibody overnight at 4 °C, and precipitated with protein G magnetic beads. After cross-linking reversal, qRT-PCR was used to detect the DNA template enrichment with the primers in Table S2.
In vivo experiments
All experimental procedures were performed in strict adherence to the National Research Council’s Guide for the Care and Use of Laboratory Animals. All animal studies were conducted with approval from the Ethics Committee at Xiangya Hospital, adhering to established ethical standards. Mouse melanoma B16F10 cells (5 × 10⁵ cells/mouse) were subcutaneously injected into 8-week-old C57BL/6 female mice (Hunan SJA Laboratory Anima, Changsha, Hunan, China). Once the tumor volume reached approximately 50–100 mm3, the mice were randomly assigned into the vehicle group (0.5% carboxymethylcellulose (CMC), Aladdin, Shanghai, China), Vin (10 mg/kg) and Vin (20 mg/kg) treatment groups. Vin was orally administrated once daily for 10 days.
For combination treatment, mice were treated with one of the following regimens: isotype antibodies, anti–PD-1 (Selleck), Vin (5 mg/kg) + isotype antibodies, Vin + anti–PD-1, rIL-24 (R&D Systems, Minneapolis, MN, USA), or rIL-24 + anti–PD-1. Vin was administrated orally once daily for 10 days, anti-PD-1 was given via intraperitoneal injection three times a week, and was injected intratumorally twice a week. Tumor growth was monitored every two days using caliper measurements, and the mice were euthanized once the tumor volume reached 1000 mm3. Tumor volumes (V) were calculated using the formula: V = [ width (mm) × length2 (mm2)] × 0.5.
To assess the role of ATF3 and IL-24 in Vin-induced antitumor effects, B16F10 cells stably transfected with shRNA targeting ATF3 or IL-24, along with corresponding non-targeting control cells, were subcutaneously injected into 8-week-old C57BL/6 female mice (5 × 10⁵ cells/mouse). Once the tumors reached 50–100 mm³, the mice were randomly divided into six groups: Mock + vehicle, Mock + Vin, shATF3 + vehicle, shATF3 + Vin, shIL-24 + vehicle, and shIL-24 + Vin treatment groups. Vin (10 mg/kg) was administered orally once daily for 10 days.
Isolation of PBMCs from healthy donor blood samples
Peripheral blood mononuclear cells (PBMCs) were isolated from blood obtained from a healthy donor, who provided informed consent for the study, via Ficoll-Paque density gradient centrifugation. Ten milliliters of whole blood, collected in an EDTA tube, were diluted with an equal volume of PBS. In a 50 mL centrifuge tube, 10 mL of separation medium was added, and the diluted blood sample was carefully layered on top, ensuring a clear interface between the two liquids. The tube was centrifuged at 800 × g for 30 min at room temperature, with a gradual acceleration to facilitate the separation of blood components. PBMCs, located at the interface between the plasma and the separation medium, were carefully aspirated using a sterile pipette. The collected PBMCs were transferred to a new 50 mL tube and washed twice with PBS by centrifuging at 250 × g for 10 min, discarding the supernatant after each wash. The final PBMC pellet was resuspended in RPMI-1640 medium as required for subsequent experiments.
Isolation of mouse PBMCs and CD8+ T cells
Mouse PBMCs were isolated from the spleens of 8-week-old C57BL/6 mice using a mouse lymphocyte isolation solution (DAKEWE, Shenzhen, Guangdong, China), following the manufacturer’s protocol. CD8+ T cells were subsequently purified from the PBMCs using the EasySep™ Mouse CD8+ T Cell Isolation Kit (STEMCELL, Shanghai, China), with a separation efficiency exceeding 95%, as verified by flow cytometry. The isolated CD8+ T cells were cultured in complete medium consisting of RPMI-1640, 10% FBS, 1% HEPES, 1% NEAA, 1% sodium pyruvate, 1% penicillin/streptomycin, 55 µM β-mercaptoethanol (β-ME), and 50 IU/mL recombinant mouse interleukin-2 (mIL-2). For activation, cells were treated with Dynabeads® Mouse T-Activator CD3/CD28 (Thermo Fisher Scientific).
Flow cytometry analysis
For analysis of the number and function of tumor-infiltrating immune cells, divest tumor tissue from euthanized mice and prepare a single-cell suspension. Divide each sample into two groups (innate immune cells and lymphocytes), and mix at least 10% of the samples with other samples for control, such as fluorescence subtraction one (FMO), single staining, and unstained groups. The samples were removed into a U-bottom 96-well plate and treated with Zombie Aqua™ dye (1:500, Biolegend, #423102, San Diego, CA, USA) for 15 min at room temperature in PBS followed by a wash with PBS. Then, the samples were incubated for 10 min at 4℃ with anti-CD16/CD32 to block Fc receptors (1:500, Biolegend, #101320). The samples were stained with surface markers antibody for 30 min at 4 °C in the dark, followed by washing with PBS. Subsequently, according to the manufacturer’s instructions, intracellular markers were stained with the eBioscience FOXP3 Transcription Factor Staining Buffer Set (Invitrogen, California USA). The following markers were used for immune cell characterization: CD3 for T cells; CD4 and CD8a for T cell subsets; MHC-II and F4/80 for M1 macrophages; CD206 and F4/80 for M2 macrophages; NK1.1 for NK cells; Foxp3 for regulatory T cells (Tregs); and CD45 to identify total leukocytes. Flow cytometry data were acquired on a 5 laser BD LSRFortessa™ X-20 system and analyzed using FlowJo 10.8.1 software (BD). The specific antibody clones and sources used for mouse and human cells are provided in Table S3.
A Transwell system was used to analyze the function of CD8+ T cells in PBMCs co-cultured with Vin-treated melanoma cells. Vin-treated melanoma cells were placed in the upper chamber, while PBMCs were seeded in the lower chamber. After 24 h of co-culturing, the PBMCs were harvested for staining and subsequent flow cytometry analysis.
In vitro killing assays
In vitro tumor-killing assays were conducted using the Luciferase Assay System (Promega Corporation). The A375-luciferase and B16F10-luciferase melanoma cell lines were generated via lentiviral transduction and purified using fluorescence-activated cell sorting (BD FACSymphony™ S6, USA). The luciferase-expressing melanoma cells were seeded into 96-well black flat-bottom plates (Greiner, Pleidelsheim, Baden-Württemberg, Germany) at a density of 8 × 10³ cells per well, with or without Vin treatment. PBMCs were added to the wells at effector-to-target (E: T) ratios of 2.5:1 for human cells and 10:1 for mouse cells, or CD8+ T cells were added at an E: T ratios of 5:1 for mouse cells. The cells were then incubated for 24 h. After incubation, the supernatant was removed, and the cells were washed twice with PBS. Cells were lysed with 20 µL/well 1 × lysis buffer (Promega) on freeze-thaw cycle twice, then mixed with 20 µL/well luciferase reagent. Luminescence was measured using a BioTek Cytation 1 reader. Tumor cells without any treatment served as a negative control.
Immunohistochemistry staining
After euthanizing mice bearing B16F10 tumor, tumor tissue was isolated, fixed with 4% paraformaldehyde, and subsequently embedded in paraffin. Immunohistochemistry staining was carried out according to the method described in reference [26]. Rabbit polyclonal Ki67 antibody (1:200, Servicebio, #GB111141, Wuhan, Hubei, China), and rabbit monoclonal IL-24 antibody (1:200, Proteintech, #26772) were used as primary antibodies and incubated overnight at 4 °C. We used an antibody diluent (ZSGB-BIO, Beijing, China) instead of the primary antibody as the negative control.
Immunofluorescence staining
For in vitro staining, cells were seeded on sterile glass coverslips in 24-well plates and treated with Vin for 24 h. After PBS wash, cells were fixed with 4% paraformaldehyde for 10 min and permeabilized with 0.2% Triton X-100 for 5 min. After blocking with 3% BSA for 1 h, cells were incubated with anti-γH2AX antibody (1:100, CST, #9718s) overnight at 4 °C. After washing with PBST (0.1% Tween-20 in PBS), fluorophore-conjugated secondary antibodies (Alexa Fluro 488 donkey Anti-rabbit, Invitrogen) were applied for 1 h in the dark. Nuclei were counterstained with DAPI and coverslips were mounted with antifade mounting medium.
For tissue staining, formalin-fixed, paraffin-embedded tumor sections were deparaffinized in xylene and rehydrated through a graded ethanol series. Antigen retrieval was performed by heating sections in citrate buffer (pH 6.0) for 10 min. After cooling and washing, sections were blocked with 5% normal serum for 1 h at room temperature and incubated with anti-ATF3 antibody (1:100, Abcam, ab207434) overnight at 4 °C. After washing, sections were incubated with fluorophore-conjugated secondary antibodies for 1 h in the dark. Nuclei were counterstained with DAPI and sections were mounted using antifade mounting medium. Fluorescence images were captured using a fluorescence microscope.
Statistical analysis
Statistical analysis was performed using GraphPad Prism 8.0 software. Data are expressed as mean ± standard deviation (SD), and comparisons between groups were made using either a t-test or an ordinary one-way ANOVA. A p-value of less than 0.05 was considered statistically significant in all experiments.


Comments (0)