
Remember me


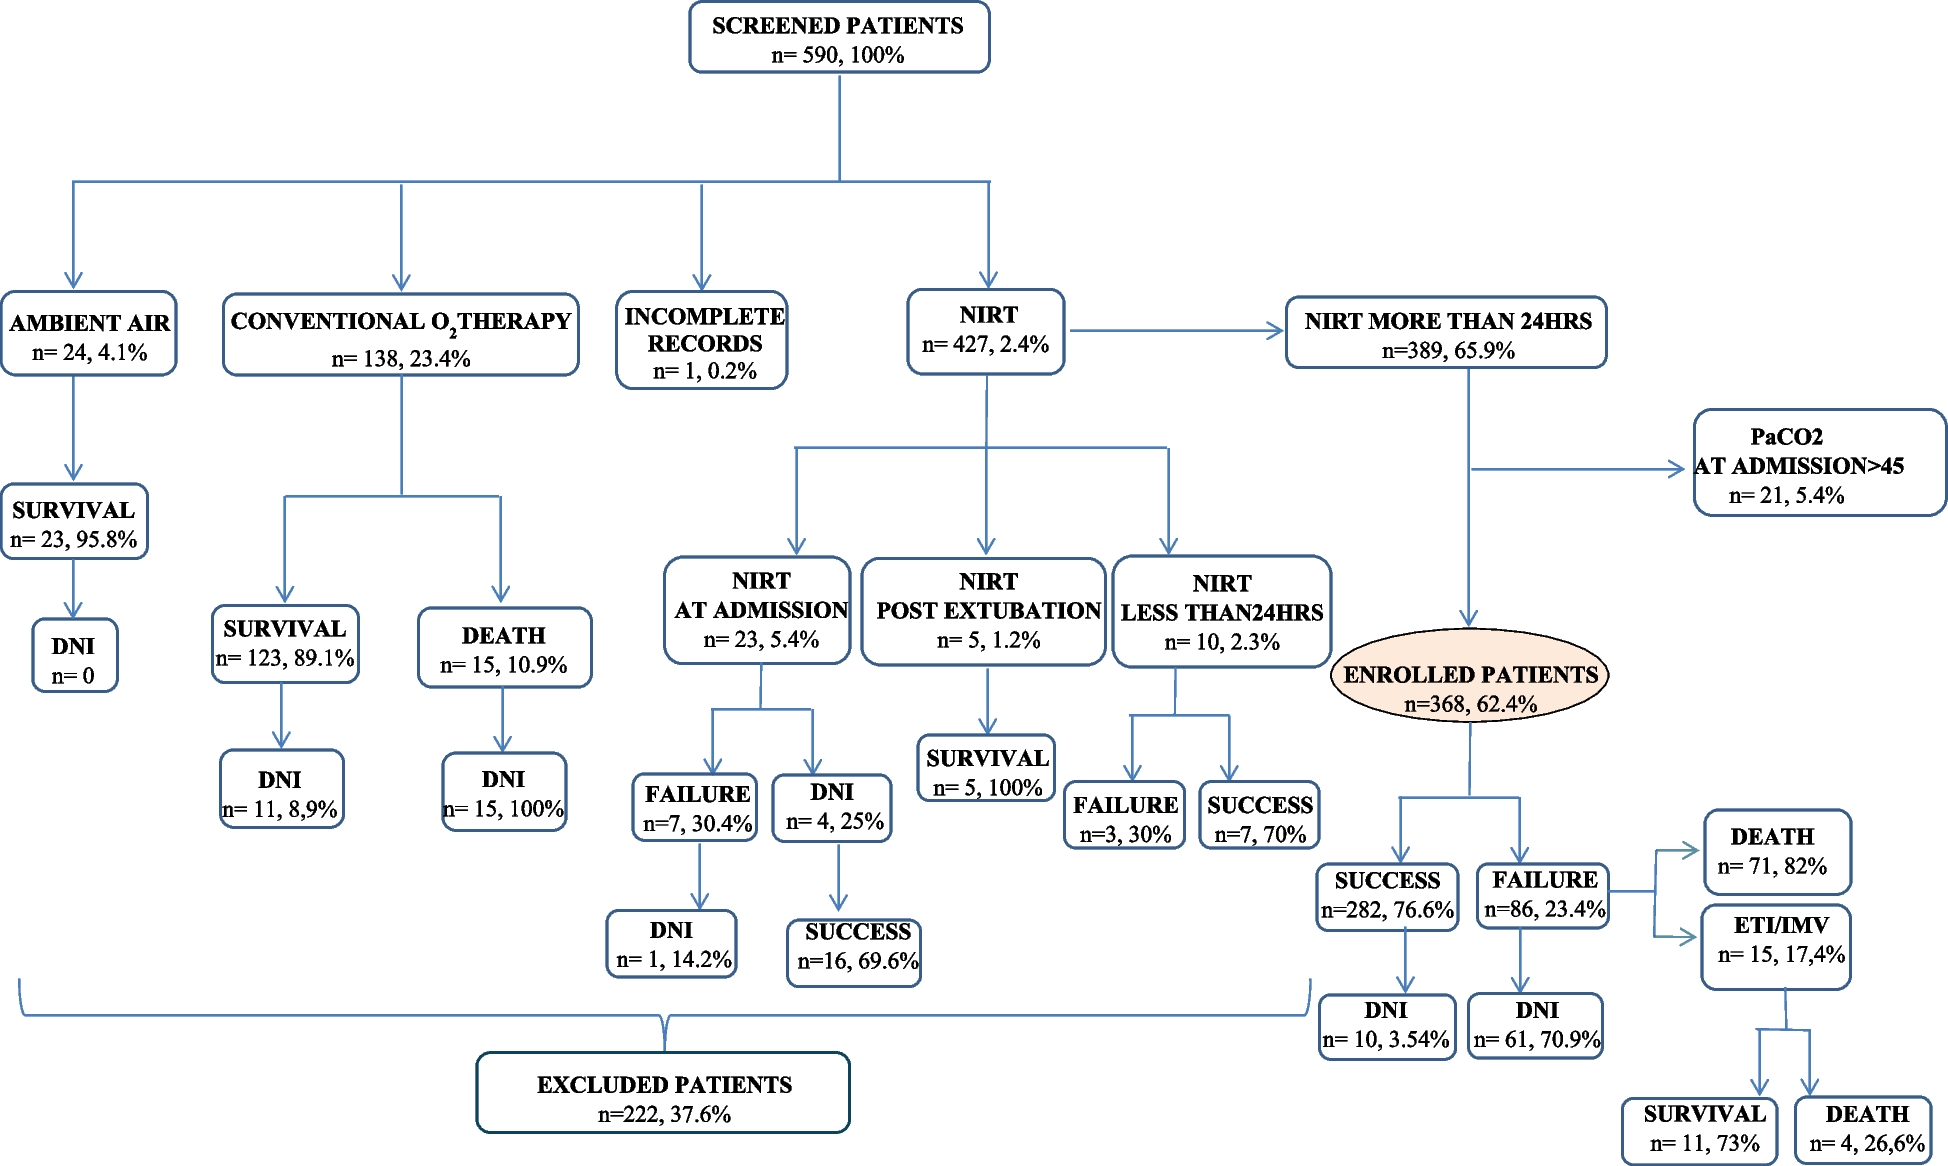

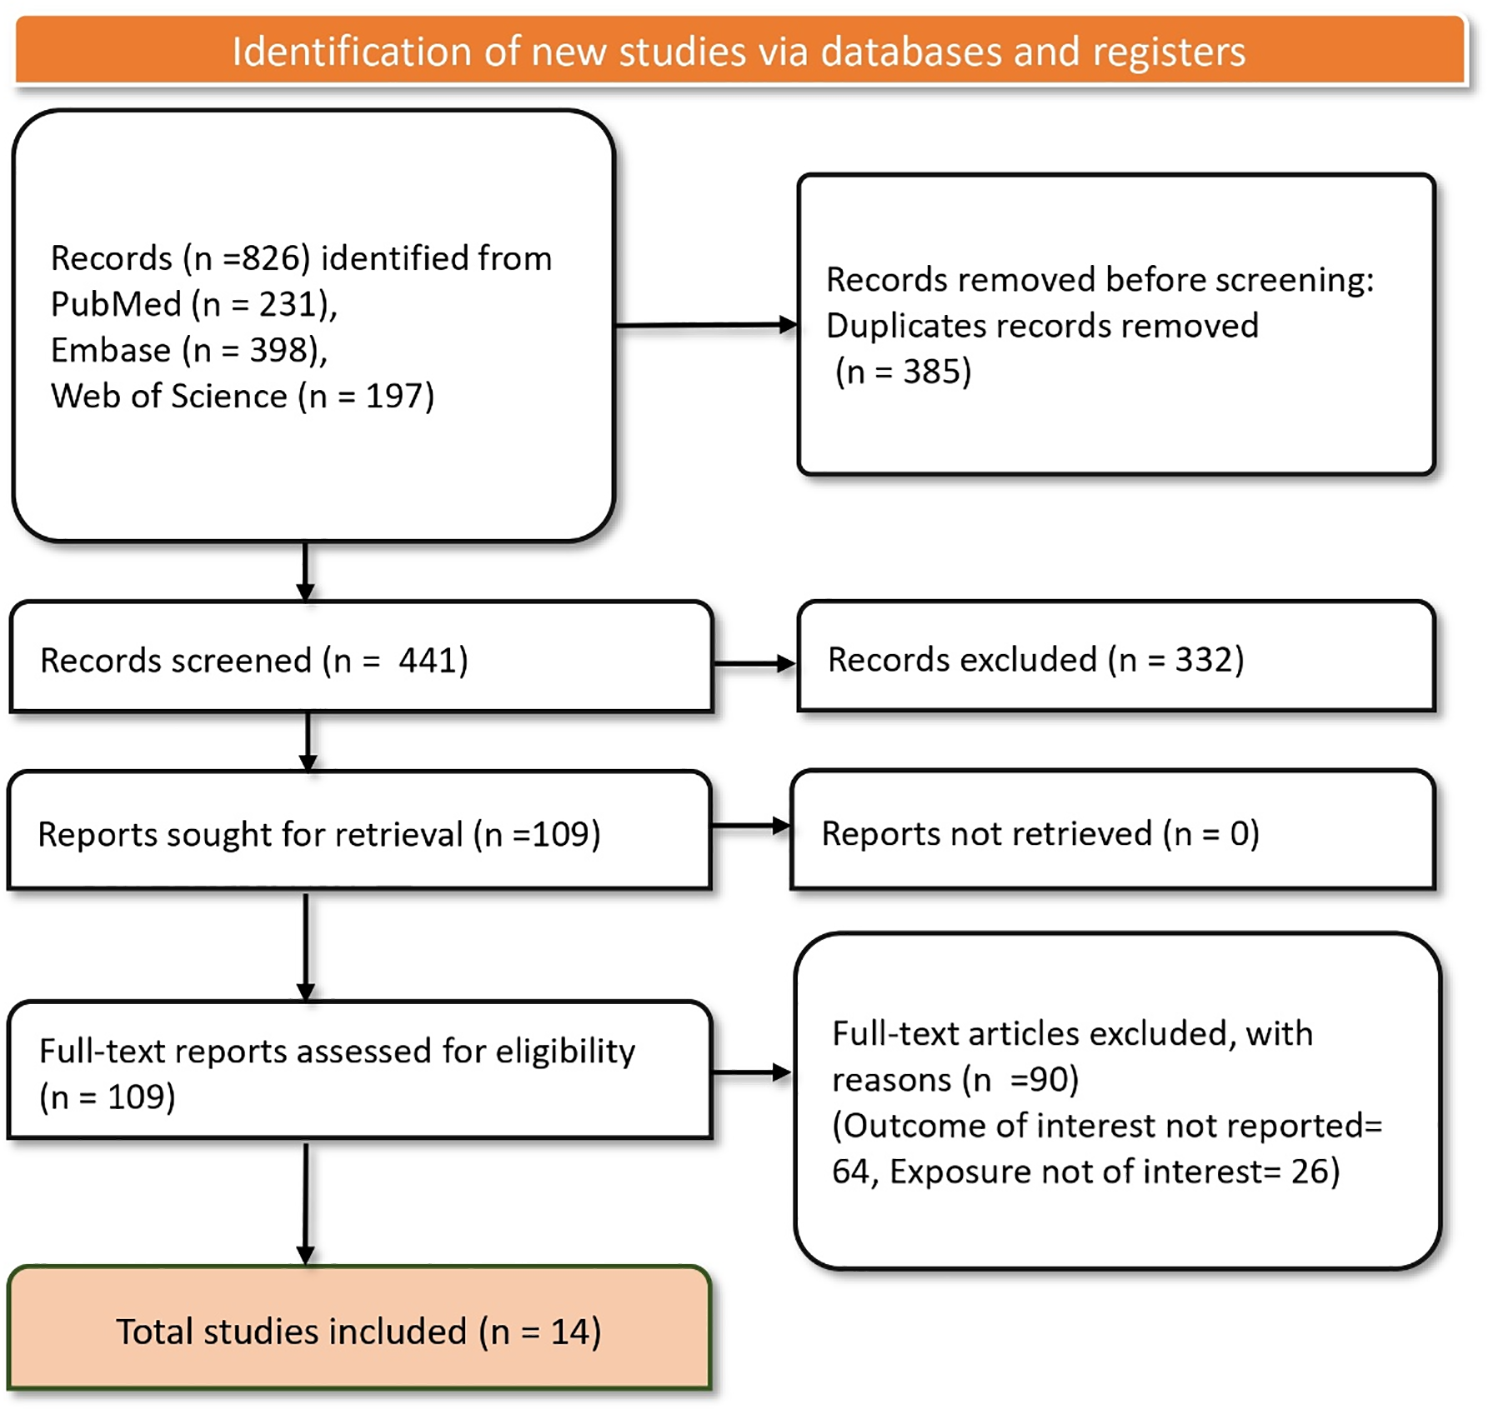
Of the 744 patients enrolled in the prospective studies, 412 CAP patients met the inclusion criteria for this analysis (Fig. 1). Among these, 136 (33%) had a pre-existing diagnosis of COPD, while 276 (67%) did not. Among the COPD patients, 33 patients (24%) had documented spirometry result consistent with GOLD stage 1 or 2, 62 (46%) with GOLD stage 3 or 4, and 41 (30%) lacked a recorded GOLD stage.
Fig. 1
Study flowchart. Legend: The flowchart depicts the selection process for patients included in the study and reasons for exclusion. Abbreviations: COPD – Chronic Obstructive Pulmonary Disease. CAP – Community-Acquired Pneumonia. LRT – Lower Respiratory Tract
Significant differences were observed between COPD and non-COPD patients. COPD patients were older, had a higher burden of comorbidities, and presented with greater severity scores at admission compared to non-COPD patients (Table 1). Additionally, a larger proportion of COPD patients were current or former smokers.
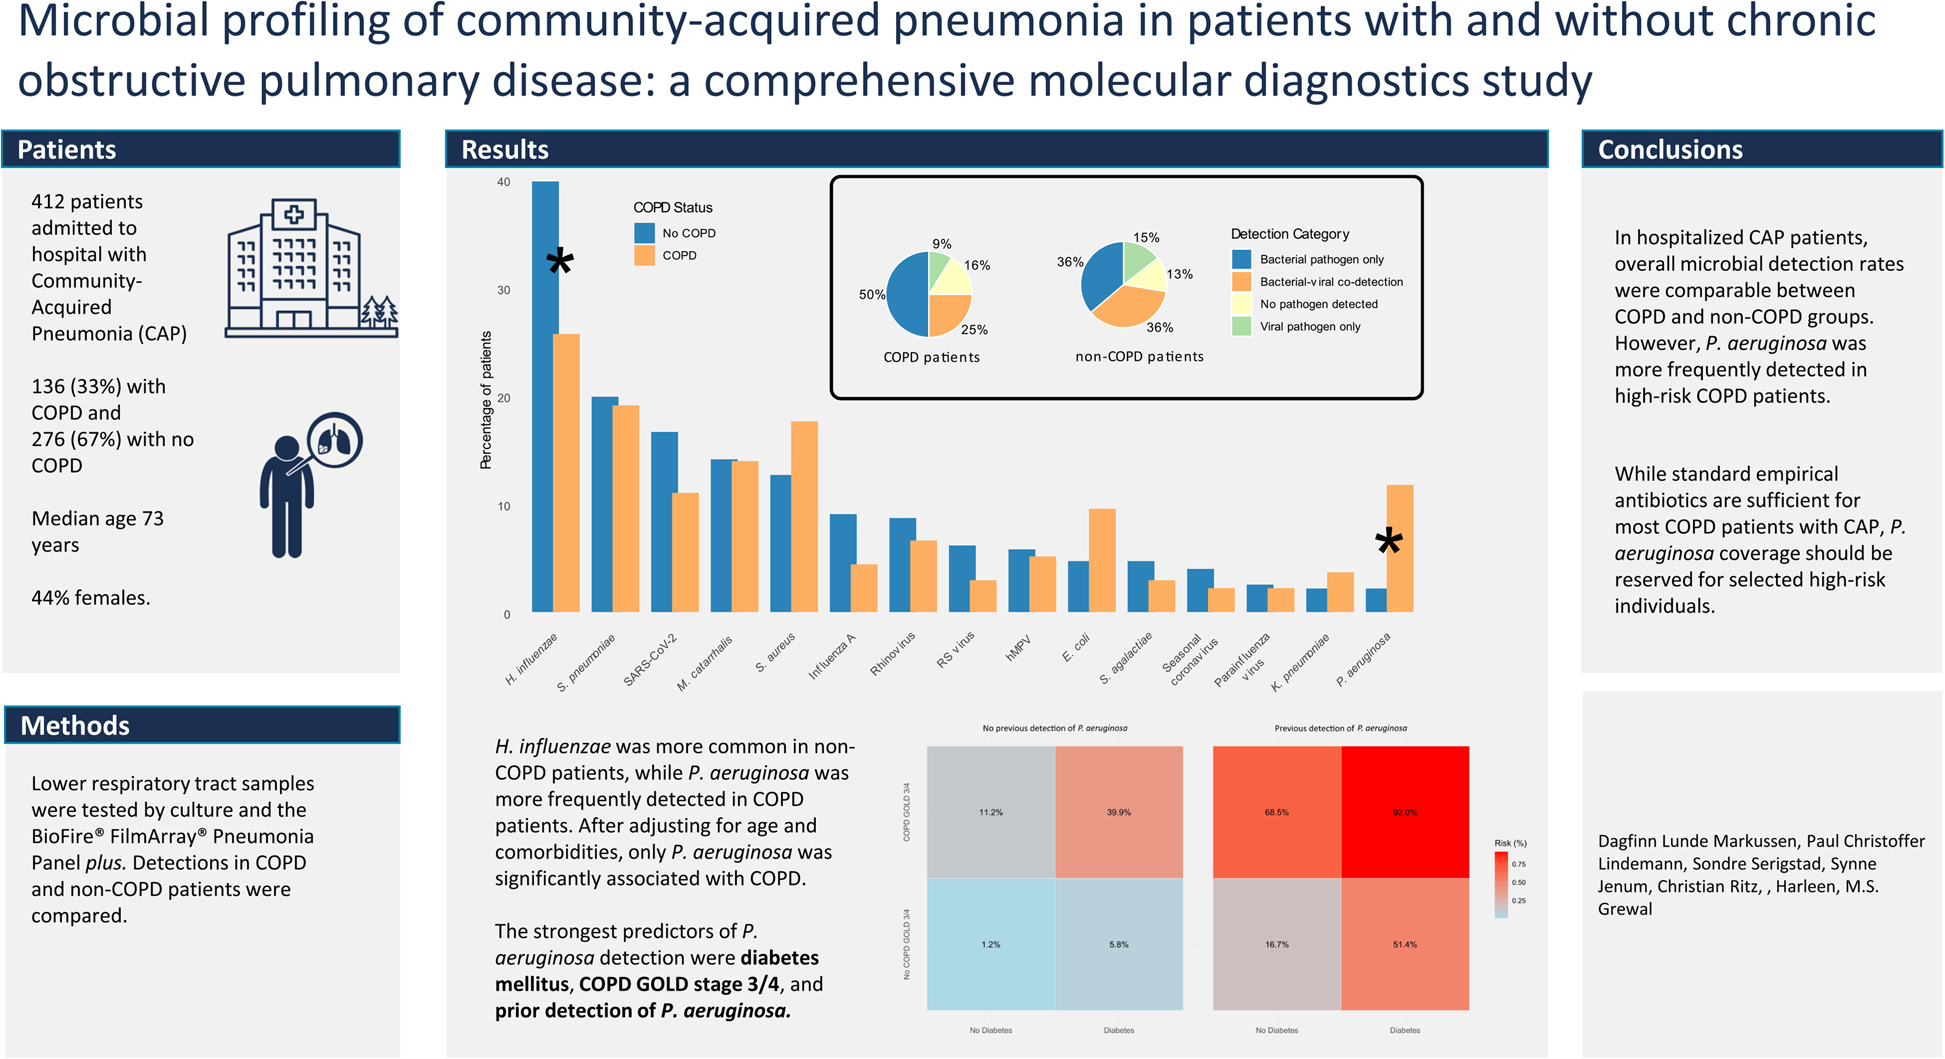
Table 1 Baseline characteristics of included patientsIn univariate analyses, P. aeruginosa was significantly more prevalent in COPD patients compared to non‐COPD patients (RR = 5.4, 95% CI: 2.2 to 13.5), whereas H. influenzae was more commonly detected in non‐COPD patients (RR for COPD: 0.7, 95% CI: 0.5 to 0.9). Detection rates of other bacteria or respiratory viruses did not differ significantly between the groups (Table 2, Fig. 2, Supplementary Table S1). Additionally, E. coli tended to be more frequently detected in COPD patients (RR = 2.0, 95% CI: 1.0 to 4.3; p = 0.06) and was therefore included in the multivariate analyses, one analysis per pathogen (P.aeruginosa, H.influenzae, E.coli), that corrected for age and comorbidities (mCCI).
Fig. 2
Detection rates of pathogens in COPD and non-COPD patients. Legend: The bar chart shows the percentage of patients with detected pathogens, with blue bars representing non-COPD patients and orange bars representing COPD patients. Asterisks (*) indicate statistically significant differences (p < 0.05) between the two groups. Statistical significance was determined using Fisher's exact test or chi-square test, depending on the expected cell counts. The pie charts illustrate the distribution of detection categories among COPD (left) and non-COPD (right) patients. Abbreviations: COPD—Chronic Obstructive Pulmonary Disease. SARS-CoV-2 – Severe Acute Respiratory Syndrome Coronavirus 2. RS virus—Respiratory syncytial virus. hMPV—Human metapneumovirus
In these multivariate analyses, COPD remained strongly associated with the detection of P. aeruginosa (RR = 4.8, 95% CI: 1.9–12.3), whereas adjusting for age and the mCCI, no significant associations were found between COPD and the detection of E. coli or H. influenzae. Detection of E. coli was significantly associated with increasing age, with a risk ratio of 1.03 (95% CI: 1.00–1.08) per additional year. Conversely, the detection of H. influenzae was inversely associated with mCCI, with a risk ratio of 0.91 (95% CI: 0.85–0.98) per one-point increase in the score. Detailed results are presented in Table 3.
Table 3 Poisson regression models of associations between COPD status and pathogen detection adjusted for age, comorbidities, and CURB-65 scoreAnalyses of risk factors for detection of Pseudomonas aeruginosaAs P. aeruginosa was the only microbe independently associated with COPD, we further investigated factors influencing its detection, both thorough univariate and multivariate analyses. A Poisson regression model was developed, incorporating key variables including age, COPD GOLD stage 3–4, mCCI score, diabetes mellitus, inhaler use, bronchiectasis, prior P. aeruginosa detection, and recent hospital admission. To enhance clinical interpretability, we then fitted a logistic regression model focusing on the three strongest predictors—COPD GOLD stage 3–4, diabetes mellitus, and prior P. aeruginosa detection—to estimate the probability of P. aeruginosa detection based on these key factors.
In the univariate analyses, patients with P. aeruginosa detection were more likely to have COPD (73% vs. 31%, p < 0.001), particularly GOLD stage 3–4 (55% vs. 13%, p < 0.001), and bronchiectasis (27% vs. 6.2%, p = 0.003). They were older (median age 77 vs. 72 years, p = 0.014) and more likely to use inhalators (86% vs. 38%, p < 0.001) and oral steroids (36% vs. 14%, p = 0.010). Additionally, these patients had higher Charlson Comorbidity Index scores (median 4 vs. 3, p = 0.009), more hospitalizations in the past year (82% vs. 42%, p < 0.001), and higher rates of recent nursing home admission (32% vs. 10%, p = 0.006). Detailed results are presented in Supplementary table S2.
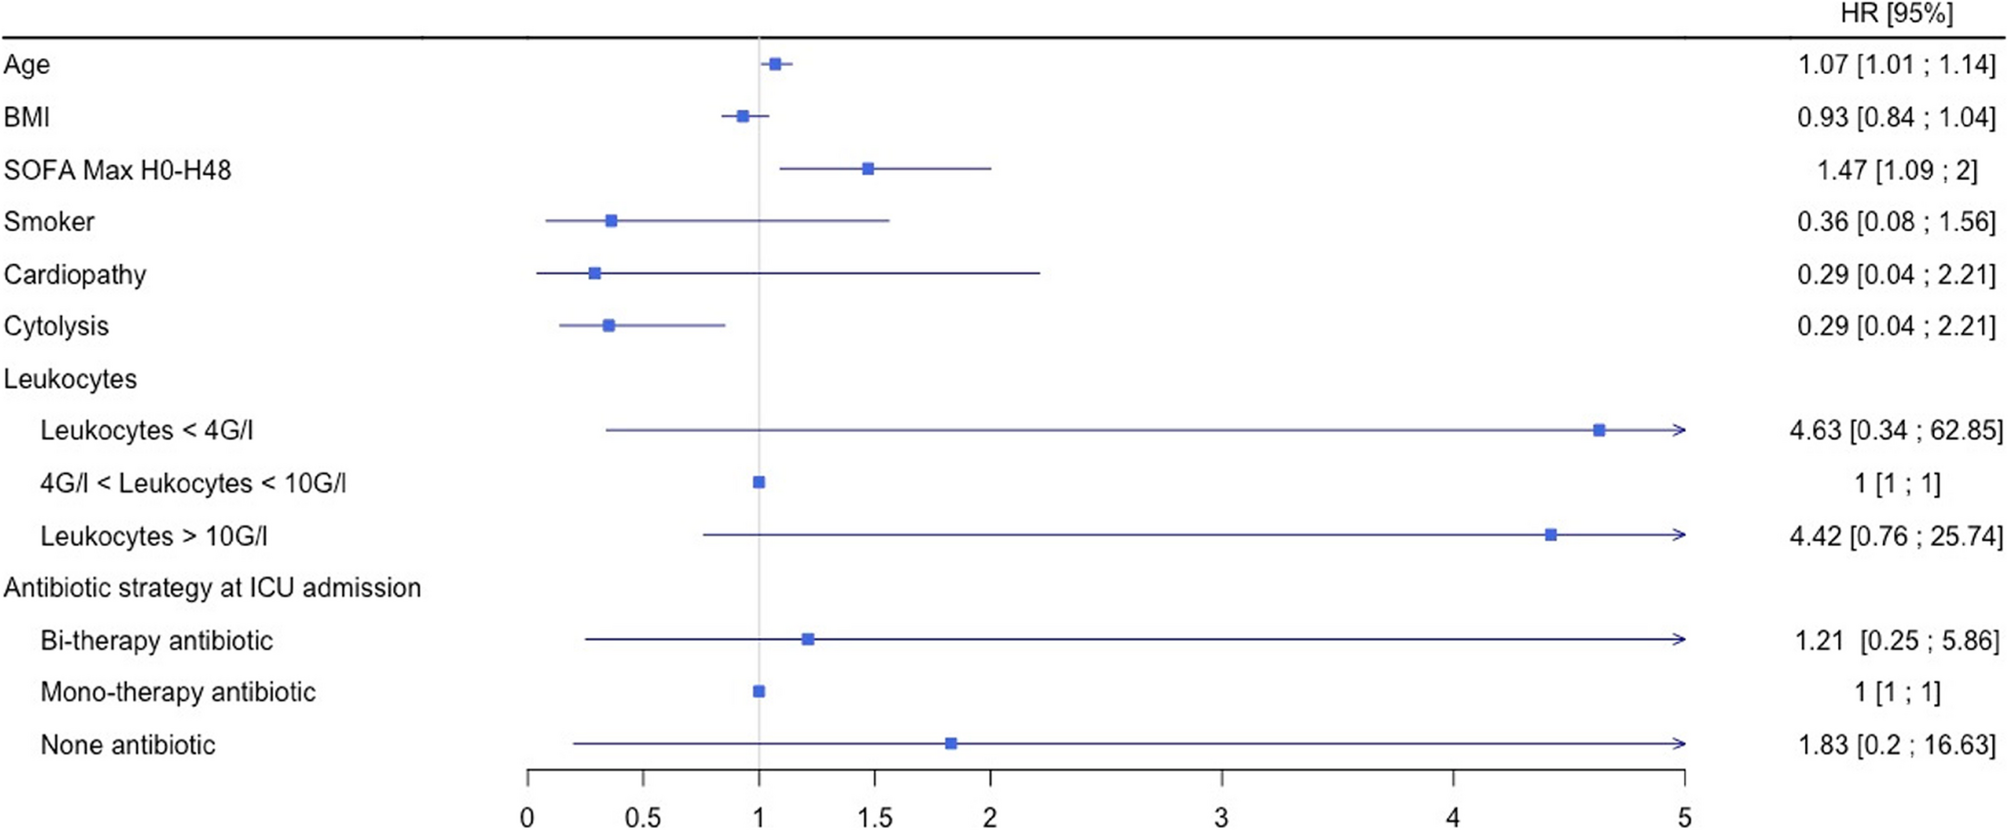
In the Poisson regression model, significant predictors for P. aeruginosa detection included age (RR = 1.05, 95% CI: 1.01–1.09), COPD GOLD stage 3–4 (RR = 4.29, 95% CI: 1.94–9.46, p < 0.001), diabetes mellitus (RR = 4.04, 95% CI: 1.97–8.29, p < 0.001), the modified Charlson Comorbidity Index (mCCI; RR = 0.80, 95% CI: 0.69–0.92, p = 0.002), and previous detection of P. aeruginosa (RR = 5.03, 95% CI: 2.44–10.36, p < 0.001). Use of inhalers, the presence of bronchiectasis, and hospital admission within the past year were not significantly associated with the detection of P. aeruginosa. Full results in Supplementary Table S3. These findings, including the relative risks and 95% confidence intervals, are illustrated in Fig. 3.
Fig. 3
Forest plot of relative risks for Pseudomonas aeruginosa detection. Legend: This forest plot displays the relative risks (RRs) for the detection of Pseudomonas aeruginosa in patients with community-acquired pneumonia. RRs were estimated using a Poisson regression model. For categorical variables (e.g., COPD GOLD stage 3 or 4, diabetes mellitus, inhalator use, bronchiectasis, hospital admission in the past year, and previous detection of Pseudomonas aeruginosa), the RR represents the relative risk of detection when the variable is present compared to absent. For continuous variables (age and mCCI score), the RR represents the effect of a one-unit increase (one year for age, one point for mCCI score). The horizontal lines represent 95% confidence intervals for each RR, and the vertical line at RR = 1 denotes no association. Points to the right of this line indicate an increased risk, while points to the left indicate a reduced risk. Abbreviations: COPD – Chronic Obstructive Pulmonary Disease. GOLD – Global Initiative for Chronic Obstructive Lung Disease. mCCI – Modified Charlson Comorbidity Index (excluding points for pulmonary disease)
In the logistic regression model, the probability of P. aeruginosa detection was calculated using the three strongest predictors: COPD GOLD stage 3–4, diabetes mellitus, and previous detection of P. aeruginosa (all binary variables). When none of these predictors were present, the probability of detecting P. aeruginosa was 1.2%. In contrast, the probability increased dramatically to 92.0%. when all three were present. Figure 4 illustrates the probabilities associated with all possible combinations of these predictors, providing a comprehensive overview of risks based on their presence or absence.
Fig. 4
Heatmap of predicted risk for Pseudomonas aeruginosa detection. This heatmap illustrates the predicted probabilities of Pseudomonas aeruginosa detection for different combinations of three predictors: prior detection of Pseudomonas aeruginosa, presence of COPD GOLD stage 3 or 4, and diabetes mellitus. The probabilities were calculated using a logistic regression model with a logit link function. The model included the three predictors as independent variables. Each cell in the heatmap represents the predicted probability (converted from log-odds) for a unique combination of these predictors. The color gradient reflects the risk, ranging from low (blue) to high (red). Numeric values within each cell indicate the exact predicted probability of detection as a percentage. Abbreviations: COPD – Chronic Obstructive Pulmonary Disease. GOLD – Global Initiative for Chronic Obstructive Lung Disease
Comments (0)