
Remember me

To investigate the epidemiology of VREF in Italy, we conducted a retrospective observational study analysing data from the AR-ISS database (2015–2023) [15].
AR-ISS, coordinated by the Istituto Superiore di Sanità (ISS, the Italian National Institute of Health), was established in 2001. It collects antimicrobial susceptibility data from sentinel hospital-based microbiology laboratories across Italy and contributes to EARS-Net (European Antimicrobial Resistance Surveillance Network), coordinated by the European Centre for Disease Prevention and Control (ECDC), by providing resistance data on key bacterial pathogens isolated from blood and cerebrospinal fluid.
Laboratories involved in this surveillance are chosen by the twenty-one regional health authorities, as outlined in the Italian National Action Plan on Antimicrobial Resistance (PNCAR) [17]. AR-ISS was officially recognized as a national surveillance system by the Decree of the President of the Council of Ministers (DPCM, March 3, 2017) [18]. The protocol was updated in January 2019 to improve performance through regional surveillance networks and is reviewed annually with the aim of implementing and improving national surveillance, in compliance with the objectives of the PNCAR [15]. The number of participating laboratories increased from 46 laboratories in 2015, to 197 laboratories in 2023, covering 66% of annual hospitalization days [15].
Participating laboratories send annually data (i.e., in the period February-April) on isolates and antibiotic susceptibility of the previous year from routine blood and cerebrospinal fluid samples for eight bacterial species of public health concern: Gram-positive (Staphylococcus aureus, Streptococcus pneumoniae, Enterococcus faecalis, E. faecium); Gram-negative (Escherichia coli, Klebsiella pneumoniae, Pseudomonas aeruginosa, Acinetobacter spp). Since 2024, laboratories have also been required to report data from routine urine samples for two bacterial species: E. coli and K. pneumoniae. Collected data include patient variables (identification code, age, sex, hospital admission date, ward, and sample type). To minimize bias due to multiple isolates from the same patient during a single disease episode, laboratories are instructed to submit only the first result for patient, per specimen type, and per pathogen for each surveillance year. Multi-pathogen isolates were also included.
Antimicrobial susceptibility testing followed EUCAST (European Committee on Antimicrobial Susceptibility Testing) clinical breakpoints [20]. Isolates with intermediate susceptibility were classified as susceptible, while resistance to an antimicrobial class is defined as resistance to at least one antibiotic of that class. Data were processed annually using WHONET (Microbiology Laboratory Database Software) [19].
Selection of E. faecium isolatesWe extracted E. faecium data from the AR-ISS surveillance system for the period 2015–2023. We selected all isolates of bloodstream origin that had been tested for vancomycin resistance.
For the risk factor analysis, we focused on the most recent period (2022–2023) and included only hospitalized individuals aged ≥ 18 years. Isolates were excluded if they had missing information for at least one of the included variables or were associated with an invalid hospital code. A hospital code was considered invalid if it did not correspond to a public or private hospital listed in the national hospital registry during the study period. In some cases, hospital codes could not be linked to a specific facility due to regional policies or laboratory reporting choices. For example, in the Emilia-Romagna region, hospital codes were anonymized before submission to the surveillance system, preventing identification of specific hospitals.
Outcome and co-variablesThe primary outcome of the study was the proportion of VREF isolates among all E. faecium isolates, expressed as a percentage. A strain was classified as vancomycin-resistant if it was non-susceptible according to EUCAST breakpoints.
Patient-level variables included the year of sampling, season (winter: December–February, spring: March–May, summer: June–August, autumn: September–November), sex (male or female), age group (18–39, 40–59, 60–79, or ≥ 80 years), geographic region (North-East, North-West, Central, South-Islands based on nomenclature of territorial units for statistics (NUTS1) areas for Italy [21]) and hospital unit (Surgical unit, Emergency unit, Medical unit comprising Internal Medicine, Infectious Diseases, and Oncology, Intensive Care Unit, or Other). The latter category comprises wards such as geriatrics, long-term care, rehabilitation, thermal medicine, and units for detained patients. To account for structural differences between healthcare facilities, we incorporated hospital-level indicators derived from hospital discharge registry [16]. These included the number of hospital beds, classified into two categories (< 400, > 400), and the average length of stay of the admitted patients (aLOS), categorized as 0–8, 9–10, or > 10 days, reflecting the average duration of hospitalization. Additionally, we considered the turnover index, which represents the number of patients occupying the same bed over one year (ratio between the number of hospitals stays and the number of beds) and was classified into 0–25, 26–40, or > 40. The bed occupancy rate, calculated as the percentage of occupied bed-days relative to the total available bed-days, was divided into < 75%, 75%–84%, and ≥ 85%. Lastly, we included the turnover interval, which quantifies the time a hospital bed remains vacant between discharges, categorized as < 1, 1–3, or > 3 days.
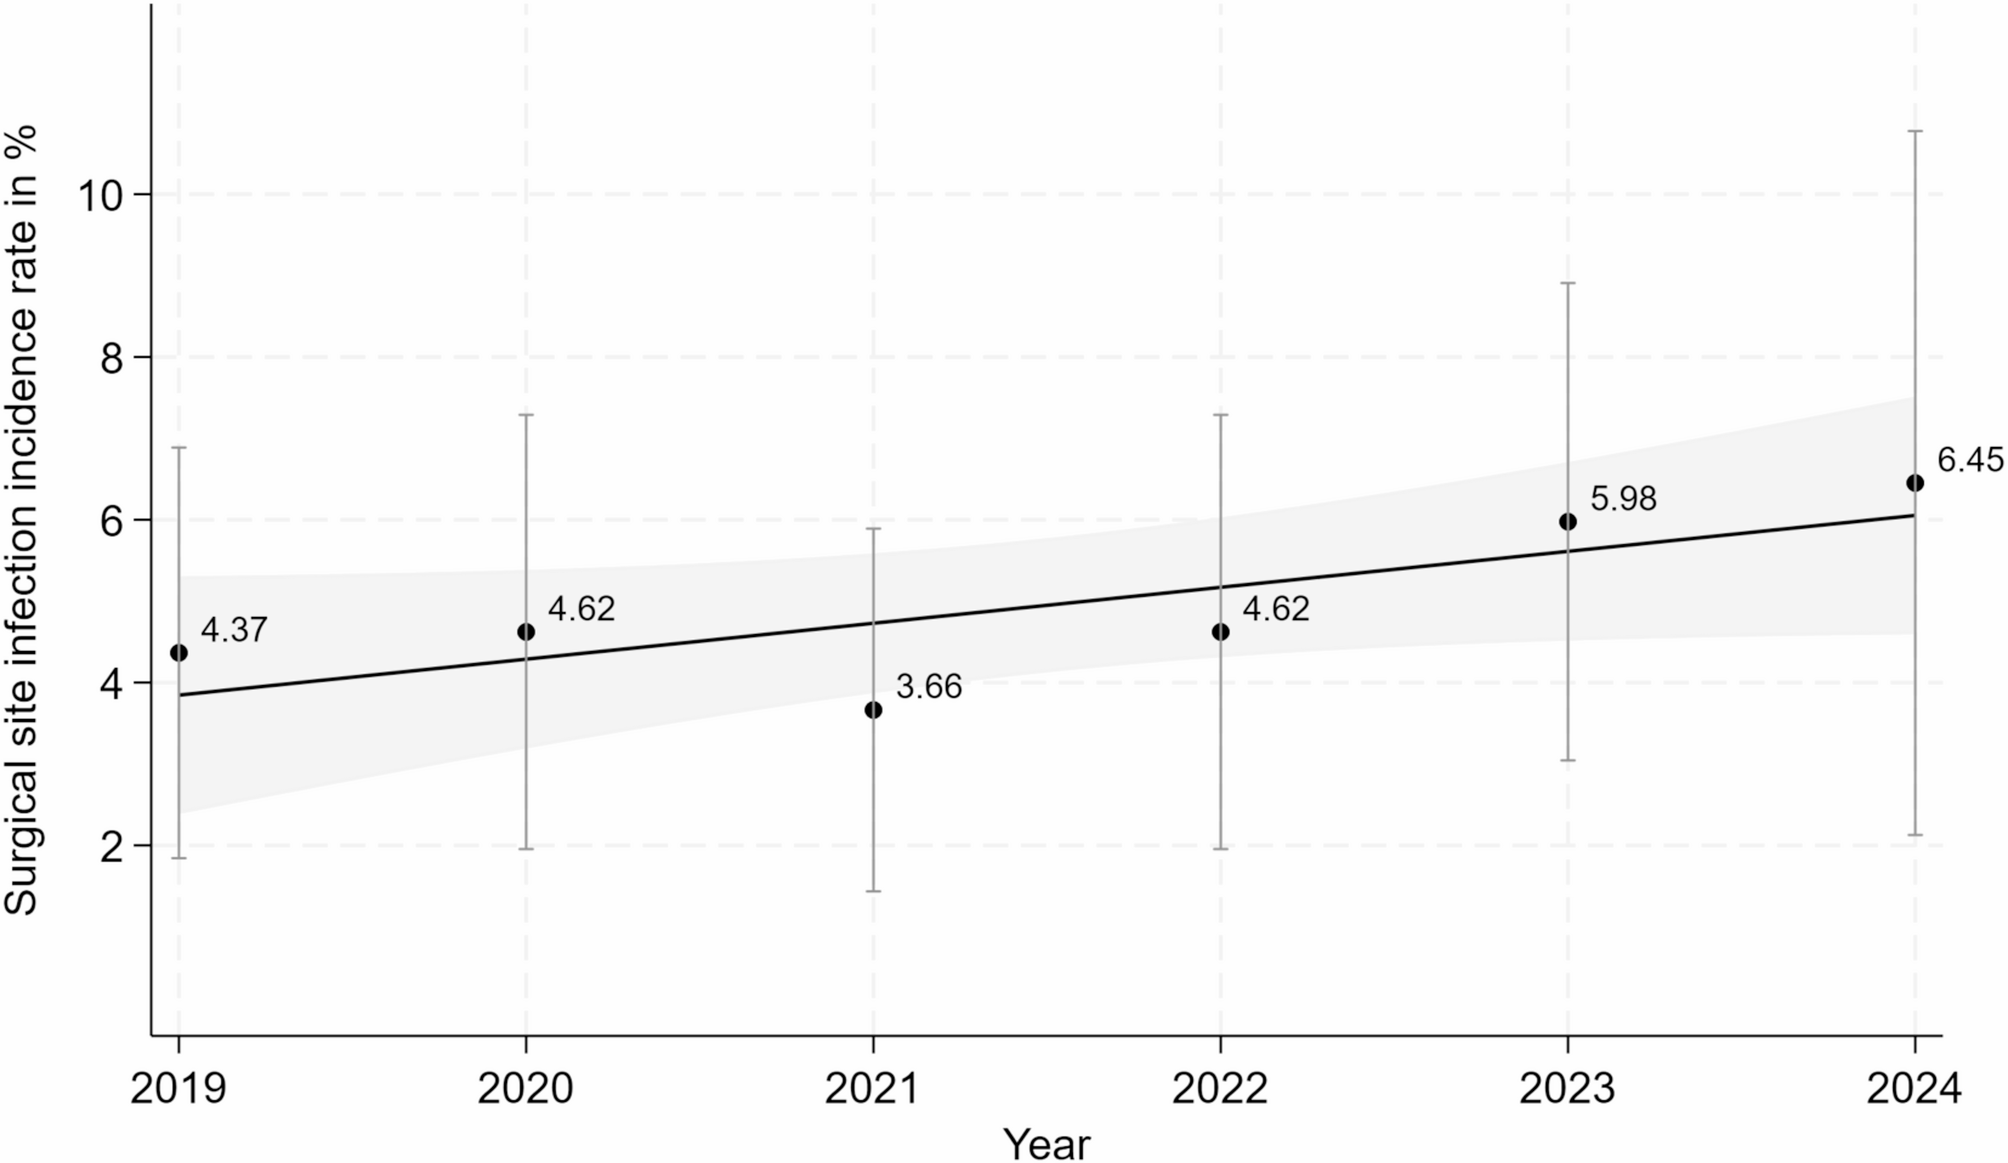
Statistical analysisTime trend analysisTo estimate the proportions of VREF over time, we used a mixed-effects logistic regression, with VREF presence as the dependent variable and year of sampling as the predictor. The model included a random intercept for each hospital to account for clustering at the facility level. Time was modelled as a continuous variable using natural cubic splines to capture potential non-linear trends.
We computed marginal predictions to estimate the average probability of VREF across the distribution of random effects (hospital variation). Additionally, a separate analysis was conducted at the macro-area level (North-East, North-West, Central, and South-Islands) to assess geographic variations in VREF probability over time.
To evaluate the robustness of our findings, we performed several sensitivity analyses. Since hospital and laboratory participation in AR-ISS may vary over time, we conducted two separate analyses: (1) including hospitals with at least 6 years of participation between 2015 and 2023, and (2) including those with at least 8 years of participation.
Evaluation of individual and hospital characteristics associated to VREFTo identify risk factors for VREF, we applied both univariable and multivariable mixed-effects logistic regression models, considering the hospital as a random intercept and VREF presence as the dependent variable. Given the high prevalence rates observed in 2022 and 2023, and in light of existing literature showing that odds ratios (ORs) can overestimate the effect size under high prevalence conditions, we also estimated prevalence ratios (PRs) using a Cox regression model with random effects and equal follow-up time for all subjects [22–23]. Since the ORs and PRs obtained from both univariable and multivariable analyses were very similar, results from the Cox regression are reported in the Supplementary Materials only.
At the patient level, the following predictors were considered: sampling year, season, gender, age group, hospital unit and geographic region. In order to create a more homogeneous class, Other was included into Medical unit. At the hospital level, predictors included: number of hospital beds, aLOS, turnover index, bed occupancy rate, and turnover interval.
To refine the multivariable model, we used stepwise selection, sequentially removing non-significant variables based on the likelihood ratio test using a significance level of 0.2. The final model retained only age group, hospital unit, geographic region, number of hospital beds and aLOS.
To assess whether the effect of specific patient- or hospital-level characteristics varied across geographical areas, we initially fitted four separate mixed-effects logistic regression models, each including an interaction term between geographical area and one of the selected variables (age group, hospital unit, hospital size, and length of stay). However, none of the interaction terms significantly improved model fit, as evaluated using Likelihood Ratio Tests. Therefore, for the sake of parsimony and interpretability, the final models and predicted probabilities across geographical areas, stratified by patient and hospital-level characteristics, were derived from the main effects model.
For univariable and multivariable models, Ors with 95% confidence intervals (CIs) were estimated, and statistical significance was assessed using the Wald test. All analyses were conducted in R (version 4.1.2). Statistical significance was set at p-value < 0.05.
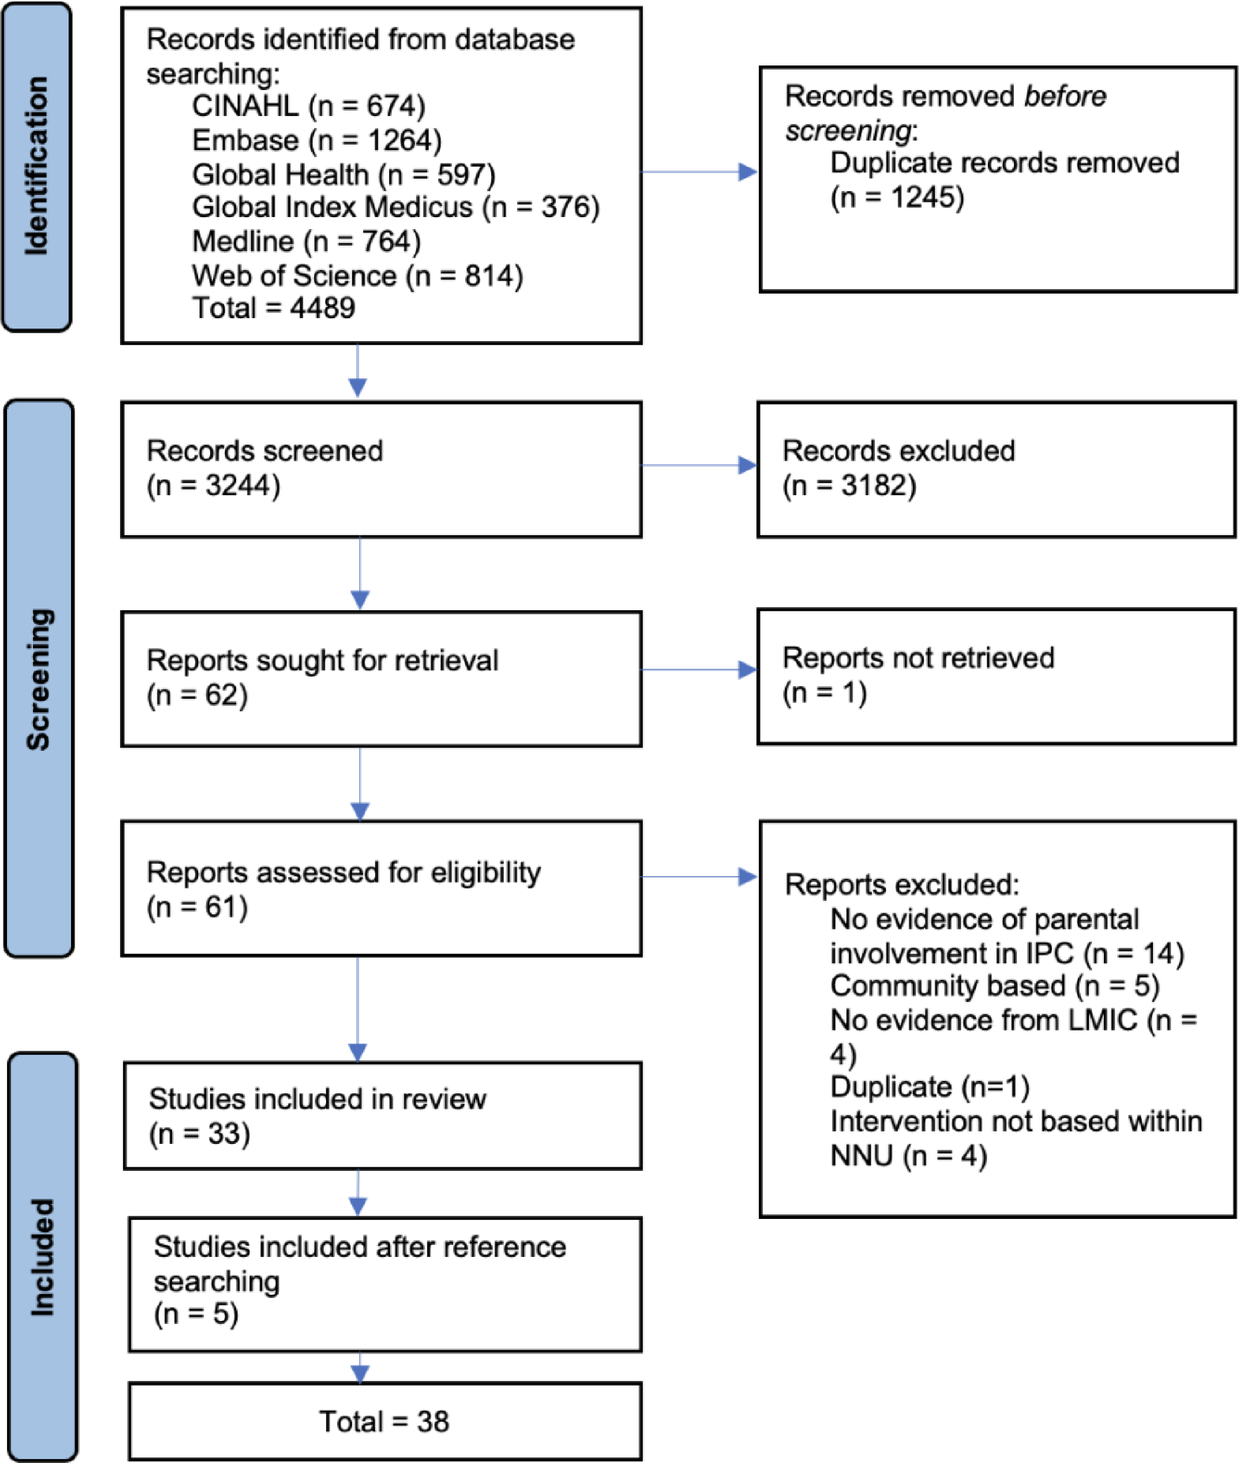
Fig. 1
Flowchart of the study population
Comments (0)