Samples and chemicals
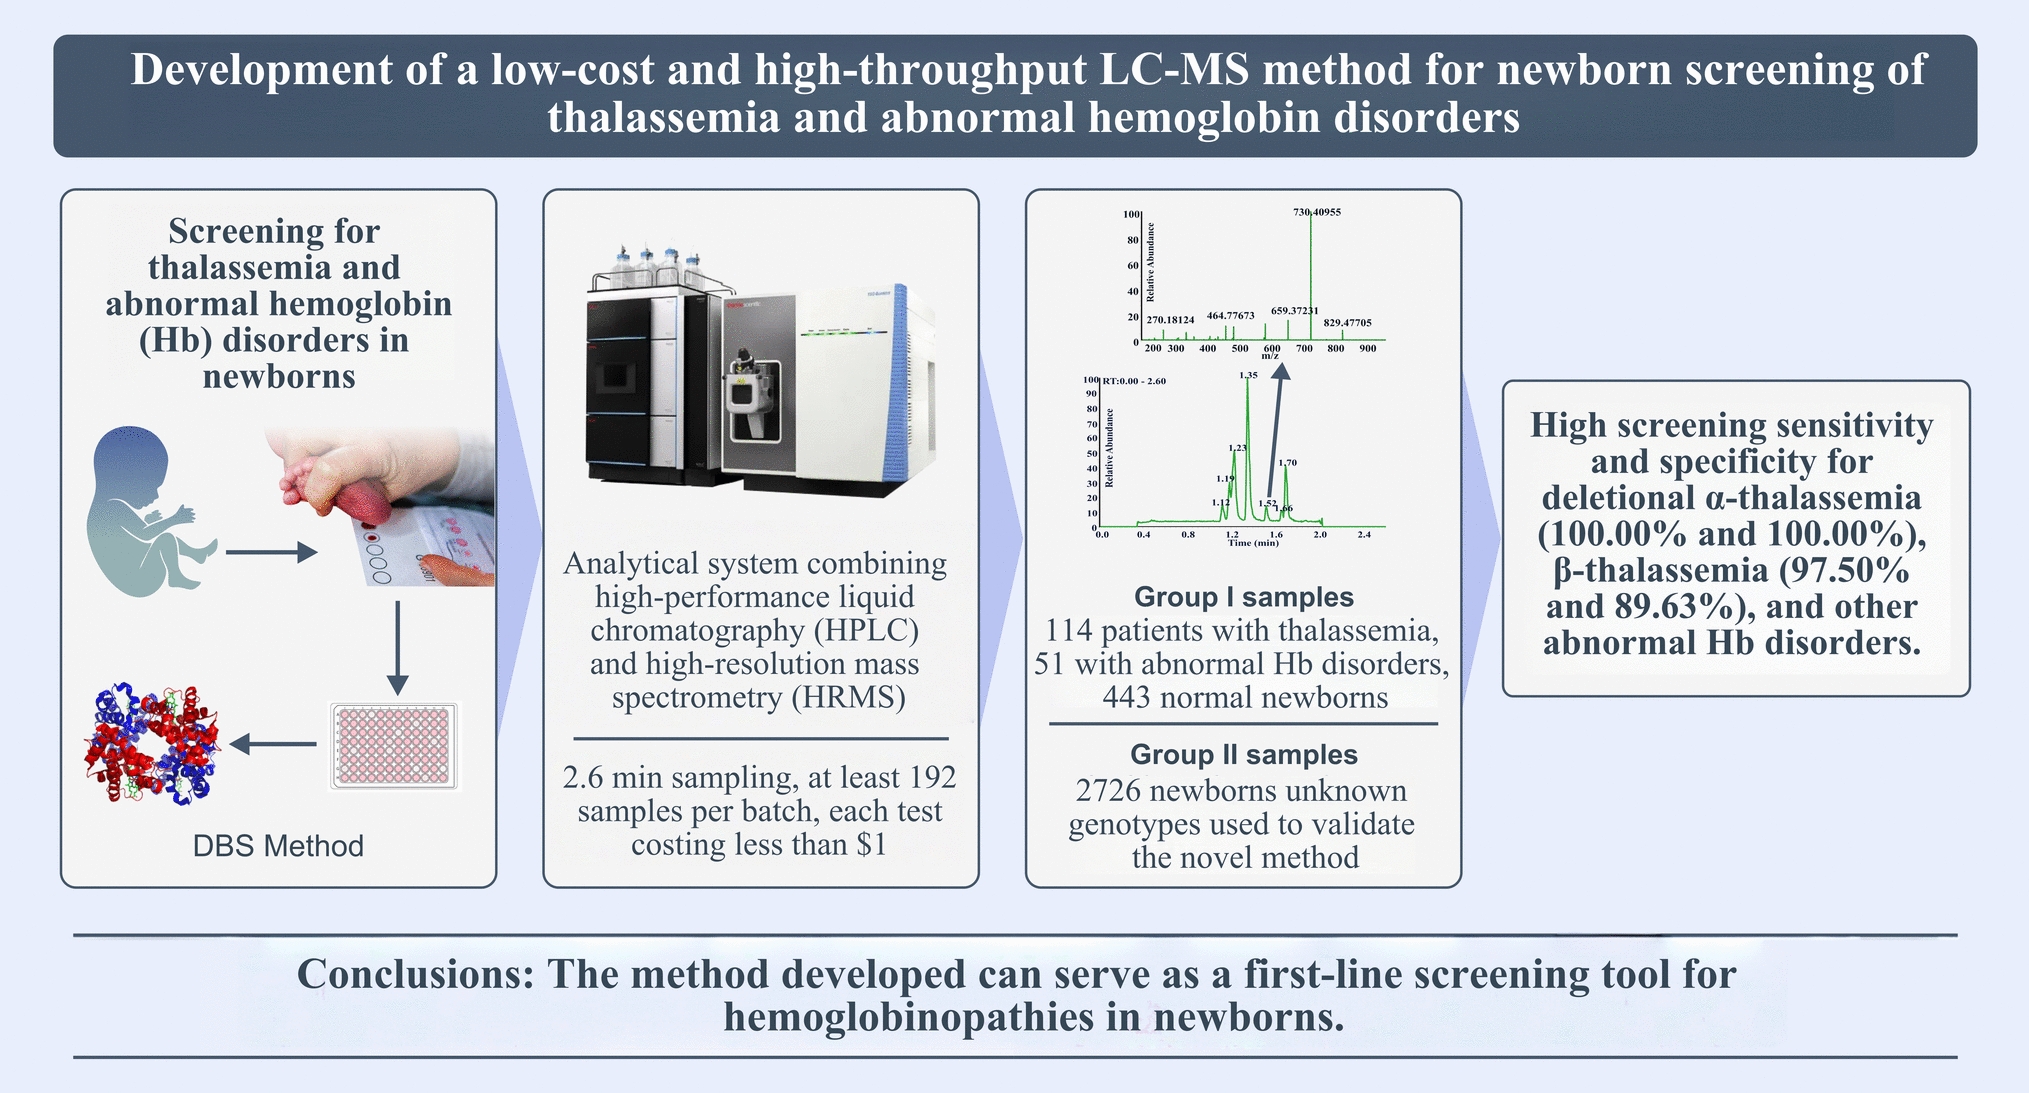
The Institutional Ethical Review Boards of the Children’s Hospital of the Chongqing Medical University approved this study (No. 2018-64). Two cohots were included for the analysis. Group I (development cohort, n = 608) consisted of 114 patients with thalassemia, 51 with abnormal Hb disorders, and 443 normal newborns. All samples from group I underwent genotyping via next-generation sequencing (NGS), they were then used for biomarker selection, screening method establishment and definition of reference intervals (Table 1). Group II (validation cohort, n = 2726) consisted of newborns with unknown genotypes and was used to validate the newly developed screening method. All DBS samples were prepared from either peripheral blood applied to filter cards or direct heel stick collections and were stored at 4 °C until analysis.
Table 1 The screening cut-offs generated for thalassemia and abnormal Hb disordersHPLC-grade acetonitrile (CAS 75-05-8) and methanol (CAS 67-56-1) were obtained from Honeywell, South Korea and stored at room temperature (RT). Formic acid (CAS 64-18-6, Sigma-Aldrich, Darmstadt, Germany) with a purity of 95% was stored at RT. We prepared 5 g/L trypsin (CAS 9002-07-7, Sigma-Aldrich, St. Louis, MO, USA) by dilution with 1 mol/L ammonium bicarbonate solution (CAS 1066-33-7, Sigma-Aldrich, Darmstadt, Germany); this was stored at − 20 °C. The denaturing solution was prepared using formic acid, methanol, acetonitrile and deionized water (1:80:200:520), stored at RT. Internal standards (IS) and stable isotope-labeled peptides (synthesized by GL Biochem Ltd, Shanghai, China, with a purity of 99% using Fmoc-Lys13C,15N –OH) were diluted to a concentration of 1 mg/mL with deionized water containing 25% acetonitrile and stored at − 20 °C. We used the Sebia capillary electrophoresis device (Sebia-CE, Capillarys 2 Neonat Fast™, Evry, France) and a commercial kit (Capillarys Minicap Hemoglobin E) as the reference method for screening hemoglobinopathies.
Sample preparation
Disks with a diameter of 3.2 mm were punched from the DBS samples and transferred to a 96-well plate, followed by the addition of 200 µL of deionized water containing 20% of methanol, then gentle shaking for 30 minutes at RT. Subsequently, 50 µL of the sample lysates were transferred to a new 96-well plate, supplemented with 40 µL of denaturing solution prior to 5 minutes of incubation. A total of 10 µL of trypsin (5 g/L) was added to each well, sealed with a sealing film and incubated at 37 °C for 1 hour. 15 µL of digested solution was transferred from each well to a 96-well filter plate (MSGVN2250, Sigma-Aldrich, Darmstadt, Germany), diluted with 120 µL of deionized water containing acetonitrile (1:9) and 15 µL of IS (2 mg/L αT1 IS, 10 mg/L αT3 IS, 5 mg/L βT1 IS, 5 mg/L βT2 IS, 0.5 mg/L γT10 IS, 0.2 mg/L δT2 IS and 0.1 mg/L ζT8 IS), then centrifuged (600× g) at 4 °C for 2 minutes. The filtered solutions were ultimately transferred to a new 96-well plate, ready for analysis.
High performance liquid chromatography-high resolution mass spectrometry (HPLC–HRMS) assay
To enhance detection sensitivity the diluted samples containing the digested peptides were separated on an Ultimate 3000 system using a Hypersil GOLDTM C18 UHPLC column (100 × 4.6 mm, 1.9 μm, Thermo ScientificTM). Two mobile phases were used: mobile phase A was deionized water containing formic acid (0.1%), while mobile phase B was HPLC-grade acetonitrile containing formic acid (0.1%). To improve peptide separation, we used a gradient flow (Supplemental Table 1). MS analysis was performed using a Quadrupole-Orbitrap MS system (Thermo Q Exactive Focus) with an electrospray ionization source connected to the Ultimate 3000 system (Supplemental Table 2). Each peptide underwent collision-induced dissociation, and the resulting precursor-product ion pairs (mass transitions) were monitored in positive-ion mode using parallel reaction monitoring (PRM) (Supplemental Table 3).
Identification of proteo-specific peptides for the screening assay
Tryptic digestion of the Hb subunits yielded a series of proteo-specific peptides that were separated and identified by HPLC–HRMS within 2.6 min. The most informative peptides (signal-to-noise ratio ≥ 10) were selected to represent the corresponding globin chains and determine their relative concentrations using stable isotope-labeled peptides as IS (Eq. F1). To design effective screening markers for thalassemia, the ratios of proteo-specific peptides were calculated to reflect the degree of imbalance between α-like and β-like globin chains, or the proportion of rare Hb subunits compared with the main components (Eq. F2). For screening of abnormal Hb disorders, the ratio of the mutant globin chain to the wild-type β chain (GM/β) (Eq. F3) was calculated.
$$\upzeta /\beta =_/_=\frac$$
(F2)
where ζTn Area is the mass spectra peak area (MSPA) of peptide Tn from the ζ chain; ζTn IS Area is the MSPA of the IS peptide Tn; CζTn IS is the standard concentration of the IS peptide Tn; βTm Area is the MSPA of peptide Tm from the β chain; βTm IS Area is MSPA of the IS peptide Tm; CβTm IS is the standard concentration of the IS peptide Tm; GMTn Area is the MSPA of the mutant peptide Tn from the globin chain, GMTn IS Area is the MSPA of the IS peptide Tn; βTn Area is the MSPA of the wild-type peptide Tn from the β chain; and βTn IS Area is the MSPA of the IS peptide Tn.
Determination of screening cut-offs for thalassemia and abnormal Hb disorders
All 608 samples from Group I were analyzed using HPLC–HRMS. Globin chain ratios were obtained using the above equations and their potential value for disease discrimination was determined by receiver operating characteristic (ROC) curve analysis using GraphPad Prism 9.5. Peptides with globin ratios with an area under the curve (AUC) value exceeding 0.850 were selected as candidate biomarkers. To enhance the sensitivity and specificity of the HPLC–HRMS approach, we developed a prediction model through binary logistic regression, aiming to refine the screening cut-offs and normal reference intervals. The optimized screening cut-offs were finally determined by maximizing the Youden index (Youden index = sensitivity + specificity − 1).
Method validation
Our methodology was evaluated using a standard protocol for clinical MS [15]. Lower limits of quantitation (LLOQ) were assessed by measuring native matrix samples prepared with serum only. Inter and intra-assay variability was assessed using quality control samples at different concentrations on three consecutive days. To investigate matrix effects, samples prepared with trypsin-digested serum, normal saline and a mixture of trypsin-digested serum and normal saline (1:1) were compared. Carryover rate was assessed by first testing samples prepared with high concentrations of selected peptides and then testing the samples prepared with low concentrations. The recovery of the selected peptides was assessed at three different concentrations by spiking standard peptides into trypsin-digested serum with known concentrations. Stability of the DBS samples stored under different conditions (RT, 4 °C, and − 20 °C) was also evaluated.
Evaluation of clinical utility
We screened all 2726 samples from Group II using HPLC–HRMS and Sebia-CE in parallel. The HPLC–HRMS approach used the optimized screening cut-offs, whereas the Sebia-CE method adhered to the recently recommended decision-making rules (Supplemental Table 4) [16]. Using NGS, we validated all cases that screened positive by HPLC–HRMS or Sebia-CE. Subsequently, we evaluated the sensitivity and specificity of the two methods to demonstrate their efficacy in screening for hemoglobinopathies in newborns.


Comments (0)