
Remember me
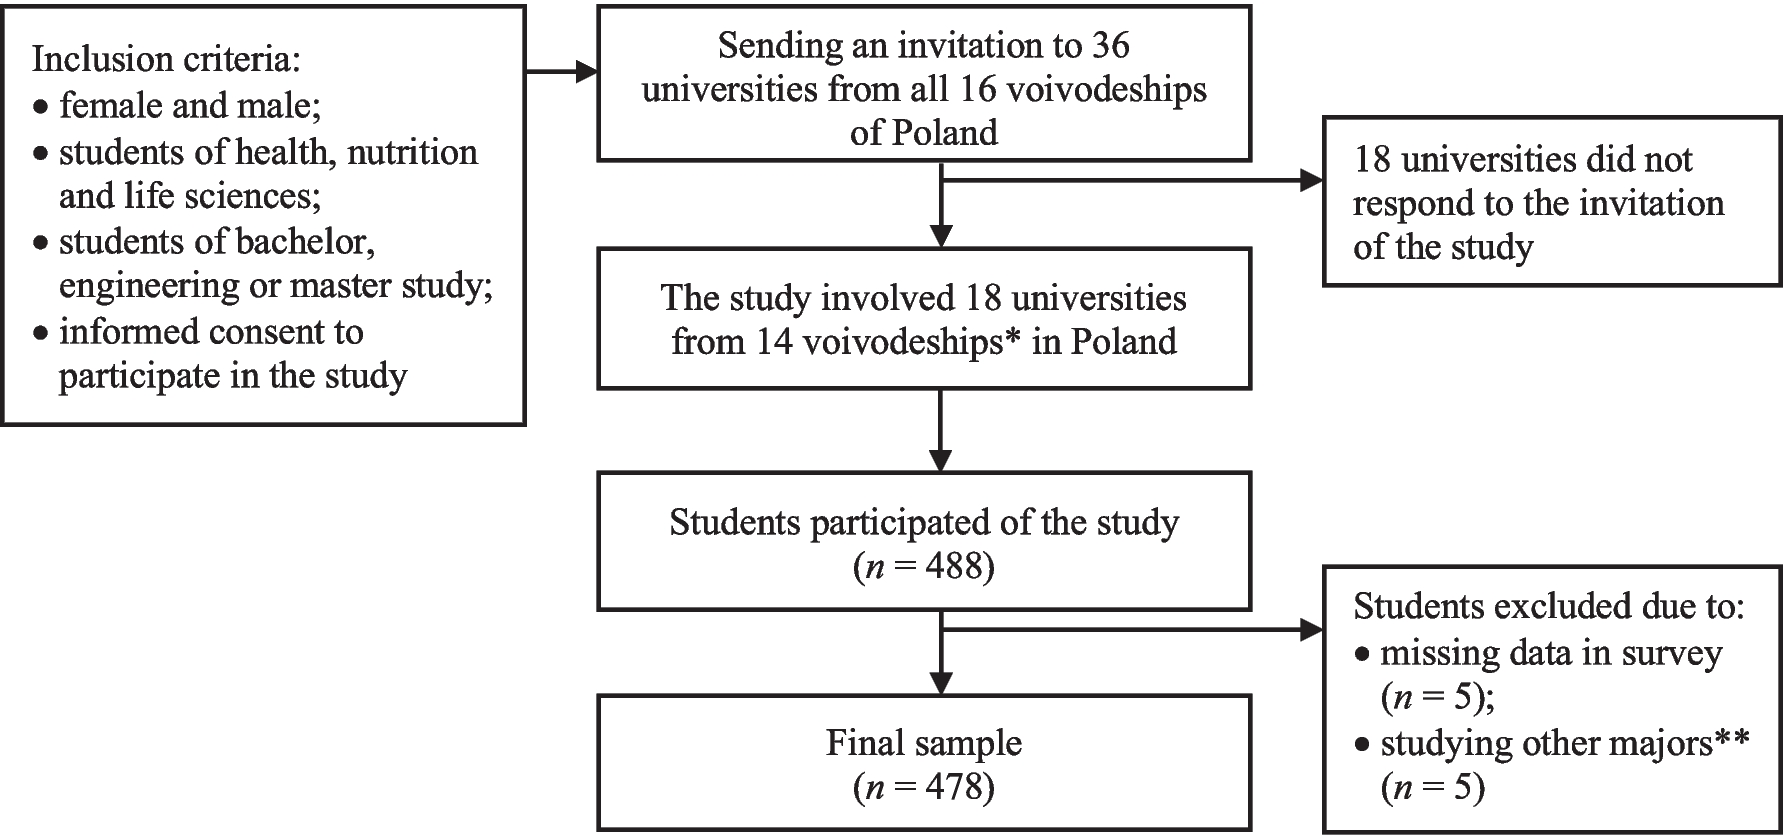
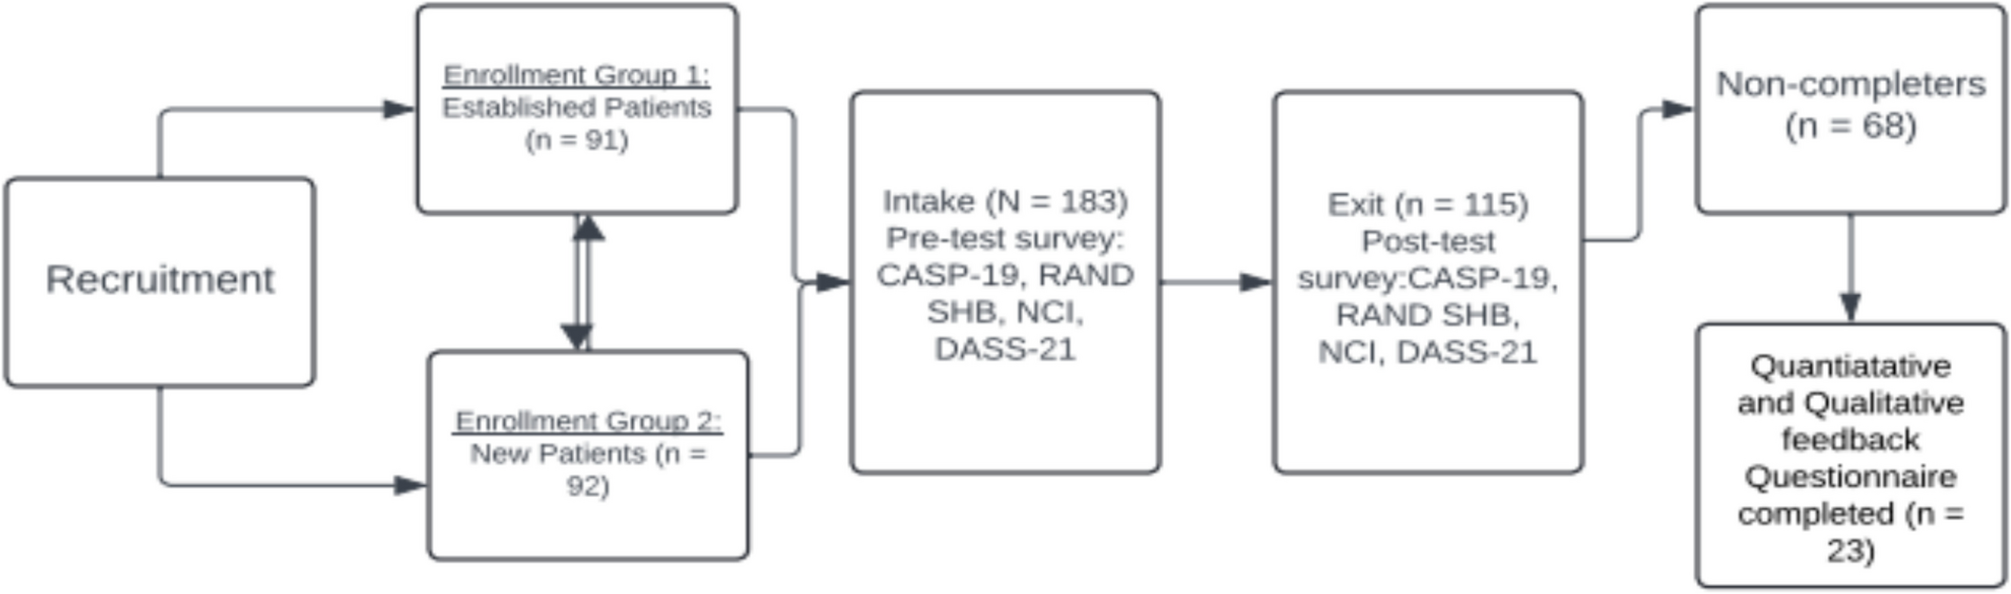

A cross-sectional quantitative study was conducted between March and November 2021 among college students. Although this type of exploratory study does not establish causality, it is an appropriate first step in identifying some associations. The study protocol was approved by the Ethics Committee of the Faculty of Human Nutrition and Consumer Science, Warsaw University of Life Sciences (Resolution number 45/2017). Thirty-six universities from all sixteen voivodeships of Poland were invited to participate in the study. The selection of universities was made non-randomly. The selected universities offered majors in their academic programs related to health, nutrition, or life sciences. This selection was made due to the fact that college students of health, nutrition, and life sciences have a similar program in the early stages of their education, and all acquire knowledge in biochemistry, analytical and organic chemistry, instrumental analysis techniques, and key biological phenomena and processes occurring in the human body. Eighteen universities from fourteen voivodeships of Poland responded to the invitation and participated in the study. The computer-assisted web interview (CAWI) technique was used to conduct the study. The online survey was created using the Google Forms application. Data were collected during lectures and workshops by academic teachers from participating universities. Additionally, the invitation to the study was published on the universities’ websites, allowing students visiting these sites to also participate. Respondents were informed about the purpose, procedure, and duration of the study, as well as their right to withdraw at each stage without any consequences. Participation in the study was voluntary and anonymous. Students completed the survey in approximately 20 min. The final sample consisted of 478 students. In the preliminary analysis, ten students were excluded from further analysis due to missing data in questionnaires (n = 5) or not studying majors in health, nutrition, or life sciences (n = 5). Figure 1 presents details of the sample collection.
Fig. 1
Study design and participant recruitment. * Pomerania, West Pomerania, Kuyavia-Pomerania, Podlaskie, Masovian, Lubusz, Lodzkie, Lublin, Swietokrzyskie, Subcarpathia, Lower Silesia, Opole, Silesia, Lesser Poland; ** Energetics, Navigation and ship armament, Finance and accounting, and Polish philology
Orthorexic Thoughts and BehaviorsOrthorexic thoughts and behaviors were evaluated using the validated Polish versions of the ORTO and PL-DOS questionnaires (Table 1). Firstly, the ORTO-15 questionnaire,30 consisting of 15 items scored on a four-point Likert scale (always, often, sometimes, never), was utilized. The coding scheme was inverted from the original ORTO-15 questionnaire by the standard procedures to facilitate easier comparison with other tools measuring ON thoughts and behaviors, for example, item two was scored as follows: 1—always, 2—often, 3—sometimes, 4—never (Appendix 1 Table 7). Many researchers have also employed shortened versions of the ORTO-15 questionnaire, such as ORTO-12,31 ORTO-11,32 ORTO-9,33 and ORTO-7.34 These versions were included in the current study, with the inverted coding scheme applied consistently. Higher scores across these questionnaires indicate a higher intensity of ON thoughts and behaviors.
Table 1 Internal consistency and modifications of questionnaires for assessing orthorexic thoughts and behaviorsSecondly, the ORTO-R questionnaire, composed of six items scored on a five-point Likert scale (never, rarely, sometimes, very often, always), was used.10,11 Higher scores reflect more ON thoughts and behaviors. The ORTO-R was specifically developed to address the limitations of the original ORTO-15 questionnaire and its shortened versions.35
Thirdly, the PL-DOS questionnaire consists of 10 items with response options as follows: 1—this does not apply to me, 2—this does rather not apply to me, 3—this does somewhat apply to me, and 4—this applies to me. A higher score indicates stronger ON thoughts and behaviors.36 Scores for each questionnaire were calculated by summing the scores for individual items and dividing them by the number of items. In the case of ORTO-15 and its shorter versions, the averaging of scores concerned the reversed results, while for ORTO-R and PL-DOS, it concerned the raw scores.
Mindful EatingThe mindful eating was assessed using the Mindful Eating Scale (MES). The original version of the MES, developed by Hulbert-Williams et al.,37 contained 28 items, while the Polish version used in this study includes 17 items.38 The Polish MES consists of three subscales: act with awareness (9 items; e.g., “I eat automatically without being aware of what I am eating”), awareness (4 items; e.g., “I notice how my food looks”), and acceptance (4 items; e.g., “I tell myself I should not be hungry”). ON thoughts and behaviors, although driven by a desire for healthy eating, may paradoxically be associated with rigid eating rules and poor psychological flexibility around food; therefore, assessing their relationship with mindful eating, which emphasizes awareness and flexibility in eating behaviors, seems important from the point of view of possible countermeasures ON thought and behaviors.13,17,22 The original coding and scoring procedure was followed in this study.38 Participants rated each statement on a scale from 1 (rarely/never) to 4 (usually/always), and item scores were averaged for the raw scores (range: 1–4), with higher scores indicating a higher level of ME. Cronbach’s alpha coefficients for the MES in this study were 0.74 for act with awareness, 0.59 for awareness, and 0.80 for acceptance in the total sample; 0.74, 0.58, and 0.81 for females; and 0.72, 0.69, and 0.64 for males, respectively.
Diet QualityThe food frequency consumption data were assessed using the Dietary Habits and Nutrition Beliefs Questionnaire (KomPAN) for individuals aged 15–65 years, developed by the Committee of Human Nutrition, Polish Academy of Sciences.39 The KomPAN includes key food groups in the Polish diet, namely grain products (4 items); fruit, vegetables, legumes, and potatoes (4 items); dairy products (4 items); meat, fish, and eggs (5 items); fats (2 items); beverages (3 items); sweets; and other products (2 items). These 24 food items are divided into two categories: (1) food groups with a potentially beneficial influence on health and (2) food groups with a potentially negative influence on health. Therefore, the assessment of diet quality measured by KomPAN may provide insight into whether ON thoughts and behaviors are associated with truly healthy eating behaviors or primarily reflect obsessive eating behaviors without corresponding healthy benefits.2. Each respondent reported their habitual consumption of food products over the past 12 months on a six-point scale ranging from 1 (never) to 6 (a few times a day). These categories were converted into daily frequencies expressed as times per day to obtain semiquantitative data: 1—0.00, 2—0.06, 3—0.14, 4—0.50, 5—1.00, and 6—2.00.40
Three diet indexes were subsequently created: (1) the Pro-Healthy Diet Index (pHDI), which covers 10 food groups potentially beneficial to health; (2) the Non-Healthy Diet Index (nHDI), which includes 14 food groups potentially harmful to health; and (3) the Diet Quality Index (DQI), based on the consumption of all 24 food groups included in the pHDI and nHDI. Each index was expressed as times per day and standardized to a score range of 0–100 points for pHDI and nHDI, and – 100–100 points for DQI using the following formulas:40
pHDI (in points) = (100/20) × sum of the frequencies of consumption of 10 food groups (times/day),
nHDI (in points) = (100/28) × sum of the frequencies of consumption of 14 food groups (times/day),
DQI (in points) = (100/20) × sum of frequencies of 10 food groups (times/day) + (− 100/28) × sum of frequencies of 14 food groups (times/day).
Based on these scores, participants were categorized into three groups: 0–33 points (pHDI—low intensity of beneficial dietary characteristics for health; nHDI—low intensity of harmful dietary characteristics for health), 34–66 points (medium intensity), and 67–100 points (high intensity). For the DQI, scores ranging from − 100 to − 26 indicated a high intensity of nonhealthy dietary characteristics, − 25 to 25 indicated a low intensity of both nonhealthy and prohealthy dietary characteristics, and 26 to 100 indicated a high intensity of prohealthy dietary characteristics. In this study, Cronbach’s alpha coefficients for the KomPAN were 0.77 for the total sample, 0.79 for females, and 0.76 for males.
Sociodemographic CharacteristicsThe sociodemographic characteristics of participants were assessed using questions regarding biological sex (female or male), age (in years), level of study (bachelor’s and engineering or master’s degree), year of study, major of study, university name, place of residence (village, town with 100,000 citizens or fewer, or city with more than 100,000 citizens), and voivodeship. To simplify data analysis, voivodeships were grouped into macroregions, which were divided into seven units based on the classification by Statistics Poland41: Northern (Pomerania, Kuyavia-Pomerania), Northwestern (West Pomerania, Lubusz), Masovian, Central (Lodzkie, Swietokrzystkie), Southwestern (Lower Silesia, Opole), Southern (Silesia, Lesser Poland), and Eastern (Podlaskie, Lublin, Subcarpathia).
Anthropometric DataBody mass index (BMI) was calculated based on college students’ self-reported body weight and height and categorized according to the World Health Organization guidelines42: underweight (BMI < 18.5 kg/m2), normal weight (BMI 18.5–24.9 kg/m2), and overweight and obesity (BMI ≥ 25.0 kg/m2).
Statistical AnalysisCategorical variables were presented as percentages of the sample (%), while continuous variables were expressed as averages, and standard deviations. The normality of the distribution of continuous variables was assessed using the normal probability plot, and homogeneity of variance was tested using the F test and Brown–Forsythe test. Differences in average values between two independent samples with a normal distribution were analyzed using the Student’s t-test (for example, the differences in ORTO-15/−12/−11/−7/PL-DOS scores between females and males), whereas the U-Mann–Whitney test was applied for samples with an abnormal distribution (ORTO-9/-R scores between females and males). For multiple independent samples, one-way analysis of variance (ANOVA) and the Scheffe post hoc test were used for normal distributions (ORTO and PL-DOS scores between BMI groups both in females and males), while the Kruskal–Wallis Rank ANOVA and multiple comparisons of mean ranks were applied for abnormal distributions (pHDI, nHDI, and DQI scores between BMI groups in males). Associations between continuous variables were analyzed using Pearson’s correlation coefficient for normal distributions (correlation between ORTO-15 and other ORTO and PL-DOS in females) and Kendall’s tau correlation coefficient for abnormal distributions (correlation between ORTO-15 and other ORTO and PL-DOS in males). The Pearson chi-squared test was employed to determine associations between independent categorical variables, such as biological sex, BMI groups, levels of pHDI, nHDI, and DQI. Statistical analyses were performed using Statistica software version 13.3 PL (StatSoft Inc., Tulsa, OK, USA; StatSoft, Krakow, Poland).
Effect sizes and post hoc power analyses were calculated using G*Power software version 3.1.9.7 (Heinrich-Heine-Universität Düsseldorf, Düsseldorf, Germany). Different effect sizes were applied based on the statistical tests used: Cohen’s d coefficient (d) for the Student’s t-test, Glass’s rank bivariate correlation coefficient (rg) for the U-Mann–Whitney test, Cramer’s V coefficient (V) for the Pearson chi-squared test, eta squared (η2) for the one-way analysis of variance (ANOVA), and epsilon squared (ε2) for Kruskal–Wallis Rank ANOVA. Cohen’s d coefficient equals 0.20, indicating a small effect; equals 0.50, indicating a medium effect; and equals 0.80, indicating a large effect. Glass’s rank bivariate correlation coefficient and Cramer’s V coefficient equal 0.10, indicating a small effect; 0.30—a medium effect; and 0.50—a large effect. Eta squared and epsilon squared equal 0.01, indicating a small effect; 0.06—a medium effect; and 0.14—a large effect.43 Further, the value of β is the probability of making an error of the II type, meaning not rejecting the null hypothesis, which is false. The power of a test can be defined as the complement of the probability of making a type II error (β), i.e., 1-β. It was assumed that the power of the test should be at least 0.80 to ensure the detection of differences and avoid errors of the II type.44
The two analyses did not achieve a power of 0.80, such as the differences between the average pHDI score and both sexes (1-β err prob = 0.62), and the average pHDI score and BMI groups in females (0.66), which means that for these analyses, the risk of type II error is higher, limiting their interpretation.
Comments (0)