Chemicals
Streptozotocin (STZ) was purchased from Sigma chemical co., St. Louis, MO, USA. All the blood and lipid profile analysis have been carried out using kits methods and related chemicals were of molecular biology grade purchased from Sigma chemical Co., MO, USA. All spectrophotometric measurements were carried out using UV2010 Spectrophotometer (Hitachi, Germany).
Animals
Adult male albino Wistar rats (n = 60) weighing approximately 200 ± 10 g were obtained from the center for experimental animals, College of Pharmacy, King Saud University, Riyadh. The rats were transported in specialized cages and brought to the animal house, Department of food science and nutrition, College of food and agriculture sciences, King Saud University. The rats were maintained in standard environmental conditions, such as 25 ± 5ºC temperature, 50 ± 5% relative humidity, and 12/12 h of lighting/darkness cycle [14]. Animals were acclimatized to our own animal house conditions, fed with standard rat chow pellet (American Society for Nutrition guidelines) and free access to water. Streptozocin (STZ) was used to induce diabetes mellitus (DM), further the animals were divided in to two groups such as, non-diabetic (n = 30) and diabetic (n = 30) rats. All the biochemical techniques and analysis were in accordance with the National Institute of Health guidelines for the care of laboratory animals (NIH), Department of health service (pages, 83 − 23, revised in 1993) [15]. All the animal experiments were carried out according to the institutional ethical norms approved by the ethics committee, College of Medicine, King Saud University [IRB no. KSU-SE-19-124].
Experimental induction of STZ-induced diabetes
After initial determination of 12 h fasting blood glucose levels, induction of experimental type 2 diabetes was achieved by intraperitoneal administration of STZ with a minimal dose of 45 mg/kg dissolved in 0.1 M citrate buffer (pH 4.5), freshly prepared [16]. The control animals were injected with citrate buffer (pH – 4.5) alone. After 8 h of STZ administration, the rats were allowed to intake 15% glucose solution through their dripping bottles attached with their cages to prevent hypoglycemia for next 24 h [17]. Diabetes was developed and stabilized in STZ injected rats within the period of 7 days. After 7 days, the plasma glucose levels of each rat were determined, the rats identified with fasting plasma glucose (FPG) range of 280–350 mg/dl were considered diabetic and included in the study [16]. Blood was collected by sinocular puncture. Body weights, water intake, and fasting plasma glucose levels were measured at weekly intervals, whereas other parameters were assessed at the start and end of the experiment.
Dietary lipid composition
The standard pellet diet consists of raw fat, crude protein, raw fat, raw fiber, cinders, salt, calcium, phosphorus, vitamin A, vitamin D and vitamin E were provided to control group. Overall the percentage of fat in standard pellet diet is 4%. The experimental healthy and diabetic groups supplemented with 15% increased amount of fat by adding the experimental dietary lipids (oils), the total fat have been determined as 19% in the supplementation diet (Table 1). The amount of fat in the standard diet was modified by pulverizing it and adding 150 g of different type of fat per kg of standard diet. To avoid the oxidation of fats or modifying their properties, the diet was prepared freshly every week. Fresh Al-Naimi’s sheep fat (a form of saturated fat) acquired from a local market, the sheep’s fat was heated in a water bath (upto 70 °C), to transform it from solid to liquid. Coconut oil prepared based on its translucent cold mechanical squeeze upon melting from the land of nature industry is organic virgin coconut oil, supplied from Ceylon Naturals, Srilanka. The olive oil (extra virgin, cold-pressed) was purchased from the local market, supplied by the Alwazer Company, Spain. The corn oil (Afia International Company) was purchased from local hypermarkets as a sort of dietary vegetable fat supplied by Savola Foods, Saudi Arabia. Fatty acid compositon in sheep fat, coconut oil, olive oil and corn oil were detrmined using GC-MS (Agilent 7890 A, Agilent Technologies, USA). NIST libraries were used to identify and interpret GC-MS data. The chemical name and concentration of each compound was expressed based on peak area percentage were presented in Table 2.
Table 1 Components of experimental diet (g/100 g)Table 2 Compositon analysis in sheep fat, coconut oil, olive oil and corn oil using GC-MS analysisDiet preparation and intervention with different dietary lipid
The rats comprising in a healthy group, were randomly allocated into five separate groups (n = 6). Group-1 (control group) was provided with a typical control diet that consisted solely of 4% maize oil as the primary source of dietary fat. Group-2 was provided with a standard diet enriched with sheep fat, resulting in a fat content of 15%. Group-3 received a standard diet enriched with 15% coconut oil. Group-4 was administered with a standard diet enriched with 15% olive oil. Finally, Group-5 was given a standard diet enriched with 15% addition of corn oil. The diabetic rats were subsequently assigned at random to five groups (n = 6), consisting of a control (group-6), a sheep fat (group- 7), a coconut oil (group-8), an olive oil (group-9) and a corn oil (group-10). All the groups in healthy and diabetic rat were subjected to the same condition and treatment as outlined in Table 3.
Table 3 Dietary lipids type used in feeding diabetic and non-diabetic rats’ dietsThe dietary lipids supplementation was given for the period of 45 days. No noticeable irritation or restlessness was observed throughout the experimental period. At the end of the 45th day, all the rats were sacrificed by decapitation under phenobarbitone sodium anesthesia (60 mg/kg) according to the ethical committee guidelines. Blood was collected in two different tubes; one was used for serum separation (lipid analysis), and the other was supplemented with an anticoagulant (sodium fluoride) for plasma glucose, insulin and protein assay. Liver tissues were collected, washed in ice-cold saline, and weighed.
Calculation of earned weight and consumed food
Basis of the amount of food consumed throughout the 45-day trial period, the weight gained was calculated according to the following formula: Weight Gained = End of trial weight – Trial beginning weight [18]. The amount of food consumption was calculated using the equation: Amount of food consumed (g) = weight of food provided daily - weight of food lost per day × trial duration 45 days [18]. In addition, the food consumption efficiency was also calculated by the equation: Food Consumption Efficiency = Weight Gained (g) ÷ Food Consumed (g) [18].
Fasting plasma glucose and lipid profile analysis
After blood sampling, plasma and serum were collected after centrifugation for all the analysis. Fasting plasma glucose was estimated colorimetrically using commercial diagnostic GOD-POD kit (Sigma Chemical Co., St. Louis, MO, USA) method [18]. Plasma insulin level (mIU/ml) was quantified using rat insulin enzyme linked immunosorbent assay (ELISA) kits (RayBiotech Inc., Norcross, GA, United States). Lipid profile was performed using blood chemistry analyzer (Response® 910, Diagnostic System-SIEMENS, Munich, Germany) for the following parameters; low density lipoproteins (LDL), high density lipoproteins (HDL) and total protein in plasma. The serum triglycerides (TG) and total cholesterol (TC) levels after the dietary intervention were analyzed [19]. The activity of plasma lipoprotein lipase (LPL) was analyzed using STA-610, LPL standard and activity assay kit, Cell Biolabs, INC, San Diego, USA.
Analysis of oxidative stress markers
The level of lipid peroxide (LPO), glutathione (GSH) (Ransel kit, Randox Laboratories, Ltd., Crumlin, UK); the activity of catalase (CAT), superoxide dismutase (SOD) (Cayman, Rockford, USA) and glutathione peroxidase (GPx) (Randox Company, Antrim, UK) were quantified in both normal and diabetic rats using kit method. The total protein was quantified using assay kit (Bio-Rad, USA).
Analysis of lipid metabolism regulators in liver
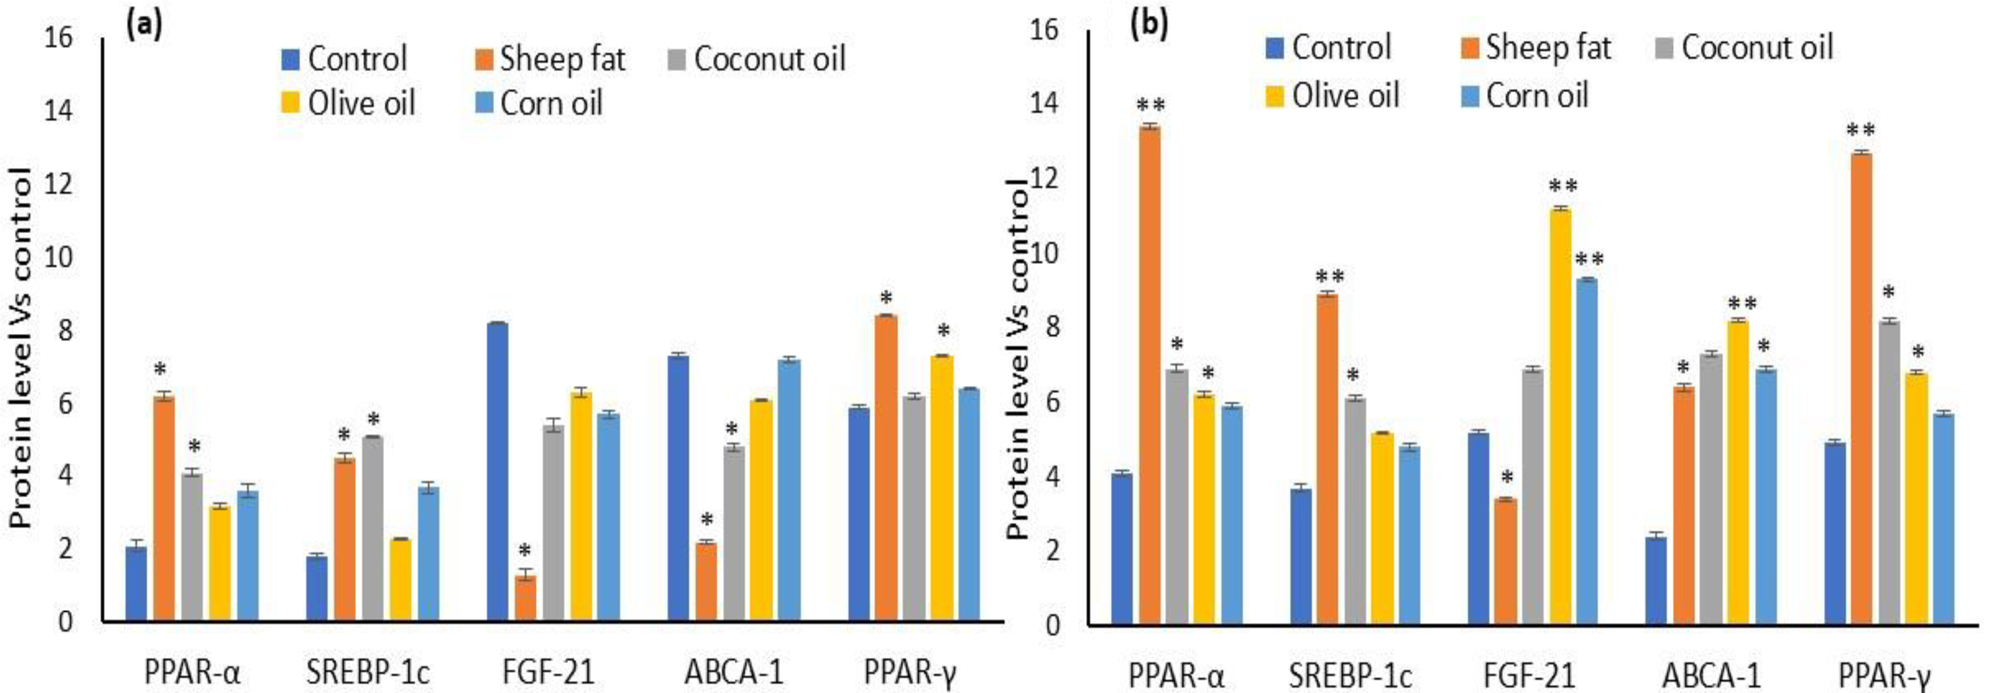
Liver tissues was collected, and 0.3–0.5 g was homogenized with 1:10 ratio of 50 mM Tris/HCl buffer (pH 7.5) in cold temperature. The homogenate solution was collected and centrifuged at 20,000 g for 15 min at 4ºC. The supernatant was collected to analyze the metabolic and inflammatory markers assays. High dietary fatty acid associated glucose-lipid oxidative metabolism regulating protein, like Fibroblast growth factor-21 (FGF-21), Melanocyte-stimulating hormone (MSH), Atp-binding cassette transporter-1 (ABCA-1), Sterol regulatory element binding protein-1c (SREBP-1c), and Peroxisome proliferator activated receptor- gamma (PPAR-γ) and Peroxisome proliferator activated receptor- alpha (PPAR-α) levels were analyzed in both normal and diabetic rats using ELISA kit (Quantikine R&D Systems, MN, USA).
Analysis of serum inflammatory markers
After 45 days supplementation of dietary different lipid, the metabolic syndrome associated inflammatory markers such as, Tissue necrotic factor- alha (TNF-α) and Interleukin − 6 (IL-6) (R & D Systems, Minneapolis, MN, USA); Monocyte chemoattractant protein- 1 (MCP-1), Interleukin-1 beta (IL-1β), and Toll like receptor- 4 (TLR-4) (Quantikine R&D Systems, MN, USA) concentrations were analyzed in both normal and diabetic rats using an enzyme-linked immunosorbent assay (ELISA) kit method, according to their protocol.
Statistical analysis
The experimental data was processed using the Statistical Package for Social Sciences (SPSS) software, which employed the following statistical procedures. The arithmetic means (M) and standard deviations (SD) were calculated. The significance between the treatments between the normal and diabetic groups were demonstrated using one-way ANOVA analysis. The differences in p-values less than 0.05 and 0.001 were deemed statistically significant [20]. In the occurrence of statistically significant differences utilizing variance analysis, the LSD post-test was employed to conduct multiple comparisons between the means.


Comments (0)