Study design
The research was conducted in four phases. The study design was formulated after a comprehensive literature review of previously conducted studies for assessing sodium dietary intake in different countries [18, 19, 22,23,24,25]. Based on these investigations, the study four phases are: (1) FFQ screener development (2) content validity assessment (3) pilot study for reliability testing (4) and criterion validity assessment.
Phase 1: FFQ screener development
This phase started with categorizing the Palestinian food items into groups and subgroups depending on food classification and consumption method; i.e., bread bases dishes were all collected and categorized to subgroups according to sodium content, similarly salty snack; nuts, seeds, chips and popcorn they were combined in one group depending on the mode of consumption among Palestinians. Depending on this categorization: thirteen food groups were considered. These groups are listed next: (1) salty snacks consisting of the most popular chips brands in the Palestinian market and popcorn. (2) Nuts, such as almonds, cashews, walnuts, roasted legumes, and seed. (3) Pickles, such as olives, turnips, peppers, “Makdous”, carrots, and cauliflower. (4) Pastries in their various types. (5) All varieties of bread, including Arabic, French, Lebanese, wheat, and others. (6) Salads such as Arabic salad, “Tabbouleh”, “Fattoush”, cabbage salads, chicory, molasses and mayonnaise salads. (7) Dairy products containing salt, such as all types of cheese and “Labaneh”. (8) Meat consists of red, white, fresh, processed, and canned forms, as well as its diverse cooking methods, including grilling, frying, and boiling. (9) Dishes with tomato stew, including potato, okra, peas, vegetables, beans, and cowpea stews, and also dishes of “Kofta”, eggplant, pasta, and potatoes. (10) Dishes with white sauce, including béchamel, mushroom cream, “Tahini”, and yogurt. 11) Palestinian rice dishes including boiled rice, “Makloubah”, and others. 12) Soups such as lentil, noodle, and “Freekeh”. 13) Others, such as thyme, “Hummus”, “Falafel”, beans, “Musakhan”, ketchup, and mayonnaise, that were not included in the previous categories. Several items, including milk, beverages, fruits, and vegetables, were omitted from the list since their sodium content is less than 30 mg per 100 g.
The next step was determining serving sizes based on household measurements using the Palestinian Atlas (ladle, plate, etc.) [17]. Additionally, each item’s image was taken from the Palestinian Atlas to help the user in quantification of the serving size. Then, the sodium content for each food item was extracted from the PALNUT website [17]. PALNUT is Palestinian food composition database owned by Al-Quds University, after submitting an official request to the owner of the food composition table, access to the data was granted. In order to confirm that the sodium content of the food products was appropriate and compatible with the other databases, other widely used databases, such as the USDA database and the Jordanian food composition tables were used [26] Every food item’s sodium content was calculated, recorded, and compared across the three sources per 100 g and serving size. Other items, such as pomegranate molasses, beverages, and chips, whose sodium content was not reported in the three databases were calculated by reading their food labels from many brands for the item and then taking the average sodium content. In each group, all foods with similar sodium levels were combined into one item, as long as the difference between them was less than 100 mg. Moreover, several of the categories were merged, resulting in nine groups (41 items) organized as follows: (1) Snacks consisting of chips, flour-coated chips, nuts, seeds, and popcorn. (2) Pickles including pickles in water, pickles in oil, and olives. (3) Bread-based dishes which include bread, “Manakesh”, pizza and “Sfeha”, baked pastries, and “Mussakhan”. (4) Seeds such as boiled rice, “Mahashe”, cooked rice with vegetables, cooked “Freikah”, and bulgur. (5) Vegetable salads with and without salad dressing, such as pickles, pomegranate sauce, and mayonnaise. (6) Dairy products including white cheese, “Labaneh”, cheese fondue, and spreadable cheese. (7) Meat, including burger sandwiches, processed or canned meat, lamb or beef cooked meat, chicken cooked meat, cooked fish, shawarma sandwiches, and KFC chicken. (8) Soups and stews containing soups with chicken broth, tomato or yogurt sauce, and lentil soup. (9) Side dishes such as zaatar, “Hummus”, “Fool”, “Msabaha”, avocado with lemon, “Flafel”, olive oil-fried egg, “Kubba”, tomato paste, and macaroni.
Phase 2: content validity
Four registered dietitians and three researchers were invited and agreed to review and evaluate the FFQ screener. They were asked to examine and evaluate if the food items grouping, serving and the household measurement were relevant and user friendly. The feedback was discussed in an interview person to person to have final agreement for the best presentation for the food groups, serving size and the frequency of consumption. There was no remark on how the groups operate or their content; rather, clarifications were requested, such as the type of chips. Or a request to identify a quantity, such as determining the number of pickled olives per serving. However, these explanations were resolved by adding photos to illustrate each item. There were no comments that required significant revisions. Most of the comments were requests for clarification in order to confirm the items.
Phase 3: pilot study and reliability
This phase consists of a pilot study to assure the reliability of the screener. Test and retest reliability test was done for reliability evaluation. The participants were selected by convenience sampling, the 22 participants were provided with the screener and they were asked to complete the screener (test), then after 10–14 days they were asked to re-fill the same screener (retest).
Phase 4: criterion validity
The criterion validity was done for the screener by comparing the results of sodium intake from the screener with the sodium intake assessed by gold standard. There were two Gold Standards used for the screener’s validity determination: the first gold standard is the 3-day diet recall (3DR), the second is 24-hour urinary sodium. Therefore, in addition to completing the screeners, the participants filled out a 3DR form and collected the urine for 24 h. For the 3DR, participants were asked to record the food items’ names and quantities according to household measurements. The 3DR form also included the timings of the day’s first and last meals, the number of items consumed, time and place of consumption, whether they were consumed inside or outside the home, and the type of meal (breakfast, lunch, dinner, or snack). Food items consumption quantification was determined based on the food Atlas from Al-Quds University [27], which contains indexed pictures of food items and recipes that indicates the amount food consumed in grams. The diet analysis converting the food into nutrients was done by a registered dietitian specialized in the field. The calculated results of the 3DR for each participant were reported then the average of the three days was considered as the sodium intake.
For the second gold standard − 24-h urine collection-, each participant was given a urine container to collect urine after being instructed to discard the first morning’s urine and then collect urine for 24 h. After that, the volume is recorded [28]. The samples were then stored in the university’s refrigerator until a minimum of 15 samples were collected, then they were sent to the Al-Najah university hospital for sodium and creatinine analyses. The unit for calculated sodium intake (from the screener and 3DR) and measured sodium intake (using the 24 h urinary sodium) were standardized from the three methods to be in milligram.
Sodium screener software
The development of software for monitoring sodium intake is considered as a significant advance in self-health management. This software contains 41 food items organized into 9 groups. it aimed to provide accurate information for self-monitoring of sodium consumption. This software contains common Palestinian food recipes, making it simple to control one’s own dietary consumption and choose healthful food options.
The software’s dietary database is rigorously curated using a range of common and culturally diverse recipes. That makes the software user-friendly and simple. The software provides users with an in-depth understanding of their sodium intake from different sources. It was structured to allow users to acknowledge the high sodium sources by creating 9 food items’ groups containing 41 items based on their sodium content. This classification simplifies the entry for users and provides recommendations for minimizing sodium consumption according to their consumption of particular food groups.
Considering important factors such as serving size, frequency of eating, and sodium content of each item, the software creates a personalized health profile based on the entered information. By conducting an accurate analysis of the data, making the sodium screener an accurate and reliable tool. This enables users to make decisions regarding their dietary practices and make positive changes. This software was used to develop a screener mobile application, which is supported by a huge food database and complex analytical tools, which will help individuals to alter their sodium consumption and improve their health.
Subjects characteristicsStudy population
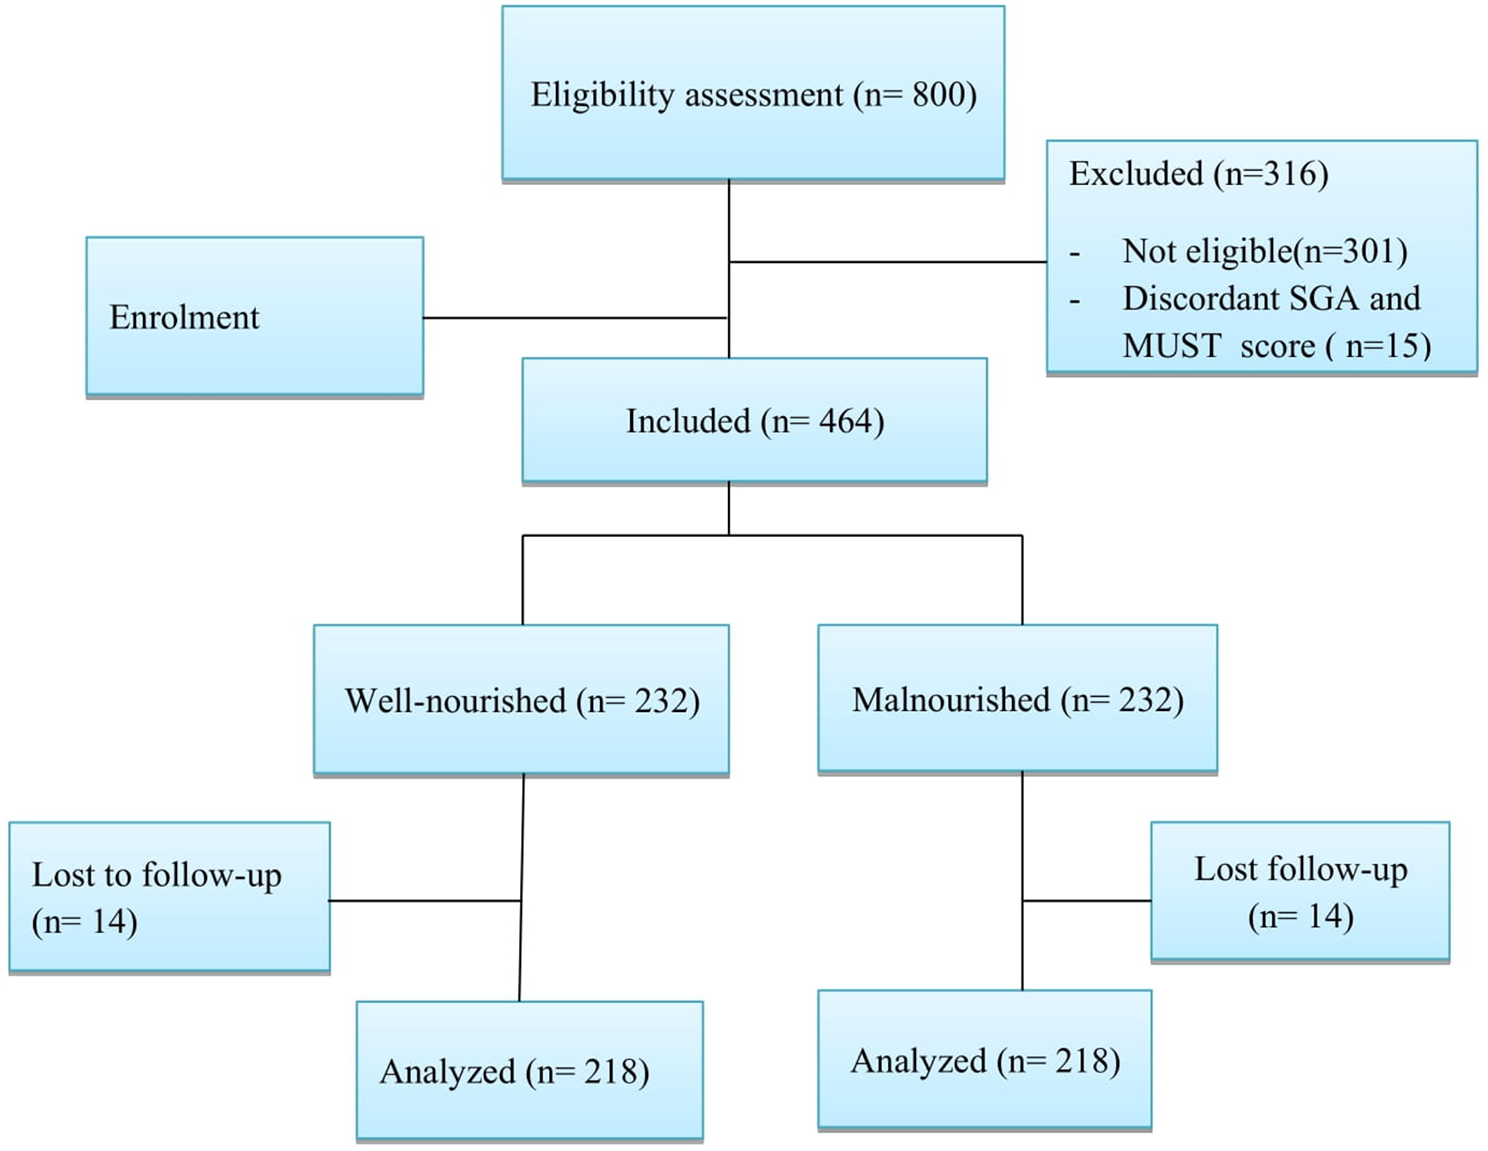
For the criterion validity phase: the study population consisted of 81 young, healthy Palestinian adults between the ages of 18 and 40 residing in the West Bank, the data was collected between June and December 2022.
Inclusion criteria
The individuals between the ages of 18 and 40 from the West Bank and did not have any diseases that influenced their urinary sodium levels.
Exclusion criteria
Participants who were pregnant, diabetic, or who have high blood pressure or any disease that may affects urinary sodium level. Participants who didn’t collect the total urine in the 24 h were excluded: the exclusion for these participants was done depending on the creatinine in urine results, the creatinine values were compared to the reference ranges established by the Mayo Clinic (men: 13–29 mg/kg/day; women: 9–26 mg/kg/day) [29]. If it was outside the acceptable range, the participant was excluded.
Sampling method and sample size calculation
The sample size was calculated using MEDCALC software for a method comparison study using the Bland-Altman plot. Type one error was 0.05, type two was 20%, the expected mean difference was 120 mg, the expected standard deviation difference was 50 from the previous study by AlKhalaf et al. (2015) the allowed difference was 250. So, the required sample size was 75 participants. The sampling frame was convenient sampling [14].
Data collection for the survey phase
The data was collected by a structured questionnaire that is consisted of five sections: sociodemographic characteristics (gender, education level, place of residence, living nature, marital status, income, current work), medical history and lifestyle (chronic disease, medication, supplements, surgery, working out, walking), participants’ salt consumption and preferences (adding salt after cooking, liking salt, reading food labels, preferring less salty food, reducing salt intake), the FFQ screener, and the 3DR.
Study instruments
Twenty-four hours urinary sodium excretion
The participants collected urine for 24 h using 24-hour containers of 2–4-liter capacity. If the initial specimen is done, urine from each container is poured into two cups, one for analysis and one for storage. Since 85–90% of consumed sodium is eliminated from the body by the the urine, the 24-hour urine test is the most reliable standard for sodium. Moreover, the over and under collections have been reported using the creatinine reference range [30].
Three-day recall (3DR)
Participants were questioned regarding the precise time, place, composition, portion size, and salt quantity of each meal they ate. They were first asked about their main meals -breakfast, lunch, and dinner- then about their snacks. To help the participants remember anything they could have forgotten to mention, they were asked about their everyday activities and whether they had consumed any drinks, eaten outside the house, or had any candy or chips. A previous study showed that, a FFQ and a 24-hour urinary sodium excretion demonstrated a correlation of at least 90%. With this correlation, the difference between predicted and actual sodium, potassium, and protein intakes was 0.39–0.61 compared to 0.35–0.55 for a single FFQ [31].
Statistical analysis
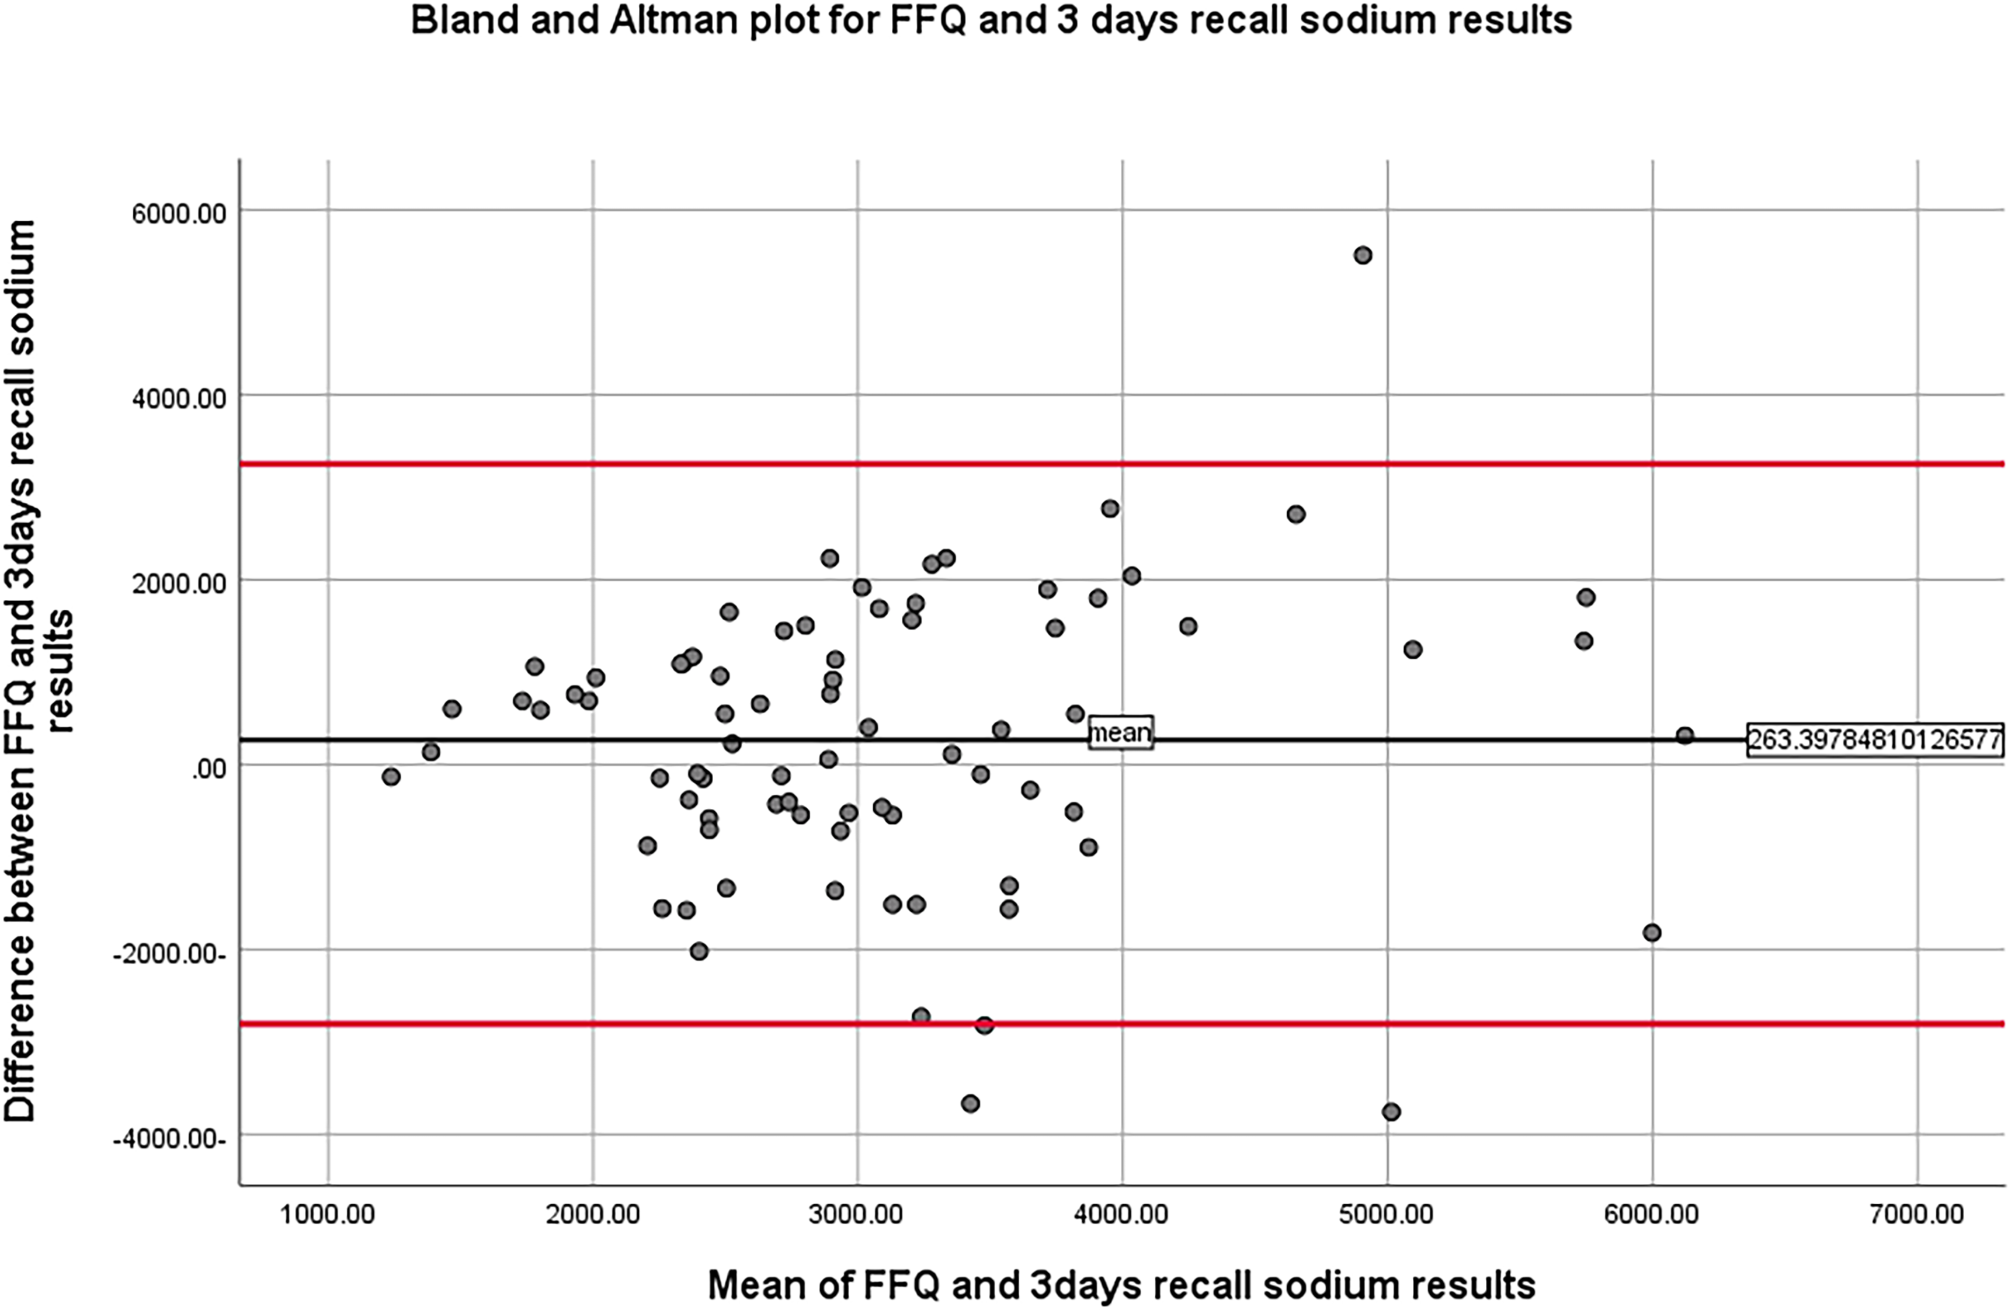
All statistical analyses were performed by the Statistical Package for the Social Sciences (SPSS) version 26.0 software. The alpha value for all statistical tests employed in the study was set at 0.05 [32]. Shapiro-Wilk Test was used to assess the continuous variables for normality. To evaluate the data, descriptive statistics including means and standard deviations were employed. Using percentages, the category data were described. The bivariate correlation test was used to correlate FFQ screener results with 3DR and 24-hour urine collection results. One-way ANOVA was applied to assess the relationship between sodium practice questions and sodium intake FFQ results. The Bland–Altman plot is used to illustrate the variation in FFQ screener, 3DR, and urine sodium results.
The Bland-Altman plot is an excellent starting point for comparing two measurements of the same variable. The Y-axis represents the difference between the two values, while the X-axis represents their mean. If one method consistently produces excessively high results, for instance, the chart will depict all points as being either above or below the zero line. It may also reveal that a specific method tends to overestimate large quantities and underestimate small ones. The presence of points above and below zero on the Bland-Altman plot indicates there is no apparent bias favoring one method over another [33].
Ethical consideration
Al-Najah University’s Internal Review Board for Research Ethics authorized the study protocol number Bse July, 2022\28. The questionnaire included a section stating that they had given their written approval where participants were asked to sign. There was no reward for the participants. When using the study methodologies, regulations were compiled to. The data was kept private and was solely utilized for study.


Comments (0)