
Remember me


The medical research landscape has undergone unprecedented growth, characterised by a surge of primary and secondary research of various scientific quality and novelty investigating several healthcare treatments of different complexity [1]. The evergrowing scientific evidence in quantity and complexity has led to a paradigm shift in the evidence synthesis methods, establishing network meta-analysis (NMA), an extension of pairwise meta-analysis, as the statistical tool to address research questions on multiple treatments for health technology assessments, guideline development, and clinical research [2, 3]. Fast-paced advances in the methodology of NMA and software availability over the past decades have driven the rapid increase in publications of systematic reviews with NMA [2,3,4].
Indirect evidence comprises the central component of the NMA methodology [5, 6]. It refers to evidence for a pairwise comparison (e.g. C versus A) informed by different sets of studies sharing one or more common comparators (e.g. B versus A and C versus B) through the consistency equation (the effect of C versus A equals the effect of B versus A and the effect of C versus B) [7]. The indirect estimate can yield reliable information about the compared treatments, provided that the evidence contributing to the consistency equation is similar concerning important effect modifiers [8]. Access to direct evidence for that comparison allows for assessing whether the indirect evidence represents the direct evidence. Lack of agreement between different sources of evidence has been termed inconsistency and can compromise the quality of conclusions [7].
Inconsistency assessment has received great methodological attention for pinpointing locations in the evidence network where the different sources mismatch, requiring immediate attention [2, 9,10,11]. Different methods have been developed to evaluate inconsistency, widely distinguished into local and global methods [12]. Methods for local inconsistency evaluation have received relatively more attention from systematic review authors and methodologists, probably for being intuitively more appealing and long-established since the introduction of NMA [2, 12, 13]. Local inconsistency evaluation aims at closed loops of evidence in the network (there is direct and indirect evidence for the involved treatment comparisons), where specific treatment comparisons are targeted to disentangle the direct from the indirect effect and calculate their difference, known as inconsistency [12]. Typically, the selected comparisons are inspected for statistically significant inconsistency manifested as a two-sided p-value of the Z-test that does not exceed a significance level (usually at 5% or 10%) or 95% confidence (credible) intervals that exclude a zero inconsistency [12, 14]. We call this framework ‘standard decision-making’.
Nevertheless, undue reliance on these measures may mask a material inconsistency when the comparisons in the loops are insufficiently informed, and between-study variance is substantial, as there is likely low power to detect a statistically significant inconsistency [15]. On the other hand, researchers often misinterpret a statistically non-significant inconsistency as proof of consistency. Clearly, a different route is needed when interpreting results from local inconsistency evaluation to protect against (1) missing material inconsistency due to low-power issues and (2) misinterpreting statistically nonsignificant inconsistencies as evidence of consistency, a necessity also echoed by other authors and pertains to global inconsistency assessment, as well [16].
We draw inspiration from the Kullback–Leibler divergence (KLD) measure to set up a novel and straightforward interpretation framework for local inconsistency evaluation that (1) shifts from p-values and confidence (credible) intervals to the whole distribution of the estimated direct and indirect effects and (2) semi-objectifies the thresholds selected to aid interpretation. The KLD is a well-established measure of entropy that quantifies information loss between two distributions, D for the observed data and A as an approximation of D, by using distribution A rather than D [17]. A similar analogy can be transferred to the NMA framework when assessing inconsistency locally: how much information is lost when the indirect effect replaces the direct effect, and vice versa, for a selected comparison. Minimum information loss would imply low inconsistency that may not threaten the validity of NMA results. A carefully selected threshold is required to define minimum information loss, and access to relevant empirical evidence may play a pivotal role in developing an intuitive decision threshold.
The rest of the article is structured as follows. We first present three motivating examples from methodological articles on local inconsistency evaluation using the node-splitting and back-calculation approaches [14, 18]. Then, we introduce our proposed interpretation framework for local inconsistency evaluation based on the KLD measure. We demonstrate our framework using the motivating examples. Finally, we discuss our framework, juxtaposing the evidence from the relevant published literature, and conclude with the usefulness of the proposed framework when interpreting the local inconsistency evaluation results.
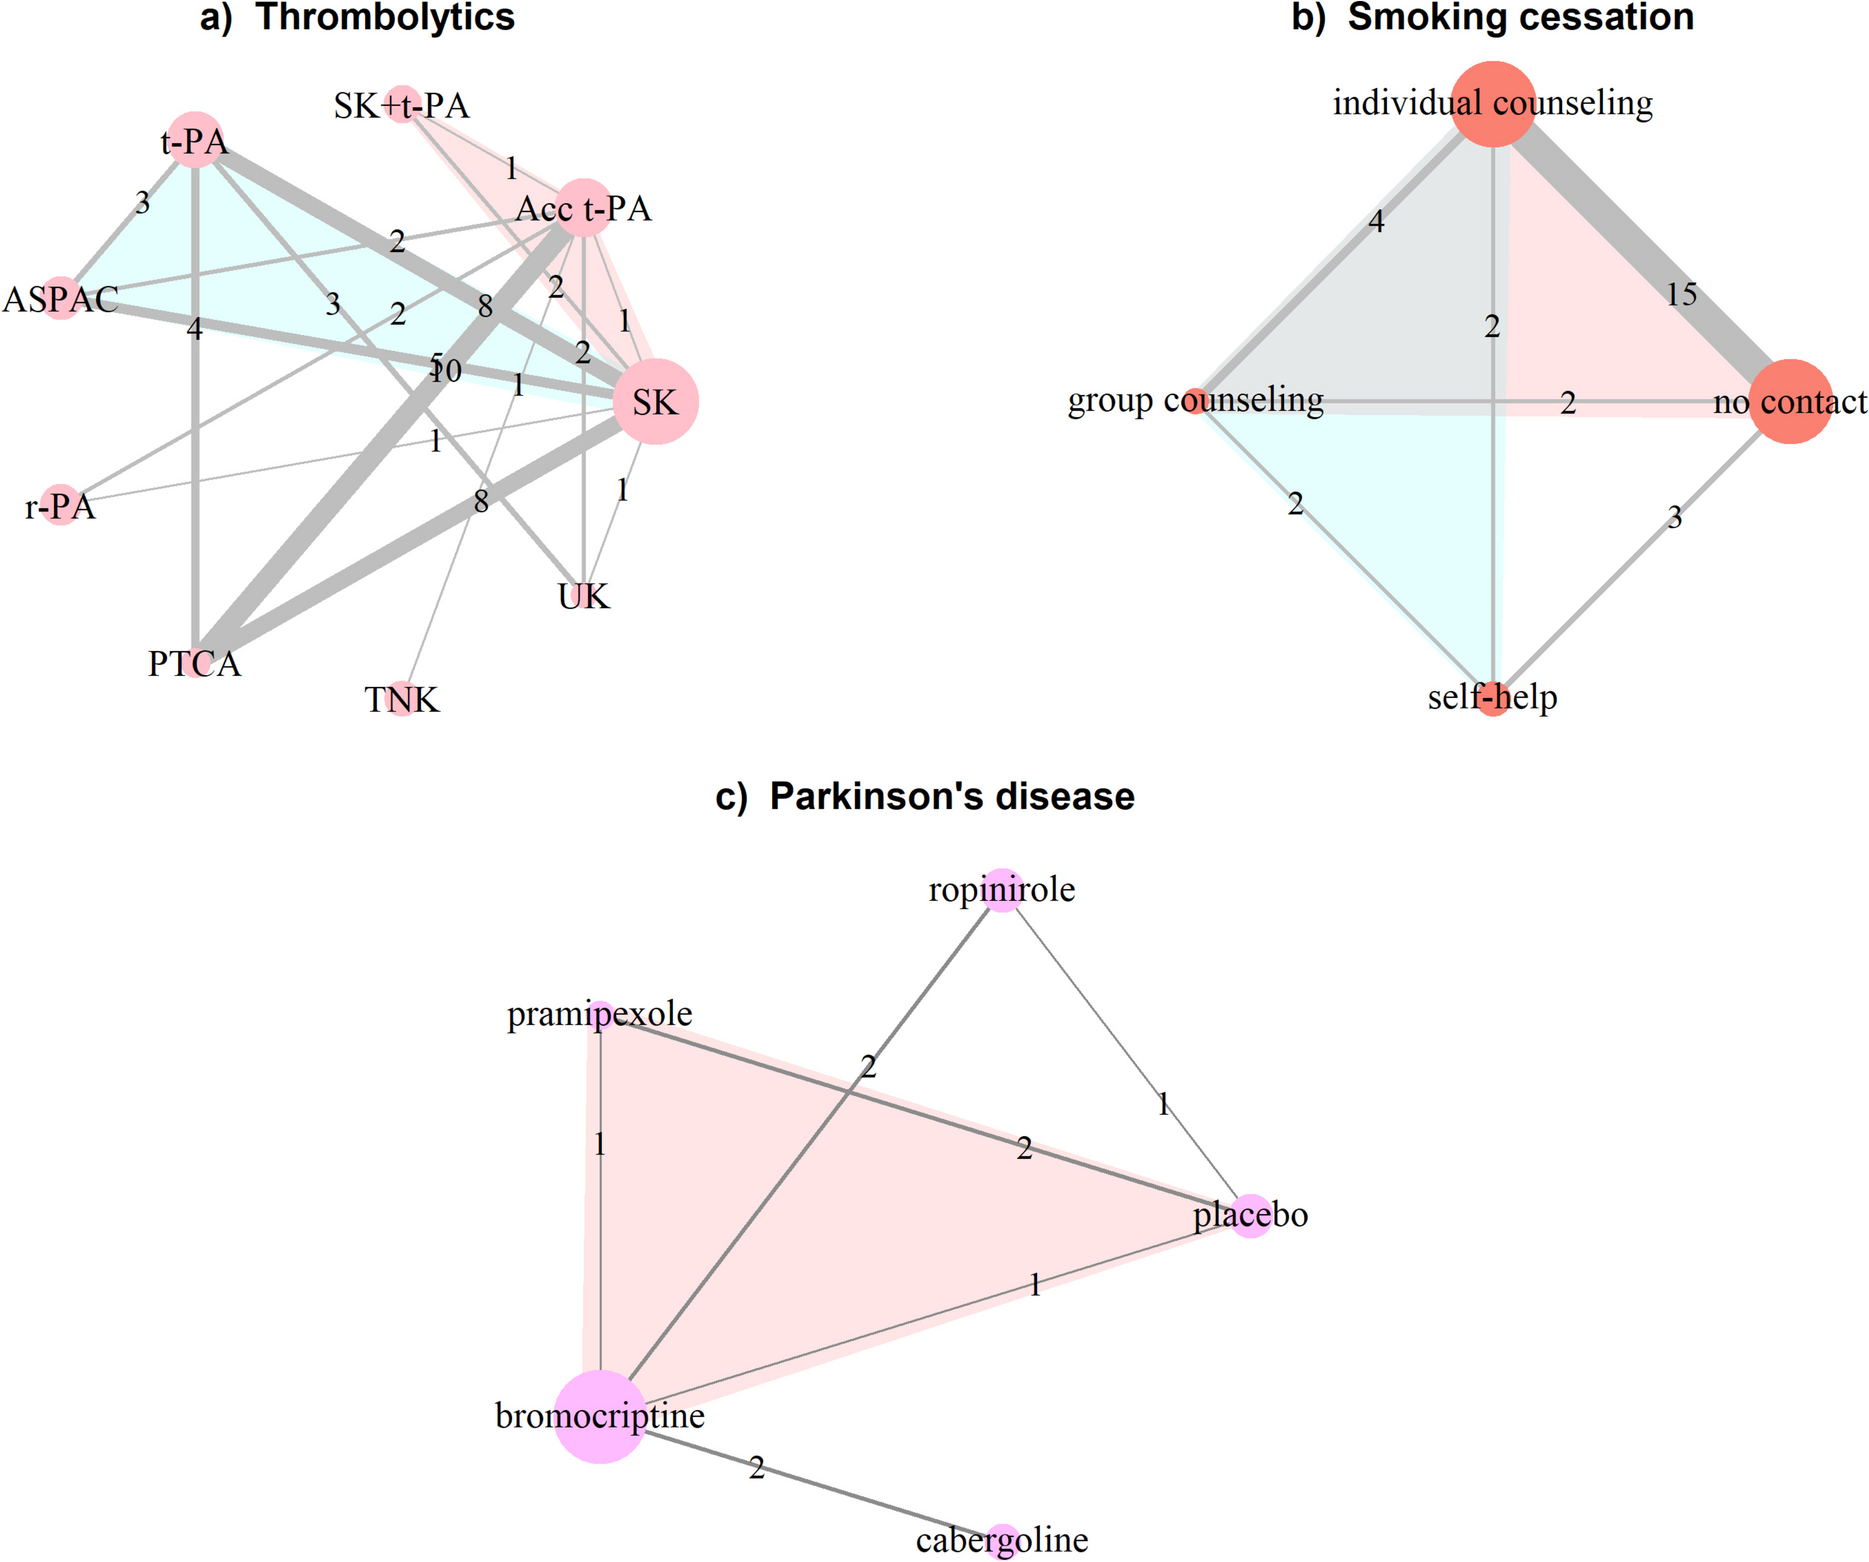
Motivating examplesThe first example is the well-known network of 50 studies (48 two-arm and 2 three-arm) comparing 8 thrombolytic treatments and angioplasty administered after acute myocardial infarction (thrombolytic network): streptokinase (SK), alteplase (t-PA), accelerated alteplase (Acc t-PA), streptokinase plus alteplase (SK + t-PA), reteplase (r-PA), tenecteplase (TNK), percutaneous transluminal coronary angioplasty (PTCA), urokinase (UK), and anistreplase (ASPAC) [19, 20] (Fig. 1a). The outcome is binary and refers to death in 30 or 35 days. Dias et al. [14] used a fixed-effect model to apply two local inconsistency methods, the back-calculation, and node-splitting approaches. The authors reported the posterior mean and standard deviation of NMA, direct and indirect log-odds ratios (OR), the inconsistency estimate, and the two-sided Bayesian p-values for each selected comparison (split node) (Table 2 in [14]).
Fig. 1
Network plots on a thrombolytics (first example) [19, 20], b smoking cessation (second example) [21], and c Parkinson’s disease (third example) [22]. Each node refers to a treatment and each edge to an observed (direct) comparison. The nodes’ size and the edges’ thickness are proportional to the number of randomised participants in the respective treatments and the number of studies investigating the respective comparisons. Numbers on the edges refer to the number of studies. Coloured loops indicate multi-arm studies. Acc t-PA, accelerated alteplase; t-PA, alteplase; ASPAC, anistreplase; PTCA, percutaneous transluminal coronary angioplasty; r-PA, reteplase; SK, streptokinase; SK + t-PA, streptokinase plus alteplase; TNK, tenecteplase; UK, urokinase
Another well-known dataset is the network of smoking cessation treatments, which comprised the second example [21]. The network includes 24 studies (22 two-arm and 2 three-arm) investigating different sets of 4 smoking cessation counselling programmes, including no intervention, self-help, individual, and group counselling (Fig. 1b)). The outcome is binary and refers to smoking cessation (yes or no) at 6 to 12 months. Dias et al. [14] applied the node-splitting approach using a random-effects model. The authors reported the results in line with the first motivating example (Table 3 in [14]).
The third example is a network of seven studies (six two-arm and one three-arm) investigating four dopamine agonists and a placebo for Parkinson’s disease [22]: pramipexole, ropinirole, bromocriptine and cabergoline (Fig. 1c). The outcome is the average off-time period where Parkinson’s symptoms are out of control. The dataset was used by van Valkenhoef et al. [18] to illustrate their approach to automatic node splitting. They reported a forest plot with the posterior NMA, direct and indirect mean differences (MD), and the two-sided Bayesian p-value for inconsistency for the split comparisons (Fig. 6 in [18]).
Comments (0)