
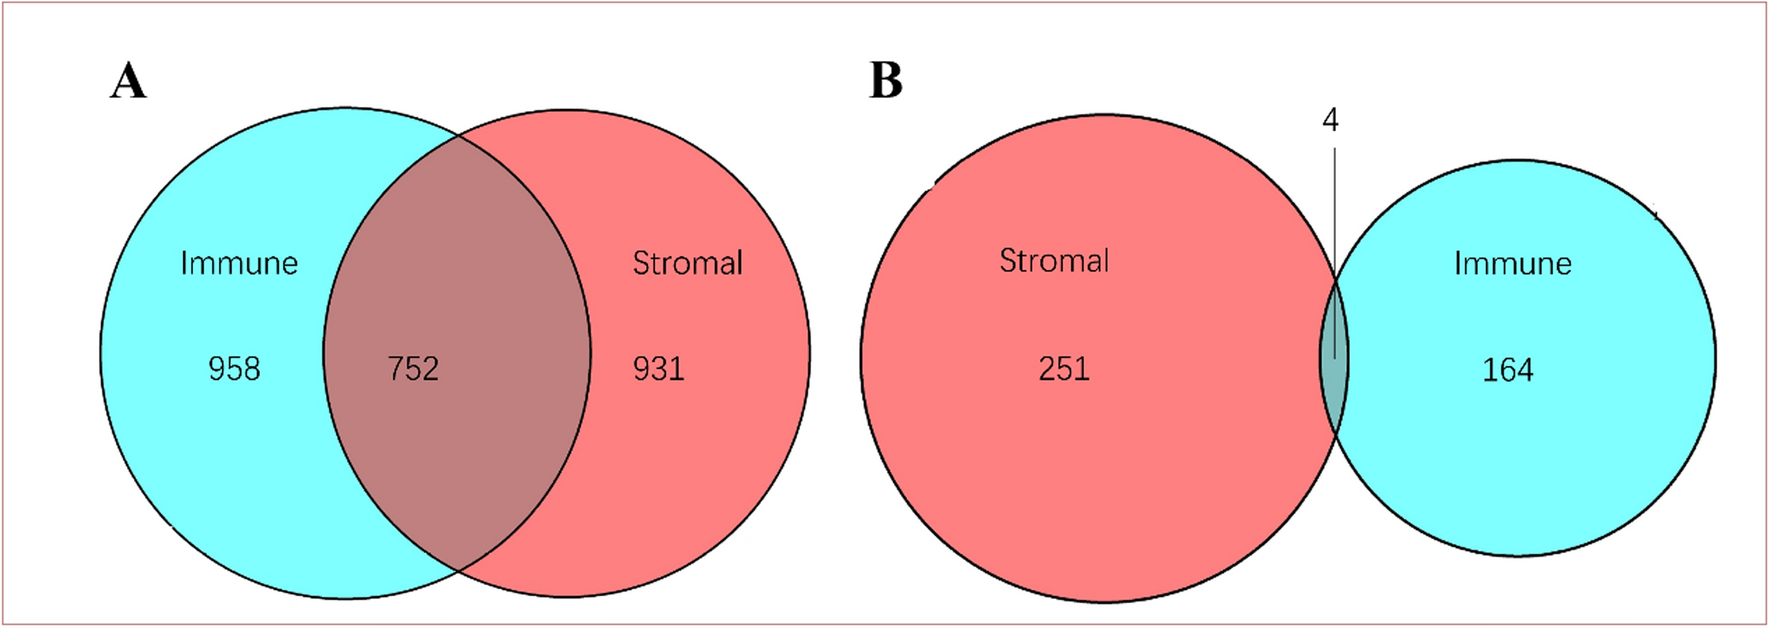
Remember me

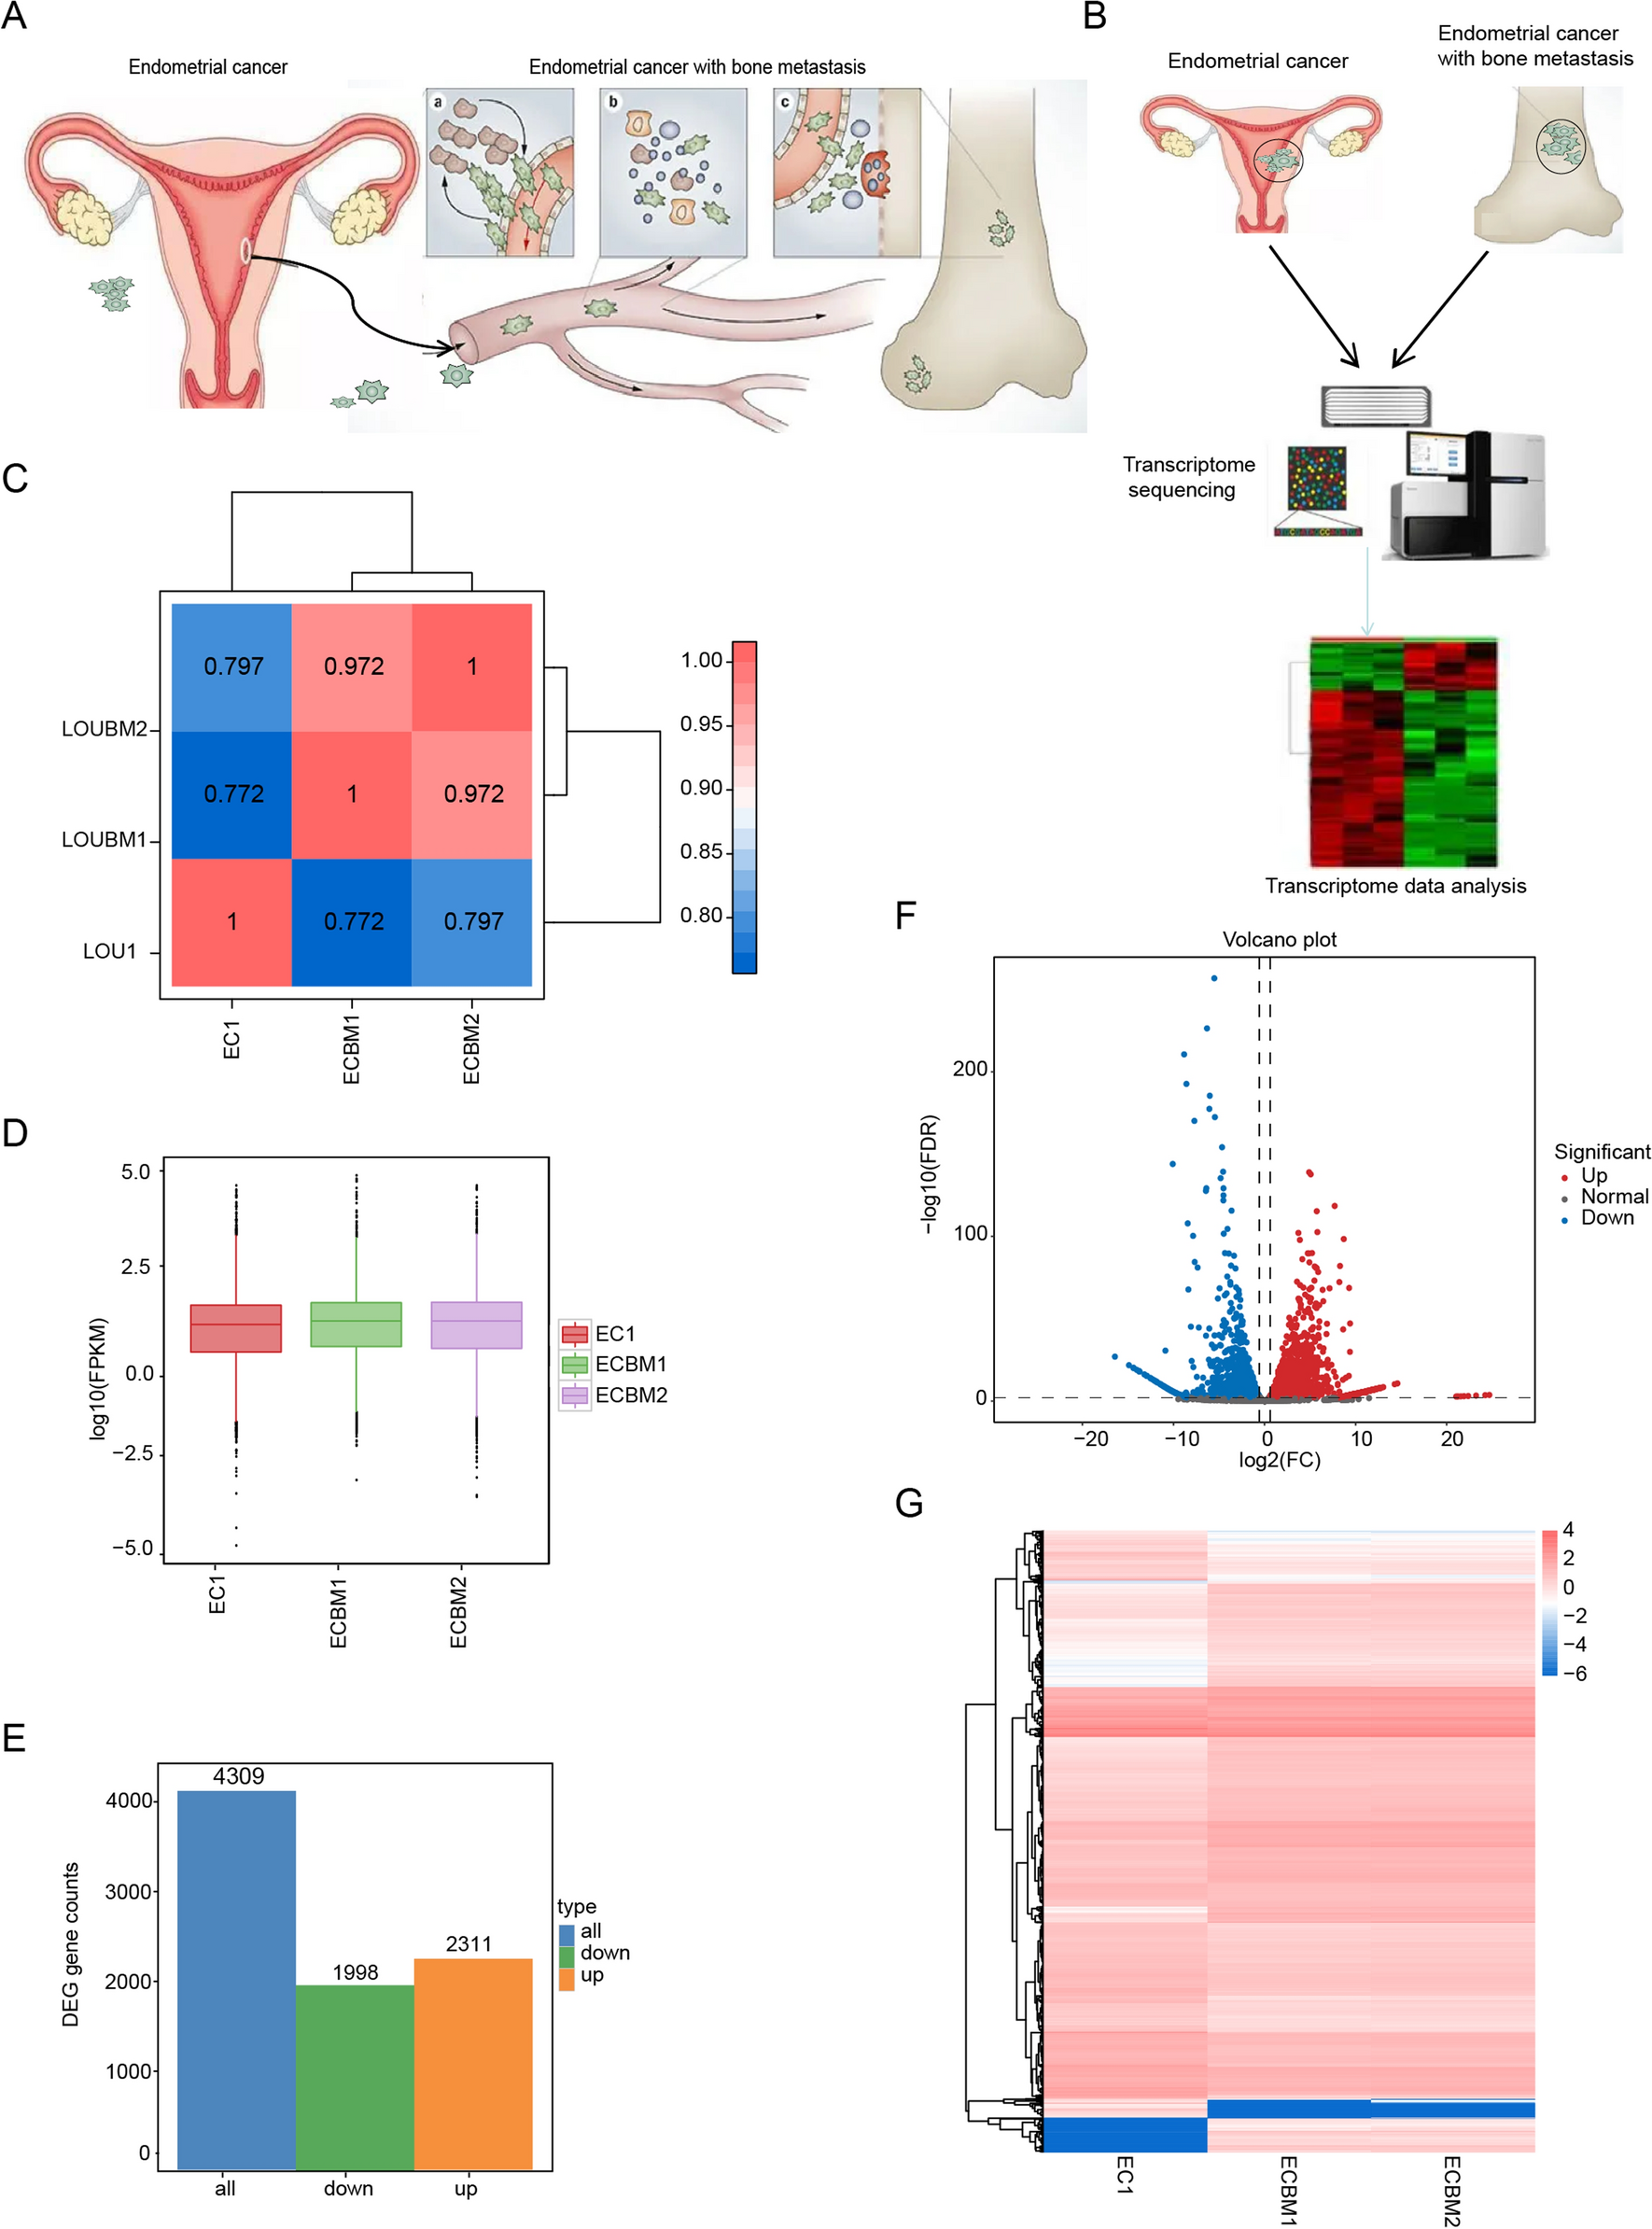

To obtain biological characteristics in aspects of proliferation, inflammation, and hypoxia within the sample breast tumor at different spatial locations, common markers of Ki-67, COX-2, and CA IX were probed by immunohistochemistry and evaluated for grading based on staining intensity (Fig. 1d, Supplementary Fig. 1). To avoid operational errors during experimental procedures, an automated equipment was deployed using the recommended protocols from the manufacturers. The semi-quantification of the staining was determined by summarizing the evaluation from multiple experienced professionals from the pathology department. The coefficient of variation (CV) of Ki-67, COX-2, and CA IX staining from a total of 30 sampling sites was calculated as 36.8%, 44.9%, and 42.6% respectively. The data indicated that intratumorally heterogeneity indeed existed among different spatial locations within the tumor mass, nonetheless, it was an expected result as the varied biological characteristics in tumors were usually seen to be reflected by these commonly used markers. From further analysis of the interconnection between the stained markers, it was interesting to find out that all the compared pairings were statistically different, with Ki-67 and CA IX showing a more significant correlation coefficient (Table 1). The results could be explained as the outcome of the interplay between rapid tumor cell proliferation and hypoxia induction in the local environment. The fast-growing tumor mass often causes local hypoxia conditions from insufficiency of oxygen and nutrients from the blood supply. In turn, hypoxia-induced overexpression of transcription factors, signal molecules and secretory protein or inflammatory factors could stimulate tumor cells to proliferate with acceleration [21]. The discoordinance of these regulatory mechanisms could eventually cause or at least significantly contribute to the development of heterogeneity in tumors.
Table 1 Correlation between Ki-67, COX-2, and CA IX expression at different spatial locations3.2 Anatomical reconstruction for holistic views of analyzed cancer markersAn MRI series consisting of 128 consecutive scans were converted into a 128-frame image stack and subjected to three-dimensional (3D) reconstruction using Image J software (Fig. 1f). Voxels of the tumor mass were extracted by adjusting the threshold values for segmentation, and the size and boundary information of the tumor were obtained and used for creating the cropped subset of the digitally isolated tumor (Fig. 1e). The scaled quantification from the 30 sampling sites of each stained marker was mapped into the 3D reconstructed tumor shape according to the exact measured spatial co-ordinance. The expression variances of the markers and the possible error limits of spatial location were calculated and marked in Fig. 1e. Using information from limited sampling sites to represent the projected marker staining of the whole tumor mass, a 3D Voronoi algorithm was used to determine the section domains where the measured values could best describe the located regions. The watershed filling was performed to reassign the adjacent voxels with the intensity in grayscales for the projected staining of marker expression. The reconstructed marker expression profile in 3D was visualized using the 3D viewer plugin embedded in the software (Fig. 2a). To evaluate the correlation of the marker expression levels, a module for voxel colocalization analysis was used and the Ki-67, COX-2, and CA IX signals were compared pairwise as in separate channels. The correlation coefficients were calculated and shown in Table 2, where the value for the correlation between Ki-67 and CA IX was the highest (R = 0.770). All markers appeared to have a significant correlation with the MRI intensity, especially at the anatomic center region of the tumor, suggesting that the expression of different markers was less divergent at the early stages of tumor development.
Fig. 2
Holistic view of cancer markers and comprehensive clustering analysis of multi-dimensional data. a The reconstructed 3D model for holistic view of Ki-67, COX-2, and CA IX. b The construction of the projected tumor growth model amplified from the anatomical center (left) and the density center readout from MRI images (right). c Cluster analysis based on multi-dimensional measurements from both imaging and pathology for representation, evaluation, and discovery of tumor heterogeneity. d Reconstructed image from vascular enhanced MRI images indicating the tumor mass with the overlayed marks of high heterogeneity sites as identified from C
Table 2 Correlation of Ki-67, COX-2, and CA IX distribution in reconstructed model3.3 Asymmetrical pattern of cancer marker distribution and its implication for tumor growth modelsAs the large tumor provided a good opportunity to obtain sufficient density data for describing the tumor mass from MRI images, it allowed the study to use hypothetical projection to construct possible tumor expansion models. Theoretically, the growth of tumor mass would be expected to follow a linear propagation profile without apparent intervention. In the case of large tumors with regular shapes, the tumor under investigation in this study could be a suitable sample to mathematically evaluate related models. We first generated a voxel data set calculated by a 3D linear propagation model and simultaneously determined the edges for the stopping of diffusion (Fig. 2b left). We calculated the anatomical center of the tumor from the enhanced MRI images and assumed that the center spot was the primary origin of tumor initiation with the maximum values of detected tumor staining signal. By calculating the correlation coefficient of projected marker distribution and the measured realistic values at the sampling sites using a colocalization analysis program, we could estimate which specific marker better represented the tumor growth profile, or whether the projected model could be improved by adjusting the propagation center position for better data fitness.
Considering the irregularity in MRI pixel density at different positions within the tumor mass, we also attempted to improve the correlation analyses by calculating the spatial center of mass of the tumor and used for reconstruction of the propagation model (Fig. 2b right). No significant improvement was observed as indicated by the small increase in coefficient number (Supplementary Table 1). The results showed the correlation of all three cancer markers of their expression levels exerted the positive values in coefficient measures, indication Ki-67, COX-2 and CA IX indeed significantly contributed to the tumor mass expansion as driving factors commonly acknowledged. However, the R values were relatively low in numbers, suggesting that a simple linear model was insufficient to profile the complex behavior of cancer growth. Interestingly, COX-2 and CA IX gave larger R(obs) of 0.410 and 0.354 respectively than Ki-67 (R = 0.267). As the former is a marker partially reflecting the tumor environmental conditions, we postulated that environmental factors were unneglectable, including ones released from necrotic cells or the paracrine from adjacent tissues that could influence to a great extent cancer cell proliferation. For COX-2 which produced the best coefficients, it was known to closely relate to the oxygen supply and inflammatory responses requiring blood vessel infiltration (Fig. 2d). Therefore, it implied that a large tumor as its growth in size could be significantly related to the angiogenesis process.
3.4 Comprehensive clustering analysis of multidimensional dataBesides the main set of MRI series used for analyses in this study, we also obtained additional two medical digital imaging sets with different methods of enhancement from the patient. Combining with the pathology grading results of marker staining, multidimensional data grids can be formatted through normalization and subjected to cluster analysis (Fig. 2c). From such comprehensive analysis, the similarity and grouping of the characteristics at each anatomic site could be globally displayed and reviewed (Fig. 2d). The results showed that the sites at adjacent locations tended to be clustered at closer distances, which was expected in large and regular-shaped tumor masses. The Ki-67 associated with CA IX was better than with COX-2, which was also reasonable based on reports of their usage as cancer progression markers. These results were consistent with our previous correlational analyses on Ki-67, COX-2, and CA IX expression, where the signals of COX-2 were more heterogeneous and influenced by peripheral factors. An important readout from the cluster analysis (as marked as the branch in red color) was that the tumor heterogeneity could be manifested as the contrast in measured values between MRI density and marker staining intensity. The intratumoral heterogeneity of the identified sites could be developed surrounding the necrotic regions and did not necessarily have to be adjacent to each other. Here, this type of comprehensive statistical analysis demonstrated its great power for tumor heterogeneity studies, and the resolution and performance will be improved as more channels of data from either imaging or pathology parameters are provided.
3.5 Whole transcriptome sequencing for holistic views of a more complete gene expression profileTo further clarify factors that drive intratumoral heterogeneity, we performed whole transcriptome sequencing of 12 samples from different spatial positions within the breast tumor mass tissue (Fig. 3a). Unlike classic studies that used whole tumor tissue as experimental samples, all samples used for RNA-seq in the present study were obtained by puncturing. Therefore, to avoid operational errors caused by sampling, we first compared the Q30 values of RNA-seq data from the 12 samples as a quality control. According to the result, it was found that the Q30 values of all samples were above 89.98% (89.98%-91.83%), which indicates that the quality of all samples was above the standard for further analysis. Next, we performed a comparison of the global gene expression levels by mean FPKM value among all 12 samples to holistically demonstrate if there are any transcriptome-wide expression differences. The results indicate a significant intratumoral heterogeneity among 12 samples, the sample from the vertical-superficial-foot (ID: Y1) direction has the highest mean expression level (mean FPKM: 518.07) and the sample from sagittal-foot-medial (ID: Z1) direction has the lowest mean expression level (mean FPKM: 97.05).
Fig. 3
Holistic view of cancer markers and related gene set analysis of multi-dimensional RNA-seq data. a The evaluation of expression heterogeneity of cell proliferation, inflammation, and hypoxia-related gene set within the tumor mass. Each cubic represent the location diagram of the samples selected for whole transcription sequencing including four samples selected from the coronal axis (X1: coronal-medial-superficial close to x1a to x3a in IHC assay, X2: coronal-lateral-superficial close to x3a to x5a, X3: coronal-medial-deep, close to x1b to x3b, X4: coronal-lateral-deep, close to x3b to x5b); four samples selected from vertical axis (Y1: vertical-superficial-foot, close to y1a to y3a in IHC assay, Y2: vertical-superficial-head, close to y3a to y5a, Y3: vertical-deep-foot, close to y1b to y3b, Y4: vertical-deep-head, close to y3b to y5b) and four samples selected from sagittal axis (Z1: sagittal-foot-medial, close to z1a to z3a in IHC assay, Z2: sagittal-head-medial, close to z3a to z5a, Z3: sagittal-foot-lateral, close to z1b to z3b, Z4: sagittal-head-lateral, close to z3b to z5b). The front view, vertical view, and side view of each cubic represents cell proliferation (480 genes), inflammation (369 genes), and hypoxia (117 genes) related gene set, respectively. The color of each dot was assigned by ranking the FPKM value of each gene within 12 samples using 3 color scale formatting (The top color represents values larger than 90%, the center color, represents middle values from 55%-90%, and the bottom color represents values from 10%-55%). Meanwhile, three key genes (MKI67 gene, MT-CO2 gene, and CA9 gene) were highlighted. b The evaluation of axis asymmetry of three axes. The front view, vertical view, and side view of the cubic represent Z-axis direction, Y-axis direction, and X-axis direction of the original tumor mass. The radar charts’ 3 radial axes respectively represent cell proliferation, inflammation, and hypoxia. Scales on each axis are labeled as FPKM values for the genes of each relevant gene set. The median expression level (FPKM value) of each relevant gene set for a sample is used to graph that sample
During immunohistochemistry and staining intensity analysis, Ki-67, COX-2, and CA IX were used as common markers to obtain biological characteristics related to cell proliferation, inflammation, and hypoxia among samples. Based on the results of high-throughput sequencing data, we attempted to present high-dimensional data through pathway analysis to confirm intratumoral heterogeneity in the expression of genes related to cell proliferation, inflammation, and hypoxia. To achieve this, we searched the GSEA C2-Canonical pathways database and retrieved a total of 479 genes in the cell proliferation gene set, 368 genes in the inflammation gene set, and 117 genes in the hypoxia gene set. Since the CA9 gene was already included in the hypoxia gene set, the MKI67 gene was incorporated into our set of proliferation-related genes. Similarly, the MT-CO2 gene was included in our set of inflammation-related genes for subsequent analysis. Both the MKI67 and MT-CO2 genes had been subject to examination in previous immunohistochemical (IHC) studies due to their established connections with cell proliferation and inflammatory processes, respectively. According to the pathway analysis results, there is significant heterogeneity among the 12 samples in terms of cell proliferation, inflammation, and hypoxia-related pathways. The sample with the highest expression level of genes in these three gene sets, indicating the most transcription activity, was from the vertical-superficial-foot direction (ID: Y1), with mean FPKM values of 1867.74, 4779.68, and 3706.79 for cell proliferation, inflammation, and hypoxia, respectively. In contrast, the sample with the least transcription activity was from the sagittal-foot-medial direction (ID: Z1), with mean FPKM values of 327.46, 748.34, and 660.43 for cell proliferation, inflammation, and hypoxia, respectively. (Fig. 3a, Supplementary Table 2–4). In addition to the pathway analysis, we also calculated the coefficient of variation to evaluate the axial asymmetry within each axis in large tumors globally and focused on three different pathway gene sets across samples in four directions on each axis. According to the global comparison results, the axial asymmetry among the four samples on the sagittal (Z) axis shows the most variation (with a CV value of 51.91%), while the coronal (X) axis has the least variation (with a CV value of 13.15%). Consistent with the global gene expression results, the axial asymmetry among samples is most pronounced among the four samples on the sagittal (Z) axis (with CV values of 57.53%, 58.24%, and 63.01% for cell proliferation, inflammation, and hypoxia, respectively). These findings suggest that there is a significant degree of heterogeneity in the expression of genes related to cell proliferation, inflammation, and hypoxia both globally within the tumor and across different samples along the sagittal axis. (Fig. 3b and Supplementary Table 5). These findings suggest that there is considerable intratumoral heterogeneity and axial asymmetry in the expression of genes related to cell proliferation, inflammation, and hypoxia within the tumor samples which are consistent with the results obtained from the immunohistochemistry and staining intensity analysis. Meanwhile, the most significant degree of heterogeneity is present across different samples along the sagittal axis.
In addition, our study also compared the correlation among the pathways of proliferation, inflammation, and hypoxia. We found that the proliferation and hypoxia pathways showed the highest correlation coefficients (R = 0.955), suggesting that there may be an interplay between rapid tumor cell proliferation and hypoxia induction in the local environment of breast cancer tissue.
Comments (0)