
Remember me

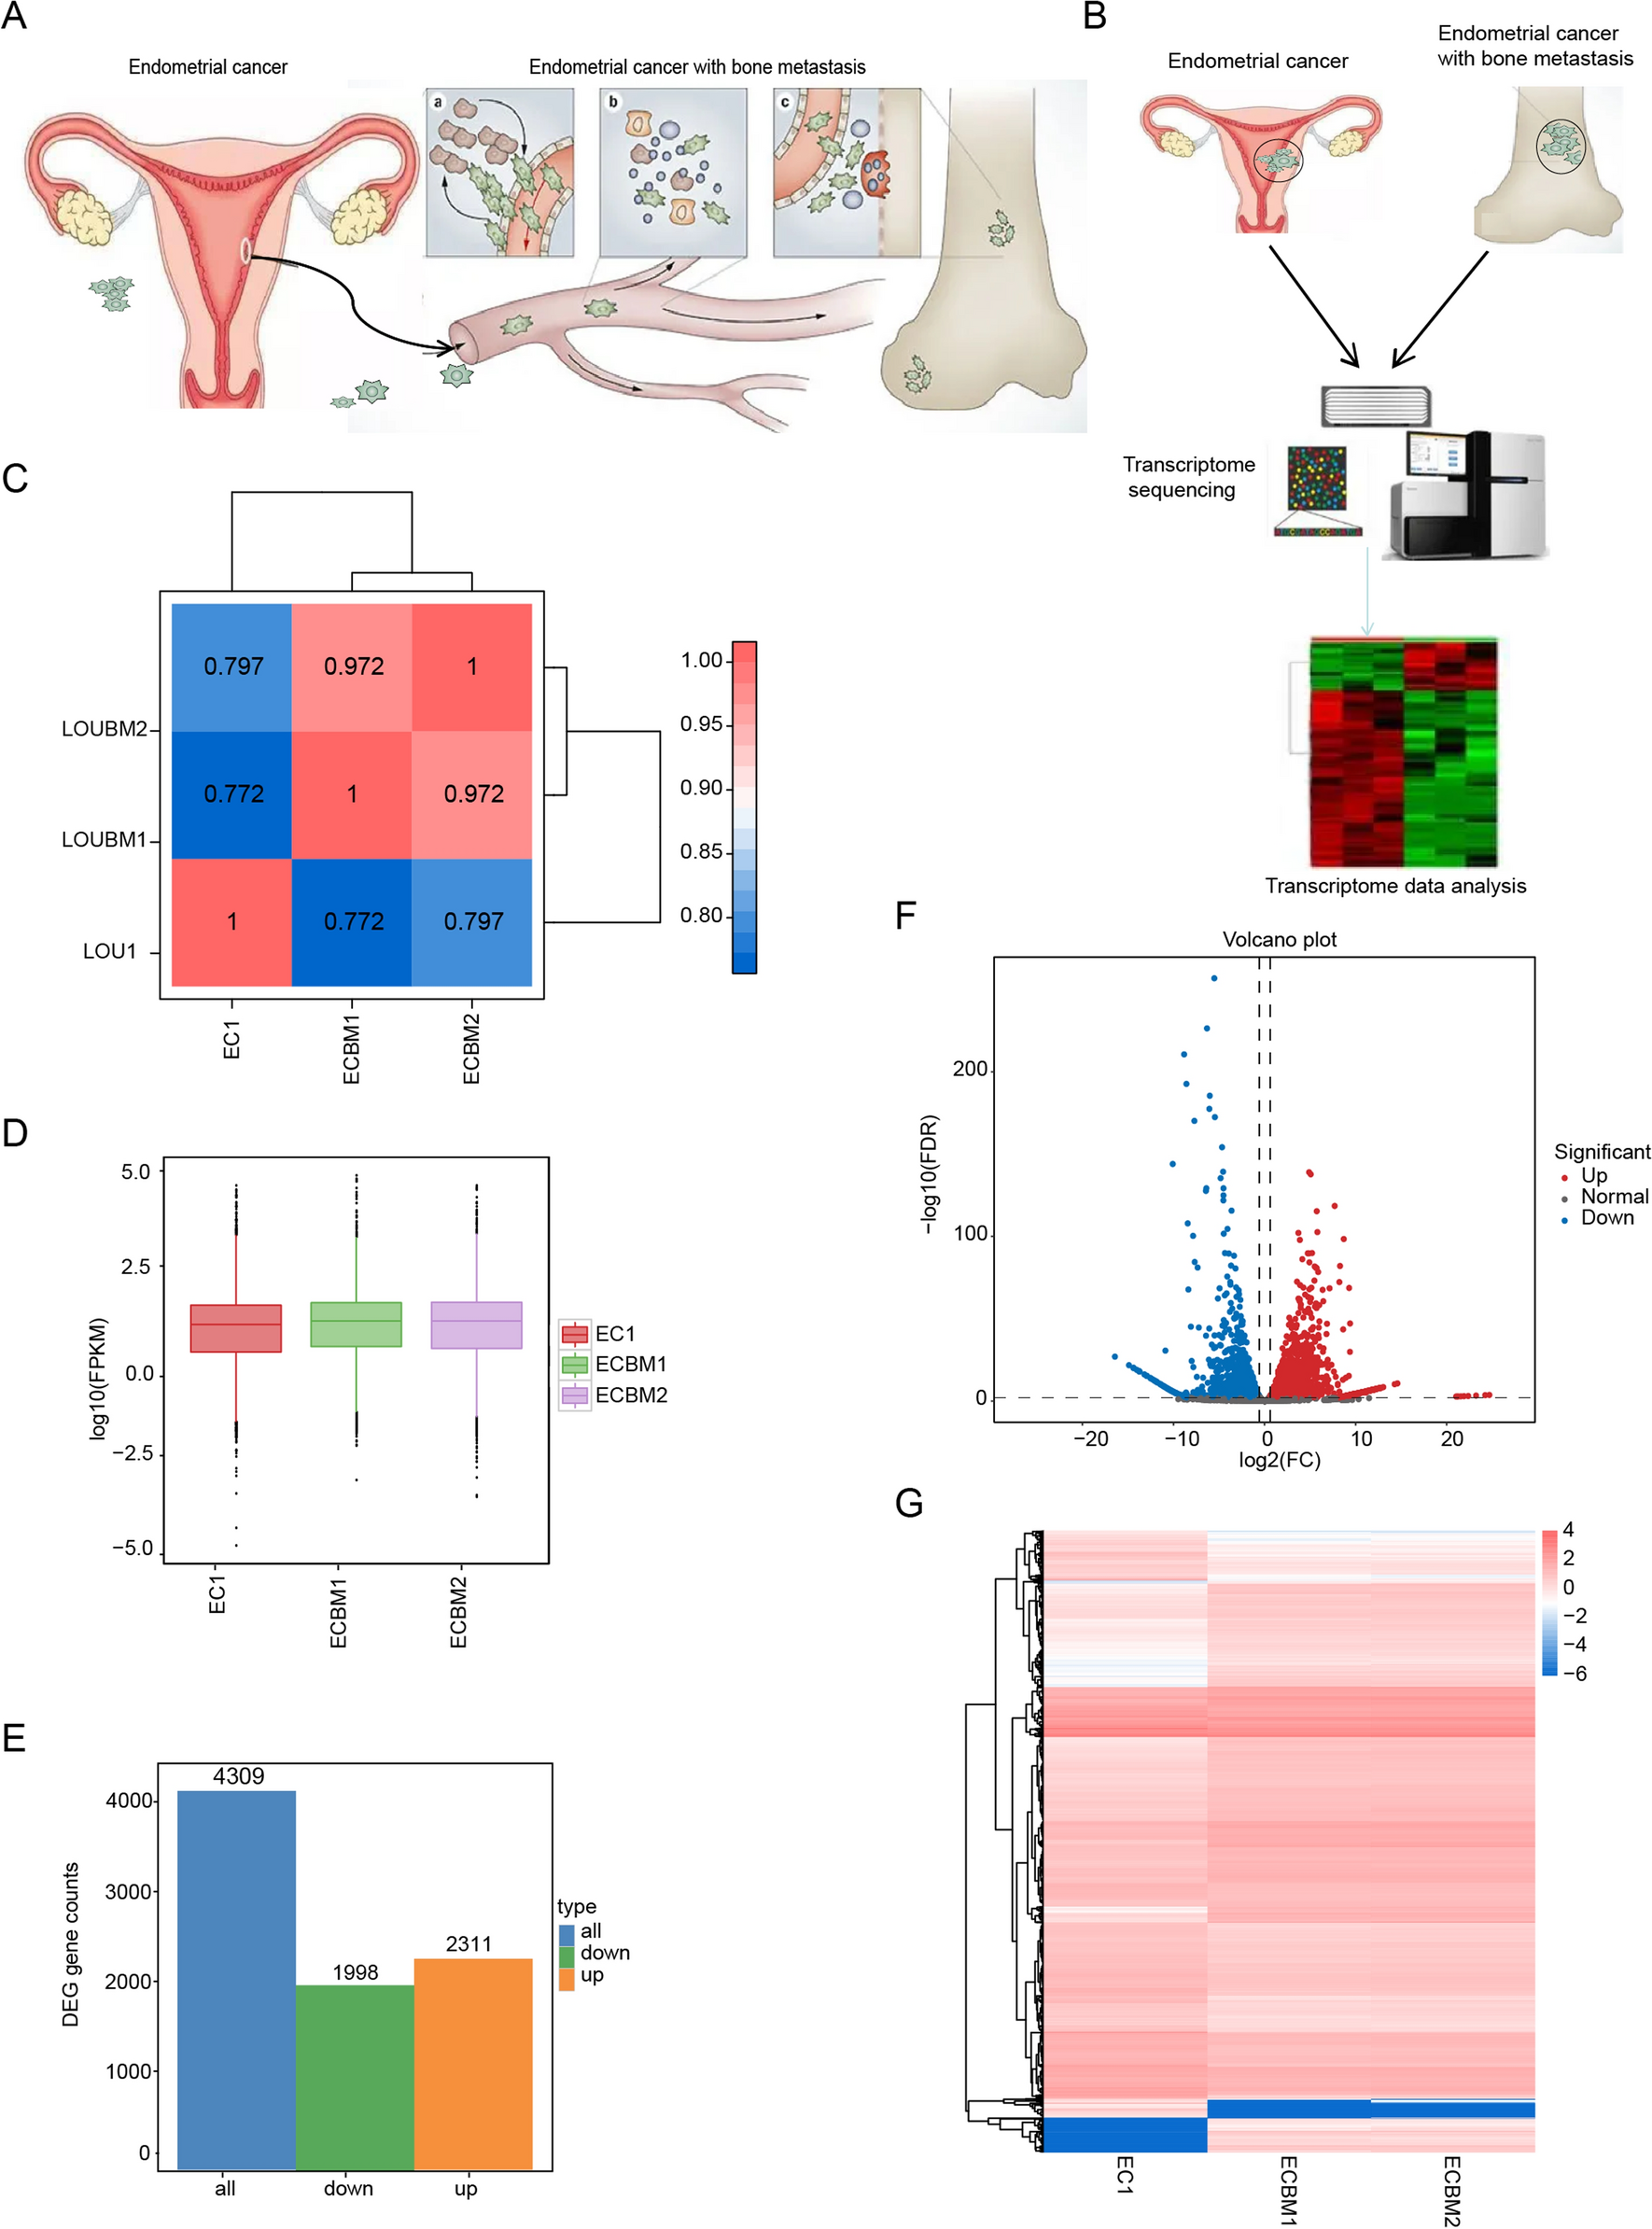

ECBM is classified as an advanced malignant tumor. Squamous cell carcinoma is a common pathological type [12]. The main treatment methods are surgery, radiotherapy, and chemotherapy [13]. It is crucial to select treatment plans based on the pathological type and extent of metastasis. With the rapid advancement of precision medicine and sequencing technologies, gene expression sequencing provides a theoretical basis for selecting treatment methods. We selected one sample of EC in situ and two samples of ECBM for transcriptome sequencing (Fig. 1A, B). Sample correlation analysis revealed significant outliers in EC in situ samples and in two bone metastasis samples. Gene expression differs significantly between these two sample types. The gene expression patterns in bone metastasis samples from two patients are similar and reproducible, suggesting consistent gene expression patterns in bone metastasis cancer (Fig. 1C). Creating box plots of gene expression levels for each sample allows for visualization of the dispersion within individual samples and facilitates an intuitive comparison of gene expression levels across different samples. The box plot of FPKM distribution in this study indicates minimal variation in gene expression levels and dispersion across the samples. (Fig. 1D). The total number of differentially expressed genes between ECBM and in situ EC is 4,309. Among these, 2,311 genes are upregulated, while 1,998 genes are downregulated. (Fig. 1E). We used volcano plots and heat maps to display genes with significant expression differences. For example, genes such as PCOLCE, SPP1, and KRT8 were significantly upregulated, contributing to tumor formation and development. (Fig. 1F, G).
Fig. 1
Gene expression profiling of EC and ECBM tissues. A Flow chart of the mechanism of ECBM. B The second generation sequencing platform was used to analyze the transcriptome of 3 samples of EC and ECBM tissues. C Heat map of expression correlation between EC and ECBM tissues. D Boxplots of FPKM for EC and ECBM tissues. E Number of genes in differentially expressed gene sets. Blue represents all differentially expressed genes, orange represents up-regulated genes, and green represents down-regulated genes. F, G The volcano plot and heat map shows the differentially expressed genes between EC and ECBM tissues
3.2 Different physiological functions regulated by differentially expressed genes in ECBM compared to ECThe expression of genes is influenced by various factors, including alternative splicing. Precursor mRNA generated by transcription can undergo multiple splicing processes, where different exons are selected to produce distinct mature mRNA molecules. These mRNA variants are then translated into different proteins, contributing to the diversity of biological traits. This process of post-transcriptional mRNA modification is known as alternative splicing. The various types of alternative splicing are illustrated in the accompanying figure (Fig. 2A). We separately observed the types, quantities, and proportions of variable splicing events in EC and ECBM. The results show that a significant number of variable splicing events occur in both EC and ECBM, which is a crucial factor contributing to changes in gene expression levels. (Fig. 2B). Compared to ECBM, EC exhibited significant changes in numerous genes. We classified and statistically analyzed the functions of the differentially expressed genes using COG (Clusters of Orthologous Groups of proteins) (Fig. 2C). The experimental results demonstrate that numerous differentially expressed genes are involved in the regulation of post-translational modification, protein turnover, cell cycle, and signal transduction mechanisms (Fig. 2C). Previous studies have shown that these signaling pathways are involved in the proliferation and migration of tumor cells. We used the Gene Ontology (GO) Consortium to perform functional annotation on differentially expressed genes. The GO annotation system is organized as a directed acyclic graph, consisting of three main branches: biological process, molecular function, and cellular component. Each term in the GO system represents a basic unit (entry or node), and corresponds to a specific attribute. By using the gene annotation results, differentially expressed genes can be classified and statistically analyzed at the secondary classification level of the GO database. This approach allows for a clearer understanding of the primary functional categories associated with these genes [14]. According to the analysis, numerous genes are involved in regulating cellular processes, biological regulation, cellular anatomical structures, intracellular activities, binding, and catalytic activities (Fig. 2D). We observed that many differentially expressed genes are involved in DNA replication and cell cycle regulation. (Fig. 2E). Tumor occurrence and progression are closely linked to the cell cycle and DNA replication processes.
Fig. 2
Different physiological functions regulated by differentially expressed genes in ECBM compared to EC. A (A) Exon jumping and multi exon jumping; B Single intron preservation and multi intron preservation; C Variable exons; D Variable transcription start site; E Variable transcription termination site; The red area represents the variable splicing type.B. The horizontal axis represents variable cut events, while a vertical axis represents variable cut classes. (1) TSS: Alternative 5 'first exon (transcription start site); (2) TTS: Alternative 3 'last exon (transcription terminal site); (3) SKIP: Skipped exon (SKIP_ON, SKIP_OFF pair); (4) XSKIP: Approximate SKIP (XSKIP_ON, XSKIP_OFF pair) single exon skipping (blurred boundaries); (5) MSKIP: Multi exon SKIP (MSKIP_ON, MSKIP_OFF pair); (6) XMSKIP: Proximate MSKIP (XMSKIP_ON, XMSKIP_OFF pair) multiple exon jumps (blurred boundaries); (7) IR: Intron retention (IR-ON, IR-OFF pair); (8) XIR: Proximate IR (XIR-ON, XIR-OFF pair) single intron retention (blurred boundary); (9) MIR: Multi IR (MIR-ON, MIR-OFF pair) multiple intron retention; (10) XMIR: Proximate MIR (XMIR-ON, XMIR-OFF pair) with multiple intron retention (blurred boundaries); (11) AE: Alternative exit ends (5 ', 3', or both); (12) XAE: Approximate AE variable 5 'or 3' end shear (blurred boundary). C Classification of differentially expressed genes by COG annotation. D GO enrichment bubble plot of differentially expressed genes. E GO annotation system for differentially expressed genes. The abscissa is the GO classification, the ordinate is the number of genes, blue is the Biological Process, green is the Cellular Component, and yellow is the Molecular Function
3.3 ECBM shows significant changes in cell cycle related genes compared to ECCompared to EC, ECBM exhibits significant changes in genes related to the cell cycle. (Fig. 3A). By selecting the top 10 enriched GO terms and creating an enrichment chord diagram, we observed that a significant number of genes are involved in regulating the cell cycle and proliferation. (Fig. 3B, Figure S1-A). For example, key genes such as E2F1, MCM2, RFC2, and ICAM1 are implicated in the metastasis and progression of ECBM. Many highly expressed genes in ECBM are involved in the synthesis of cytosolic components, the actin cytoskeleton, the MCM complex, chromosomes, centromeres, and the endoplasmic reticulum. This suggests that the cells are in a state of rapid proliferation. (Fig. 3C, D, Figure S1-B). The rapid proliferation of cells demands substantial energy. In genes highly expressed in ECBM, a significant number are involved in ATP synthesis. (Fig. 3E, F, Figure S1-C). Both the rapid accumulation of cellular components and the rapid synthesis of ATP prepare the cells for swift proliferation, facilitating an efficient mode of cell growth.
Fig. 3
Changes in cell cycle-related genes in EC compared to ECBM. A, B The biological processes of GO enrichment of differentially expressed genes were visualized using bar graphs and enriched string plots. C, D The cellular component enriched by GO of differentially expressed genes were visualized using bar graphs and enriched string plots. E, F The molecular function enriched by GO of differentially expressed genes were visualized using bar graphs and enriched string plots
3.4 Functional enrichment analysis of differentially expressed genes in EC and ECBMDifferent gene products coordinate to perform various biological functions. Annotating pathways for differentially expressed genes can provide deeper insights into gene functions. The KEGG (Kyoto Encyclopedia of Genes and Genomes) database systematically analyzes gene functions and genomic information. Researchers can use KEGG to study genes and their expression comprehensively. As the primary public pathway database (Kanehisa, 2008), KEGG offers integrated metabolic pathway searches. The database includes processes such as the biodegradation of organic matter, carbohydrate metabolism, nucleoside metabolism, and amino acid metabolism. We compared the differential genes and metabolic pathways between ECMB and EC, providing comprehensive annotations for the enzymes involved in each reaction step. This includes amino acid sequences and links to PDB entries. The KEGG annotation results for differentially expressed genes were categorized according to KEGG pathway types, offering valuable insights for in vivo metabolic analysis and metabolic network research. (Fig. 4A). The KEGG signaling pathway analysis reveals that numerous genes are involved in tumor formation and development. (Fig. 4B). We observed significant changes not only in the cell cycle but also in the Hippo signaling pathway, which regulates cell proliferation. Additionally, the adhesion regulation signaling pathways between cells also showed considerable alterations. These changes may be important factors contributing to tumor metastasis. (Fig. 4C, D). We also analyzed changes in immune-related regulation and identified significant alterations in the immune regulatory signaling pathways associated with ECBM. These alterations include changes in immune response and regulation, which are accompanied by abnormal activation of cellular activities. (Fig. 4E, Figure S2).
Fig. 4
Functional enrichment analysis of differentially expressed genes in EC and ECBM. A KEGG classification map of differentially expressed genes B The network diagram was used to visualize the enrichment degree of differentially expressed genes and KEGG pathways. C, D The KEGG enriched pathways of differentially expressed genes between EC and ECBM were visualized using bubble plots and bar graphs. E. GSEA analysis used KEGG pathway and GO as the gene set. The enrichment of cell activation, immune system process, regulation of immune system process and immune response was analyzed
3.5 Genes with high expression of ECBM promote malignant characterization of tumorsThe transcription factor binding site (TFBS) is a DNA sequence that interacts with transcription factors, usually ranging from 5 to 20 base pairs in length [15]. A transcription factor often regulates multiple genes simultaneously. The binding sites of a transcription factor on different genes exhibit a degree of conservation, though they are not entirely identical [15]. We used the R package TFBS Tools to predict transcription factor binding sites (TFBS) in the promoter regions of differentially expressed genes, defining approximately 1 kb upstream of each gene as a potential promoter region. This analysis was conducted with reference to the JASPAR database for transcription factor motifs (http://jaspar.genereg.net/) [16, 17]. By analyzing the binding sites of transcription factors, we can identify which transcription factors regulate gene expression and gain further insight into the regulatory mechanisms involved. We conducted a transcription factor locus analysis on genes with high expression in ECBM and discovered that numerous transcription factors associated with tumor occurrence and development are involved in the regulation of cell cycle regulatory genes. For example, factors such as SOX2, NUSAP1, and ACTA1 were identified (Fig. 5A). The highly expressed cell cycle genes in ECBM include P27, P19, and CDK1. We analyzed the survival curves associated with these genes (http://www.kmplot.com/) (Fig. 5B). The analysis results indicate that high expression of these genes is associated with decreased patient survival. Additionally, abnormal cell cycle regulation may contribute to the malignant characteristics of ECBM. Fusion genes are chimeric genes formed by connecting the coding regions of two or more genes end-to-end and placing them under the control of the same set of regulatory sequences (including promoters, enhancers, ribosomal binding sequences, and terminators). These fusion genes exhibit novel functions or functions distinct from those of the original genes and are specifically expressed under certain conditions [18]. We utilized Fusionmap to investigate gene fusion events in the transcriptome. Fusionmap initially identifies potential gene fusions by aligning sequences based on paired-end relationships within the genome and transcripts. It then filters out false positives by comparing results with databases such as NT. We observed significant differences in gene fusion rates between EC and ECBM. Specifically, the fusion rate was higher in EC compared to ECBM, which exhibited a lower fusion rate. These findings suggest that the occurrence of bone metastasis indeed leads to cellular reprogramming (Fig. 5C). We speculate that the cell cycle in EC cells is longer, which increases the likelihood of gene fusion events. In contrast, the cell cycle in ECBM cells is shorter, leading to accelerated proliferation and a decreased probability of gene fusion.
Fig. 5
Genes with high expression of ECBM promote malignant characterization of tumors. A Transcription factor binding site motif. B Kaplan–Meier survival curves of patients with high and low expression of P27, P19, and CDK1. C. The gene fusion events detected were in EC1, ECBM1, and ECBM2
Comments (0)