
Remember me

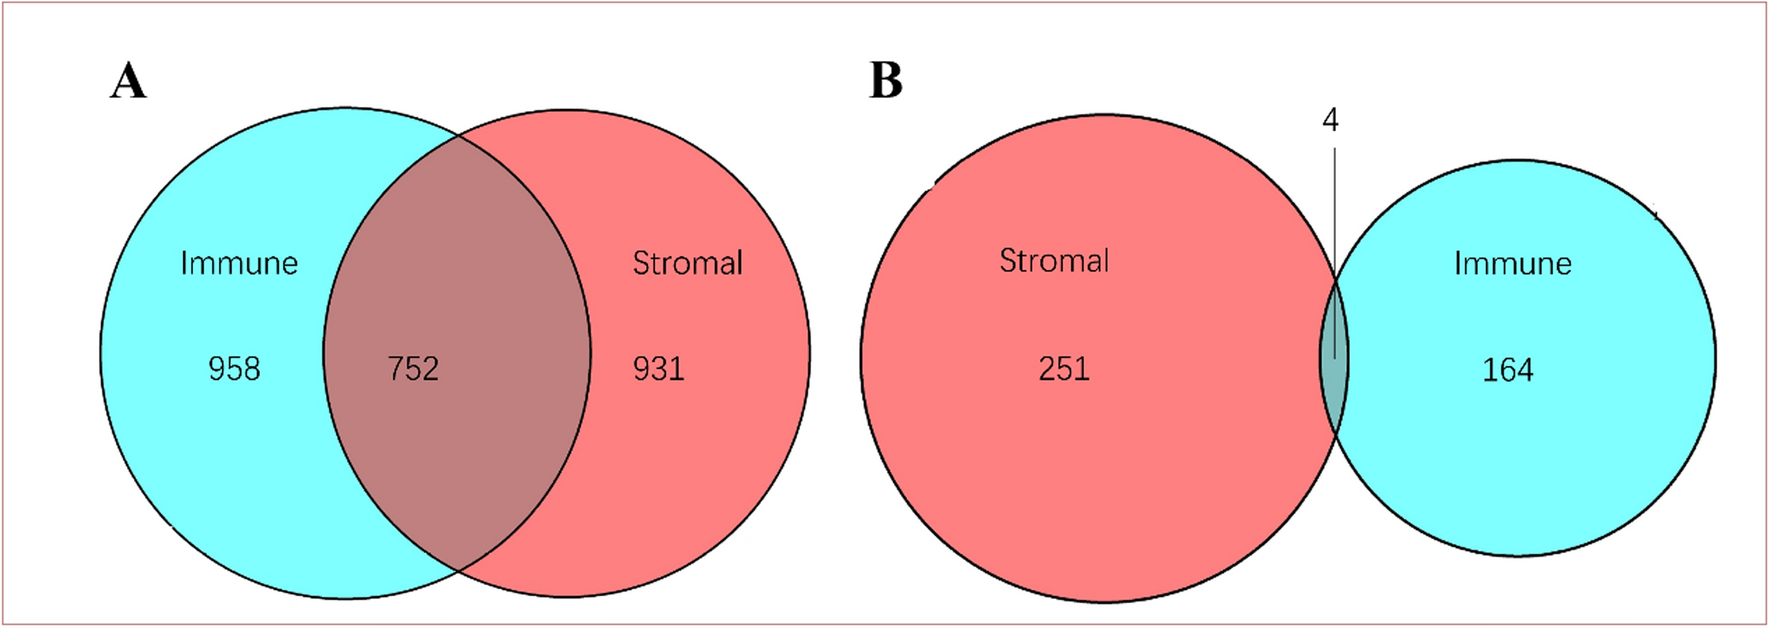

The ESTIMATE algorithm was used to estimate the immune and stromal ESTIMATE scores of 183 ESCC tumor samples. The immune score ranged from − 1575.54 to 3181.46, the stromal score ranged from − 2201.06 to 1891.71, and the ESTIMATE score ranged from − 3451.56 to 4858.15. Higher immune or stromal scores indicate more immune or stromal components in the TME. The ESTIMATE score is the sum of the immune and stromal scores, indicating the combined proportion of the two components in the TME. In order to investigate the potential relationship between gene expression profiles and immune/stromal scores, all patients were divided into high and low scoring groups using the median as the threshold value, and differential expression analyses were performed on the high and low groups. A total of 1182 DEGs were screened by differential analysis of high and low stromal scores, which contained 931 up-regulated DEGs and 251 down-regulated DEGs. Similarly, the differential analysis based on immune scores yielded 922 DEGs, including 758 up-regulated DEGs and 164 down-regulated DEGs. In addition, the DEGs of the two groups were taken to be intersected to obtain 752 up-regulated genes and 4 down-regulated genes common to both the immune scoring group and the stromal scoring group. These DEGs can be regarded as candidate TME-related genes (Fig. 1).
Fig. 1
Venn plots shared by stromal scores and immune scores. A Up-regulated genes and their intersection. B Down-regulated genes and their intersection
3.2 Enrichment analysis and protein interaction network analysisFunctional and pathway enrichment of 756 shared genes was analyzed (Fig. 2). For KEGG analysis, the most important pathways included: interaction of viral proteins with cytokines and cytokine receptors, chemokine signal pathways, Staphylococcus aureus infections, osteoblast differentiation, B-cell receptor signal pathways, the complement system, hematopoietic cell profiles, cell adhesion molecules, and others. Among them, GOs are mainly classified into three major categories, namely biological processes (BP), cytological components (CC), and molecular biological functions (MF). For BP, it is mainly enriched in leukocyte-mediated immune response, adaptive immune response, and lymphocyte-mediated immune response; the CC group is mainly enriched in the outer plasma membrane, protein complexes involved in cell adhesion, and secretory granule membranes; and the most important terms in the classification of MF include antigen-binding, immunoglobulin-receptor-binding, and immunoreceptor activity. The PPI network was further mapped to elucidate the interactions of shared DEGs which consisted of 193 nodes and 688 edges. The top 36 genes with the most connections to other genes are shown (Fig. 3).
Fig. 2
Functional and pathway enrichment analyses of 756 shared genes. A Top 30 KEGG enrichment analyses. B Top 8 GO enrichment analyses
Fig. 3
A PPI network graph of shared differentially expressed genes. B Statistics of connected nodes of PPI network graphs
3.3 Screening for core prognostic genesAmong the 36 pivotal genes, batch survival analysis was further performed using the Kaplan–Meier plotter online tool, and six genes, CD4, FCER1G, TYROBP, LCP2, C1QA, C1QB, were found to be significantly associated with OS of ESCC patients, and high expression of these genes predicted poor OS (Fig. 4).
Fig. 4
OS of differentially expressed genes at different expression levels in patients with ESCC. A CD4. B FCER1G. C TYROBP. D LCP2. E C1QA. F C1QB
By Combining with the aforementioned PPI network diagram, the result showed that CD4 and FCER1G were found to have the highest number of nodes and both of them had greater than 30, indicating that they may play a crucial role as hub genes in the TME of ESCC. Since FCER1G is less frequently studied in ESCC, it was finally selected for further study.
3.4 Expression and distribution of FCER1G in ESCCThe TCGA database was used to analyze and compare the FCER1G protein expression levels in ESCC and normal esophageal epithelial tissues. The results showed that the levels of FCER1G expression was significantly higher in ESCC than that in normal esophageal epithelial tissues (P < 0.05, Fig. 5A). In order to validate this result, we chose three of the GEO datasets to analyze the protein expression level of FCER1G in ESCC and normal esophageal epithelial tissues, including GSE20347, GSE161533, and GSE38129. The results showed that the protein expression level of FCER1G in ESCC was significantly higher than that in the normal esophageal epithelial tissues (P < 0.05, Fig. 5B).
Fig. 5
FCER1G protein expression levels in ESCC and normal esophageal epithelial tissues. A FCER1G gene expression levels (based on TCGA). B FCER1G gene expression levels (based on GEO); * P-value < 0.05, **** P-value < 0.0001
Immunohistochemistry was then used for further validation of the expression levels of FCER1G in ESCC. The results showed that FCER1G positive staining was predominantly localized on mesenchymal cells rather than cancer cells, and the number of FCER1G+ cells in cancer tissues (34.79 ± 12.89) was significantly more than that in adjacent normal tissues (9.51 ± 3.60, P < 0.0001, Fig. 6A–D).
Fig. 6
FCER1G expression in normal esophageal and ESCC tissues. A Normal esophageal tissue at low magnification (100x). B Normal esophageal tissue at high magnification (200x). C ESCC tissues at low magnification (100x). D ESCC tissues at high magnification (200x). E FCER1G+ cells in cancer nest infiltration. F FCER1G+ cells in Intra-tumor mesenchyme infiltration
It was observed that the distribution of FCER1G positive cells in ESCC was mainly divided into two patterns: (1) cancer nest infiltration: positive cells diffusely infiltrated in the nests of tumor cells; (2) intra-tumor mesenchyme infiltration: positive cells infiltrated in the mesenchyme between cancer nests. The results showed that FCER1G+cells were mainly distributed in the intra-tumor mesenchyme, while scattered infiltrations in the nests of the cancer were evident; FCER1G+ cells in the intra-tumor mesenchyme were significantly more than those in the cancer nests (P < 0.05, Fig. 6E, F). A Kaplan–Meier survival analysis showed that both patterns of infiltration correlated with OS. The cases with more FCER1G+ cells infiltrating in intra-tumor mesenchyme having a worse OS, but those with high-density infiltration into both intra-tumor mesenchyme and cancer nests having the worst OS (Fig. 7).
Fig. 7
Relationship between two infiltration patterns of FCER1G and survival time in ESCC patients. Group A: both low infiltration of cancer nests and intra-tumor mesenchyme; Group B: high infiltration of cancer nests and low infiltration of intra-tumor mesenchyme; Group C: low infiltration of cancer nests and high infiltration of intra-tumor mesenchyme; Group D: both high infiltration of cancer nests and intra-tumor mesenchyme
3.5 Association of FCER1G and M2 macrophagesTo further elucidate the effect of FCER1G on ESCC TME, 22 kinds of tumor-infiltrating immune cells (TIICs) were analyzed using the online CIBERSORT algorithm. Compared with the FCER1G low-expression group, the FCER1G high-expression group showed an increase in the infiltration of M2, M1 and M0 macrophages, activated CD4+ T-cells, activated NK cells, and resting mast cell infiltration increased, with the strongest correlation for M2 macrophages; whereas the infiltration of activated mast cells, resting CD4+ T cells, plasma cells, and activated B cells were significantly decreased (P < 0.05, Fig. 8A–C). The FCER1G+ cells and CD163+cells in ESCC were counted separately using immunohistochemistry, and Spearman correlation analysis revealed that there was a positive correlation between FCER1G and CD163 (r = 0.6011, P < 0.0001, Fig. 8D).
Fig. 8
Immune cell infiltration in ESCC. A Proportion of 22 immune cells in ESCC samples. B Correlation analysis of 22 immune cells in ESCC samples. C Correlation of FCER1G with M2 macrophages (based on TCGA). D Correlation of FCER1G with CD163 (based on immunohistochemistry)
3.6 Relationship between FCER1G, CD163 expression and clinicopathological parameters in ESCCBased on the median infiltrating density of FCER1G+ cells in ESCC tissues, the cases were divided into FCER1G high-density infiltration group and FCER1G low-density infiltration group. The results of the chi-square test showed that both the infiltration densities of FCER1G+ and CD163+ cells were significantly correlated with patients’ TNM stage and tumor differentiation. Additionally, the infiltration density of CD163+ cells was significantly associated with lymph node involvement (P < 0.05, Table 1).
Table 1 Relationship between FCER1G and CD163 expression and clinicopathological parameters in ESCC3.7 Relationship between the expression of FCER1G and CD163 and ESCC outcomeKaplan–Meier survival curves were drawn to evaluate the prognostic value of FCER1G and CD163 in ESCC. Tumors with high infiltration levels of FCER1G+ cells or CD163+ cells (P < 0.05, Fig. 9A, B) were associated with inferior OS. The density of FCER1G+ and CD163+ cells infiltration was used to classify ESCC patients into four groups: ①FCER1Glow CD163low; ②FCER1Glow CD163high; ③FCER1Ghigh CD163low; ④FCER1Ghigh CD163high. FCER1Glow CD163low group had the longest OS, whereas FCER1Ghigh CD163high group was linked to the shortest OS (P < 0.05, Fig. 9C).
Fig. 9
A Relationship between FCER1G expression and survival time in ESCC patients. B Relationship between CD163 expression and survival time in ESCC patients. C Survival curves of ESCC patients in different subgroups
Univariate and multivariate Cox regression analyses were performed to further determine whether FCER1G and CD163 were independent risk factors for evaluating OS in patients with ESCC. Either FCER1G+ or CD163+ cells high-density infiltration was associated with shorter OS in Univariate Cox regression analysis. Other histological findings, including differentiated degree and TNM stage were also correlated with OS. Following multivariable adjustment, FCER1G and TNM stage were identified as independent risk factors of OS (P < 0.05, Table 2).
Table 2 Univariate and multivariate Cox regression analyses of patient characteristics with OS3.8 FCER1G and CD163 co-expression in infiltrating cells and the correlation of the infiltration density with prognosisIn order to further investigate the association between FCERG1 expression and M2 macrophages, double immunofluorescence staining was performed on paraffin sections of 120 cancer tissues. The presence of green immunofluorescent material indicated the presence of CD163, red immunofluorescent material indicated the presence of FCER1G, and yellow or red-green fluorescence indicated the presence of both FCER1G and CD163 (Fig. 10). The result showed that most of FCER1G+ cells co-expressed CD163. The number of the double positive cells was counted using ImageJ image software and then divided into high- and low-density infiltration groups to analyze their relationship with survival. Kaplan–Meier survival analysis showed that the expected survival of ESCC patients in the high-density of FCER1G and CD163 co-expression group was significantly lower than that of the low-density of FCER1G and CD163 co-expression group (P < 0.05, Fig. 11).
Fig. 10
Co-expression of FCER1G and CD163 in ESCC tissue
Fig. 11
Association of co-expression of FCER1G and CD163 with survival time in ESCC patients
Comments (0)