
Remember me


This in vitro study was conducted with the case of a clinical patient exhibiting a single edentulous space at the left maxillary central incisor region (21, FDI dental numbering system) who was scheduled for implant placement. This study was approved by the Ethics Committee of Xi'an Jiaotong University Stomatology Hospital, Shaanxi, China (2024-XJKQIEC-QT-0002-001). Preoperative CBCT data were obtained via the following machine parameters: tube voltage, 100 kV; tube current and rotation period, 100 mAs; field of view, 16 cm × 10 cm; and slice width, 300 μm; KaVo Company, Germany). The optical impression was measured across the dental arch using TRIOS® 3 (3 Shape, Copenhagen, Denmark) without any powder. Prior to scanning, the scanner tip was calibrated and preheated as instructed by the manufacturer.
Surgical template designFor the digital planning of the implant position, the standard tessellation language (STL) file of the optical scan and digital imaging and communications in medicine (DICOM) data of CBCT were uploaded into a dedicated software program (Implant Studio; 3Shape). Both data files were digitally matched by using easily defined anatomic landmarks, primarily the natural teeth and attached gingiva. The 3D implant position was planned with an appropriate length and diameter (Fig. 3a, bone level tapered implant; 10 mm length, diameter: 4.1 mm; Institut Straumann AG). For the digital design, the surgical template was fixed on both sides to 4 adjacent teeth. Observation windows were set at the cusps of the right maxillary canine and the left maxillary first premolar (Fig. 3b).
Fig. 3
Design and modification of the template model in STL format. a Template design interface of the 3Shape implant studio software, in which the Straumann BLT (4.1 mm × 10 mm) implant was virtually inserted in region 21; b, c original and modified STL model files were displayed from three perspectives, in which 18 cylindrical landmarks and a round base were added
Addition of the measurement landmarks and baseThe STL format has become standard for data input of all types of rapid prototyping systems, but polygonal areas of the STL model with millions of triangles often require long processing times, and it is difficult for CMM to determine the nominal coordinates [20]. To facilitate measurement, we postprocessed the STL model by randomly creating 18 landmarks on both sides of the template surface (the dentition part of the template) via Creo Parametric 4.0 software (PTC; Needham, MA, USA). Each landmark was a cylinder with a diameter of 2 mm, and the upper plane was fully exposed. By analyzing 6 points on the upper edge of the cylinder with the CMM probe, the coordinates of the center point (as the test point) were determined, and CMM calibration was also performed simultaneously by calculating the actual diameter of the cylinder (1 μm tolerance was allowed, 1.999–2.001 mm). In addition, we randomly selected 4 test points at the surface of the sleeve without adding any landmarks because the topology of this area was flat and easy to fit into a plane. Thus, a total of 22 test points were set on each template. Moreover, a column with a circular base was also created on the STL model to stabilize the template on the platform when performing the measurements (Fig. 3c).
Manufacturing of surgical templatesThe postprocessed STL file was imported into four different 3D slicing software programs (1. Streamflow, HeyGears V2.4.25, Guangzhou, China; 2. Shapeware, RayShape, Suzhou, China; 3. Rayware, SprintRay, USA; 4. Polydevs, Uniontech, Shanghai, China) and nested on the build platform at 0°, followed by support structure addition (Fig. 4a). Then, the samples were sliced at a layer thickness of 50 μm (Fig. 4b). G-codes were generated and transmitted to their own digital light processing (DLP) printers (1. HeyGears, UltraCraft A3D, Guangzhou, China; 2. RayShape, Shape 1, Suzhou, China; 3. SprintRay, pro, USA; 4. HAN's LASER, RuiYi DLP1080EA, Shenzhen, China). Two types of medically certified denture resins (opaque and transparent) were used on the basis of the manufacturer’s safety data sheet (Opaque resin: HeyGears printer: Model HP UV 2.0, HeyGears, China; Transparent resins: 1. HeyGears printer: Surgical Guide UV, HeyGears, China; 2. RayShape printer: SG resin, RayShape, China; 3. SprintRay printer: Surgical Guide 3, SprintRay, USA; 4. Han laser printer: Leyi D031, Hangzhou Leyi New Material Technology Co., Ltd., China). Next, all the samples were ultrasonically twice cleaned in 99% isopropanol for 3 min and then postcured for 15 min in a light chamber with an ultraviolet light emitting diode that ranged from 360 to 440 nm and peaked at approximately 385 nm. Finally, the support structures were removed, and the fabricated templates were divided into five groups according to the applied slicing software and resin (opaque or transparent), named “Streamflow-O”, “Streamflow-T”, “Shapeware-T”, “Rayware-T” and “Polydevs-T” (N = 3, Fig. 4c). The above workflow is shown in Scheme 2.
Fig. 4
Preprocessing settings in the slicing software and all the fabricated templates. a The STL model was nested on the build platform at 0° followed by support structure addition in the slicing software; b the model was sliced at a layer thickness of 50 μm, and the interfaces of the different layers are shown; c the modified templates were successfully printed, including the landmarks and round base
Scheme 2
Manufacturing workflow of the template. The 3D printing digital process consists of slicing, printing, postprocessing and light polymerizing
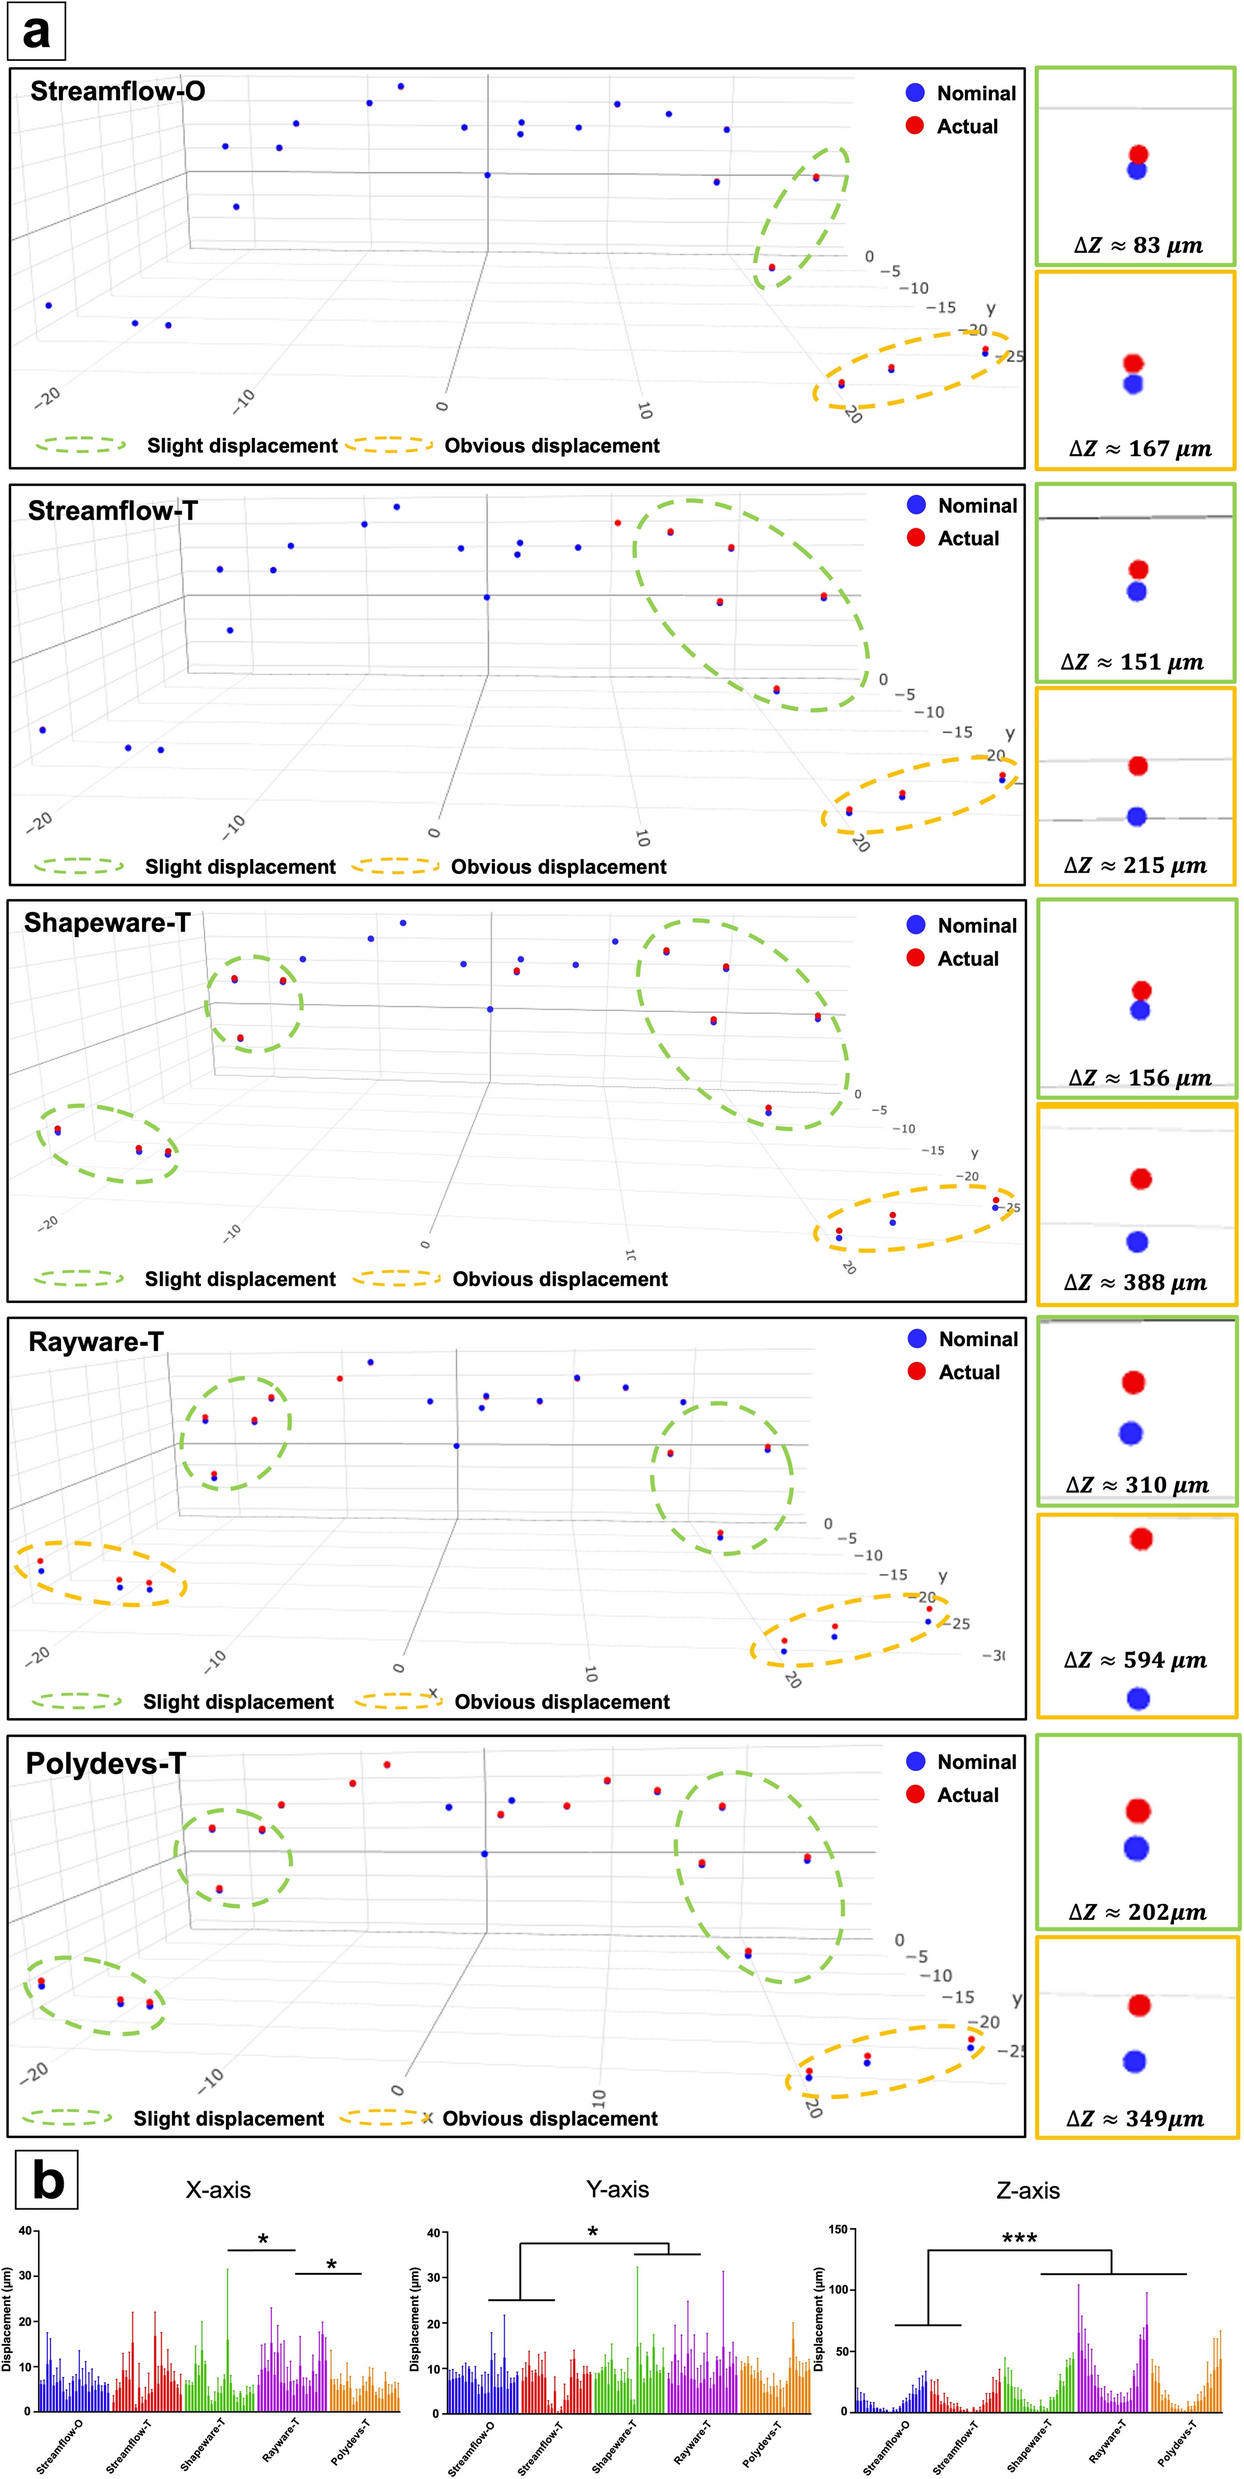
CMM measurementAll the samples were fixed on a CMM platform (O-INSPECT 543, Zeiss, Germany) by using epoxy resin (Zhejiang Zhongli Petrochemical Co., Ltd., China). Figure 5a), and the test process was performed as previously reported [21]. (1) Coordinate system establishment: the model was imported into the CMM software (Calypso 5.4.20, Zeiss, Germany), followed by selection of the origin point and establishment of the measurement coordinate system (point CS0 shown in Fig. 5b in red); (2) Determination of the test points: a total of 22 test points were set in software, including 18 cylindrical landmarks and 4 points on the implant sleeve (the yellow points in Fig. 5b); (3) Element construction: the software programs calculated the position and dimensional characteristics of elements on the basis of the test-point coordinates; (4) Data computation: the software program obtained each element’s geometric dimensions and positional tolerances and calculated the nominal coordinates of test points referring to the established coordinate system; (5) Computer numerical control (CNC) operation: after configuration of the CMM parameters, such as the safety planes, retraction distances, probe types, and operating speeds, the automatic CNC operation of the CMM for model measurement was initiated (an additional movie file shows this step in more detail, Additional file 1); (6) Results output: the software calculated the displacements between the nominal (designed template) and actual coordinates (printed template) of all test points on the x-, y-, and z-axes (Fig. 5c), and the Euclidean distance (dxyz) was regarded as the representation of global dimension accuracy:
Fig. 5
Measurement and output results of the CMM. a Each group consisted of three identical samples, which were fixed on the same test platform. The CMM probe measured the coordinates of 22 test points according to the preset program. b All 22 test points are highlighted in yellow and are composed of 18 cylindrical landmarks randomly distributed on both sides of the template and 4 points on the sleeve. The origin was set at the top corner of the base connector, and a rectangular coordinate system was established. c The CMM automatically calculated the actual and nominal coordinates and displacement values after the measurement was completed
$$\text=\sqrt_-_)}^_-_)}^+_-_)}^}$$
In this study, the above process was repeated three times for each sample, and three time points were set to observe the possible dynamic deformation of the surgical template immediately post-production and after 1 week and 2 weeks of storage (0 w, 1 w, and 2 w).
Statistical analysisAll the statistical analyses were performed in SPSS Statistics version 26.0 (SPSS, Chicago, IL, USA). The values are presented herein as the means ± standard deviations. One-way ANOVA was used for comparisons of the data among multiple groups, whereas the least significant difference (LSD) test was used for further comparisons between two groups. All tests for significance were two-sided, and p < 0.05 was considered statistically significant. All the bar charts were generated by GraphPad PRISM software version 9.0 (GraphPad Software, Inc., San Diego, US). All 3D coordinate diagrams consisting of the actual and nominal coordinates of all test points were created by Rstudio (RStudio, Boston, MA, USA).
Comments (0)