
Remember me


As the data used for the experiment were not derived from clinical cases, no ethical review was required for the model study.
Considering the lack of similar studies in the previously published literature to obtain mean values and standard deviations of implant placement accuracy under dynamic navigation for each type of implant, if α was set at 0.05, β was set at 80%, and effect size f was set at 0.4 with a 1:1:1:1 distribution ratio between four study groups, a sample size of 19 models per group was needed in a one-way ANOVA study. A one-way ANOVA study with a sample of 76 subjects divided among 4 groups achieves a power of 82% when assuming a non-central F test with a significance level of 0.05.
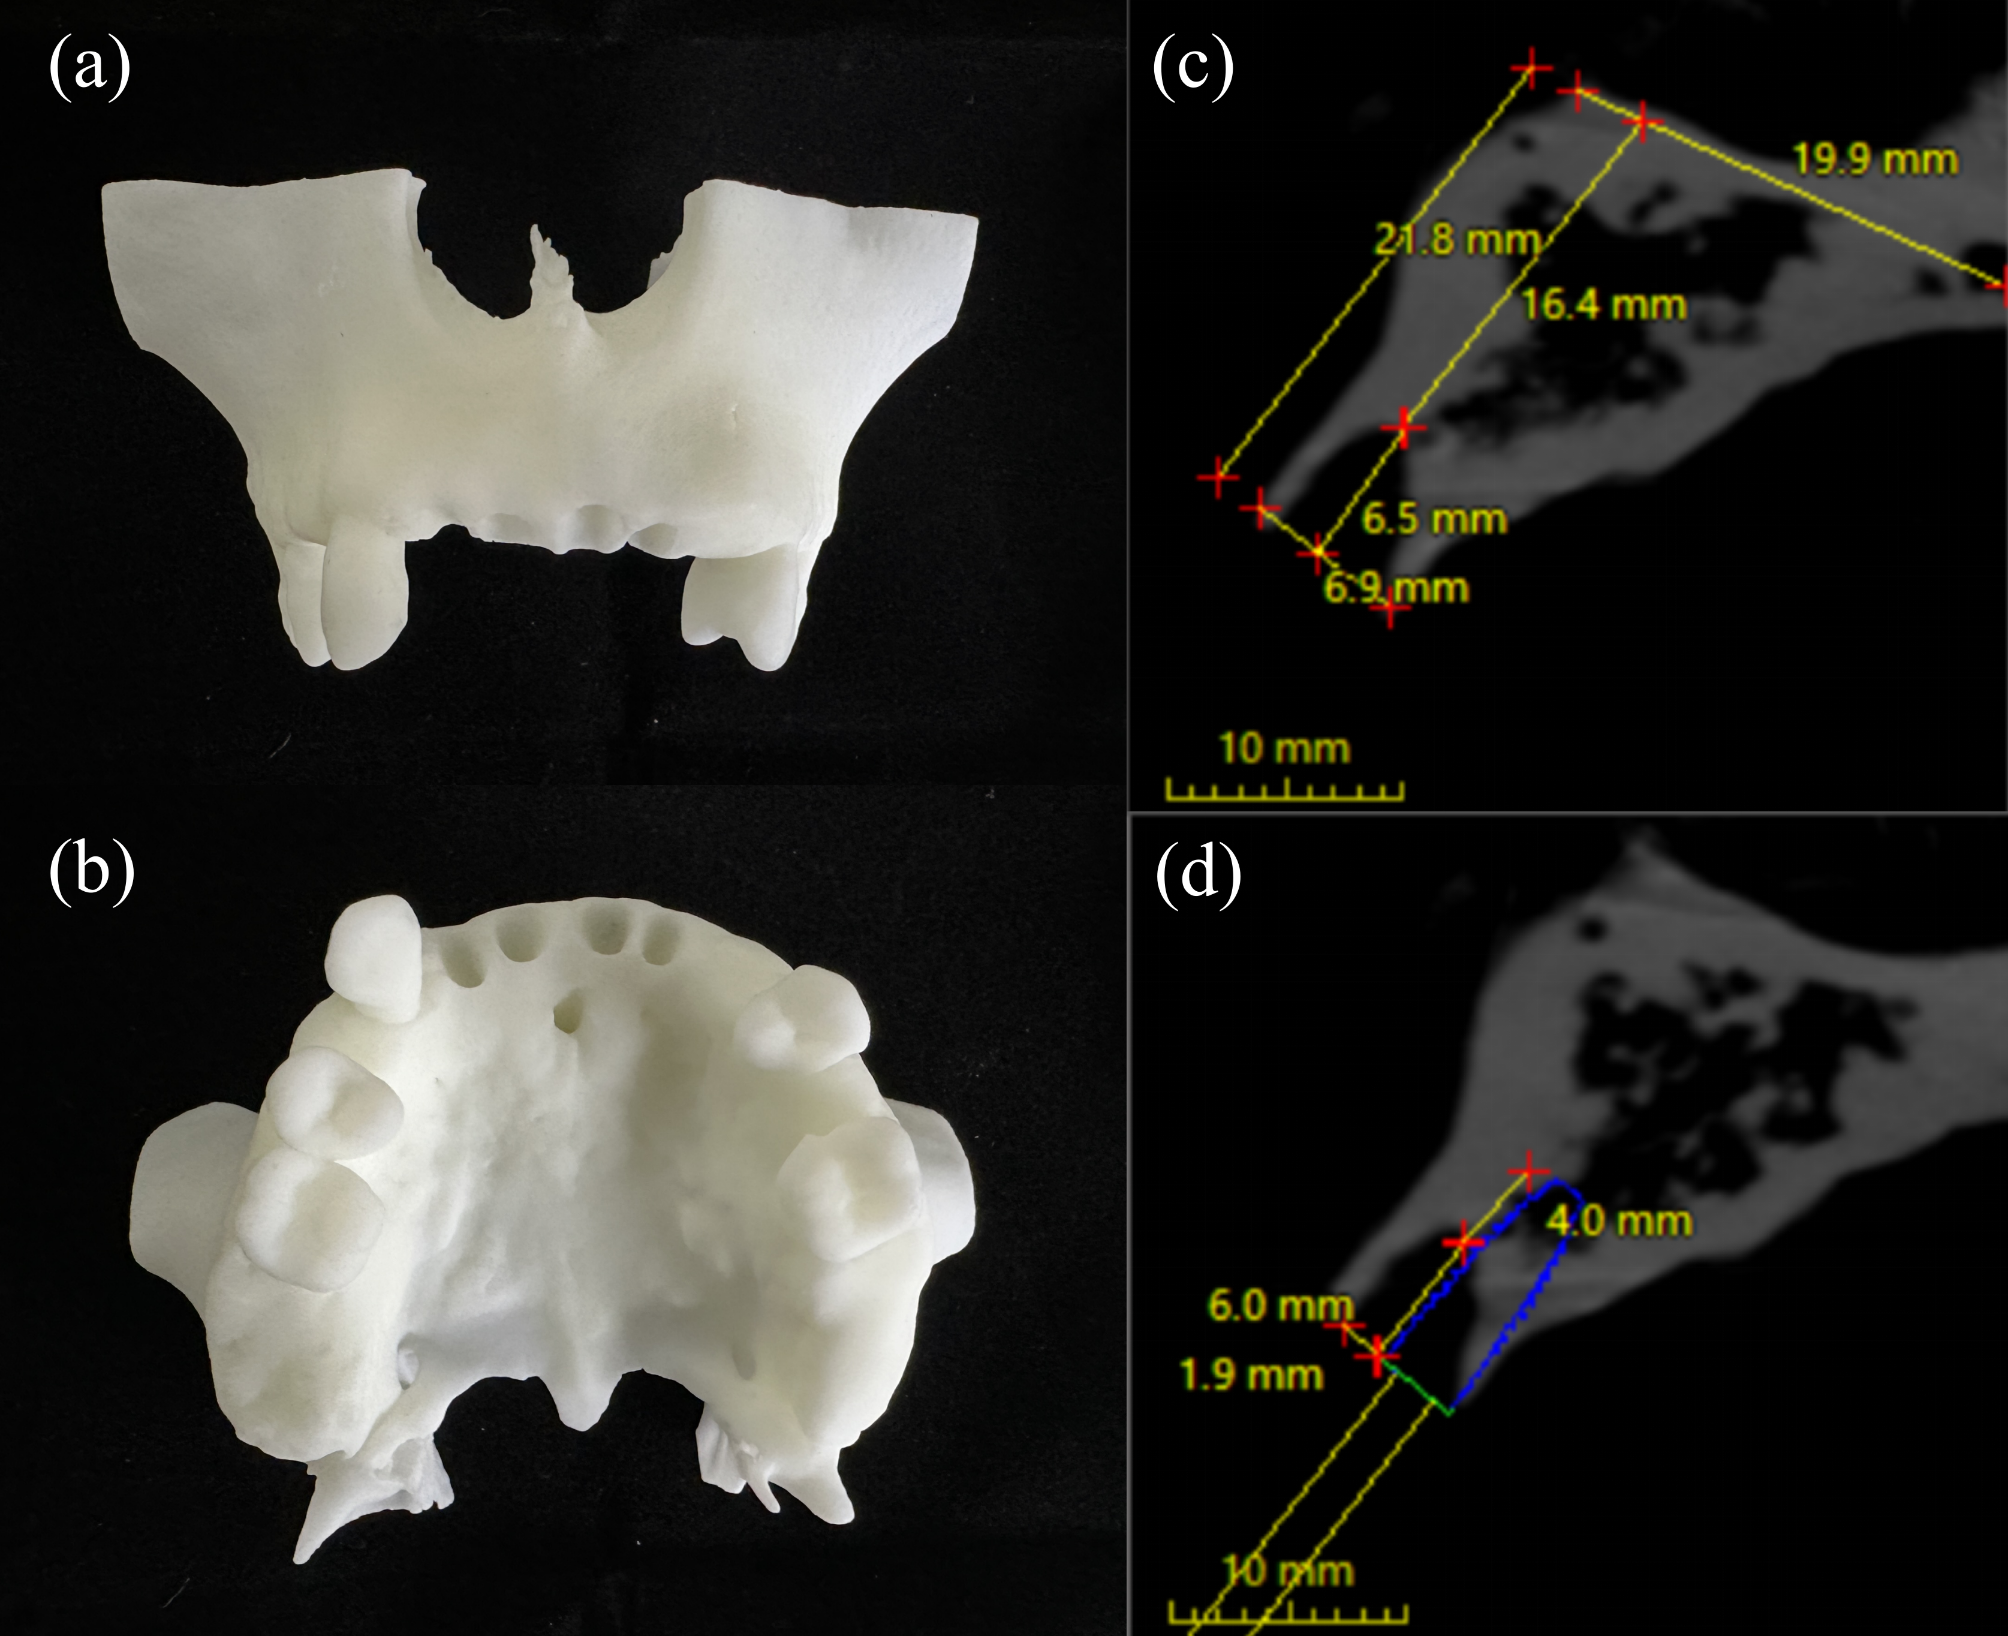
Preoperative planThe resin models were manufactured (WeNext Technology Co., Ltd, Shenzhen, China) according to the same STL file by the same stereolithography (SLA) 3D printer (UnionTech Co., Ltd, Shanghai, China). The maxillary central and lateral incisors were designated for IIP in this model (Fig. 1a and b). The remaining alveolar bone of the extraction socket and the planning of the implant were measured according to the measurements in a retrospective study [32]. The total height of the alveolar process was 21.8 mm, and the bone’s width at the alveolar apex level was 6.9 mm (Fig. 1c). According to Kan et al., [33] each maxillary anterior socket exhibited a sagittal position classified as Class I, which served as an indication for IIP. The total implant length was 10 mm. The implant anchored in the peri-apical bone was 4 mm, and the implant length protruding in the socket was 6 mm. The gap between the implant and the bone buccal plate was 2 mm (Fig. 1d).
Fig. 1
Model and digital plan (a) Occlusal view of the resin model; (b) Buccal view of the resin model; (c) Measurements of the extraction socket on sagittal plane of CBCT scans in the anterior maxilla; (d) Measurements of the planned implant relationship to the extraction socket on sagittal plane of CBCT scans in the anterior maxilla. CBCT, cone-beam computed tomography
Preoperative preparationThe model experiment was conducted by a surgeon (J.C.) experienced in dCAIS. Implant osteotomies and placement were guided by an active dynamic navigation system (Yizhimei, DCARER, Suzhou, China).
The Shore hardness of the R4600 photosensitive resin (WeNext Technology Co., Ltd, Shenzhen, China) utilized to print the models was 79, with a printing accuracy of 200 microns. The hardness of the material was utilized to simulate the dense cancellous bone of the maxilla. Nobel Replace CC (φ3.5 mm × 10 mm; Nobel Biocare, Gothenburg, Sweden), Cortex Dynamix (φ3.3 mm × 10 mm; Cortex Dental Implants Industries Ltd., Israel), BLT (φ3.3 mm × 10 mm; Straumann AG, Basel, Switzerland), BLX (φ3.5 mm × 10 mm; Straumann AG, Basel, Switzerland) were randomly assigned to four immediate sites in each model. According to the manufacturers, the Cortex Dynamix, BLT, and BLX designs, particularly their cutting elements and flutes, exhibit superior self-tapping characteristics, making them capable of achieving stable implant placement during IIP. However, those kinds of implants were designed with different thread features and cutting elements. Consequently, this study utilized Cortex Dynamix, BLT, and BLX implants designed for IIP, along with a group comprising implants without cutting elements and flutes (Nobel Replace CC) to explore the effect of implant designs on dCAIS guided IIP accuracy. Specific characteristics of the implants are illustrated in Fig. 2; Table 1. According to the thread design of the implants, they are named in the order of group NP-T (non-progressive and trapezoidal), P-T (progressive and trapezoidal), P-V (progressive and V-shaped), and P-S (progressive and spiral). A total of 19 models were utilized in this experiment. However, there is a minor deviation in the diameters of these implants above.
Fig. 2
Four implant system groups with different macrogeometry: non-progressive and trapezoidal (NP-T), progressive and trapezoidal (P-T), progressive and V-shaped (P-V), progressive and spiral (P-S)
Table 1 Characteristics of the implants with different macrogeometryImmediate implant placement surgeryA U-shaped registration device was fixed onto the residual teeth with silicone rubber materials (DMG Chemisch-Pharmazeutische, Hamburg, Germany) before preoperative cone-beam computed tomography (CBCT, Planmeca ProMax, Planmeca Oy, Helsinki, Finland). All the models underwent CBCT scanning with the same parameters: 96 kV; 8 mA; voxel size of 0.2 mm; and scanning time of 12 s.
The infrared dynamic navigation system comprises an infrared camera, a display, and a computer. Infrared cameras are equipped to detect light-emitting diodes and determine the instrument’s location and the surgical area (Fig. 3a). After fixating the model, preoperative CBCT scans were copied into software (coDiagnostiX, Dental Wings, Canada) for virtual planning of IIP. Then, the designed protocol was imported into the navigation. Based on the actual situation, the surgeon selected the appropriate handpiece and tracking plate in the dCAIS software. Subsequently, the surgeon attached short and long round burs to the handpiece separately. According to the interface instructions provided by dCAIS, the surgeon aligned the round bur with the groove located on the side of the tracking plate and rotated the handpiece, enabling dCAIS to recognize all three sides of the positioning device attached to it. The handpiece and tracking plate had to remain within the dCAIS camera’s field of view throughout the calibration procedure. Then, the tracking plate was fixed on the model with screws, connecting devices, and temporary crown materials (DMG Chemisch-Pharmazeutische, Hamburg, Germany). Afterwards, the handpiece with the short round bur (φ2.0 mm) was matched to the U-shaped tube for registration. Then, the drill was placed on the tooth cusps to check the tracking accuracy. After choosing the instrument in the software, osteotomy and implant placement were performed under navigation. The implantation site was first marked with a needle drill (φ1.6 mm). Then, a pilot drill (φ2.0 mm for NP-T and P-T/φ2.2 mm for P-V and P-S) was used to prepare the implant bed to the final preparation depth (Fig. 3b). The tapered drill widened the implant bed (φ2.8 mm for P-T, P-V, and P-S/φ3.5 mm for NP-T). In the P-V group, the coronal part of the implant bed had to be shaped with a profile drill (φ3.3 mm). At last, the implant was placed with the handpiece (Fig. 3c). The operator observed the position and direction of the tool on the screen in real-time and adjusted accordingly to perform the surgery more accurately.
Fig. 3
Experimental setting (a) Experimental environment; (b) Osteotomy; (c) Implant placement
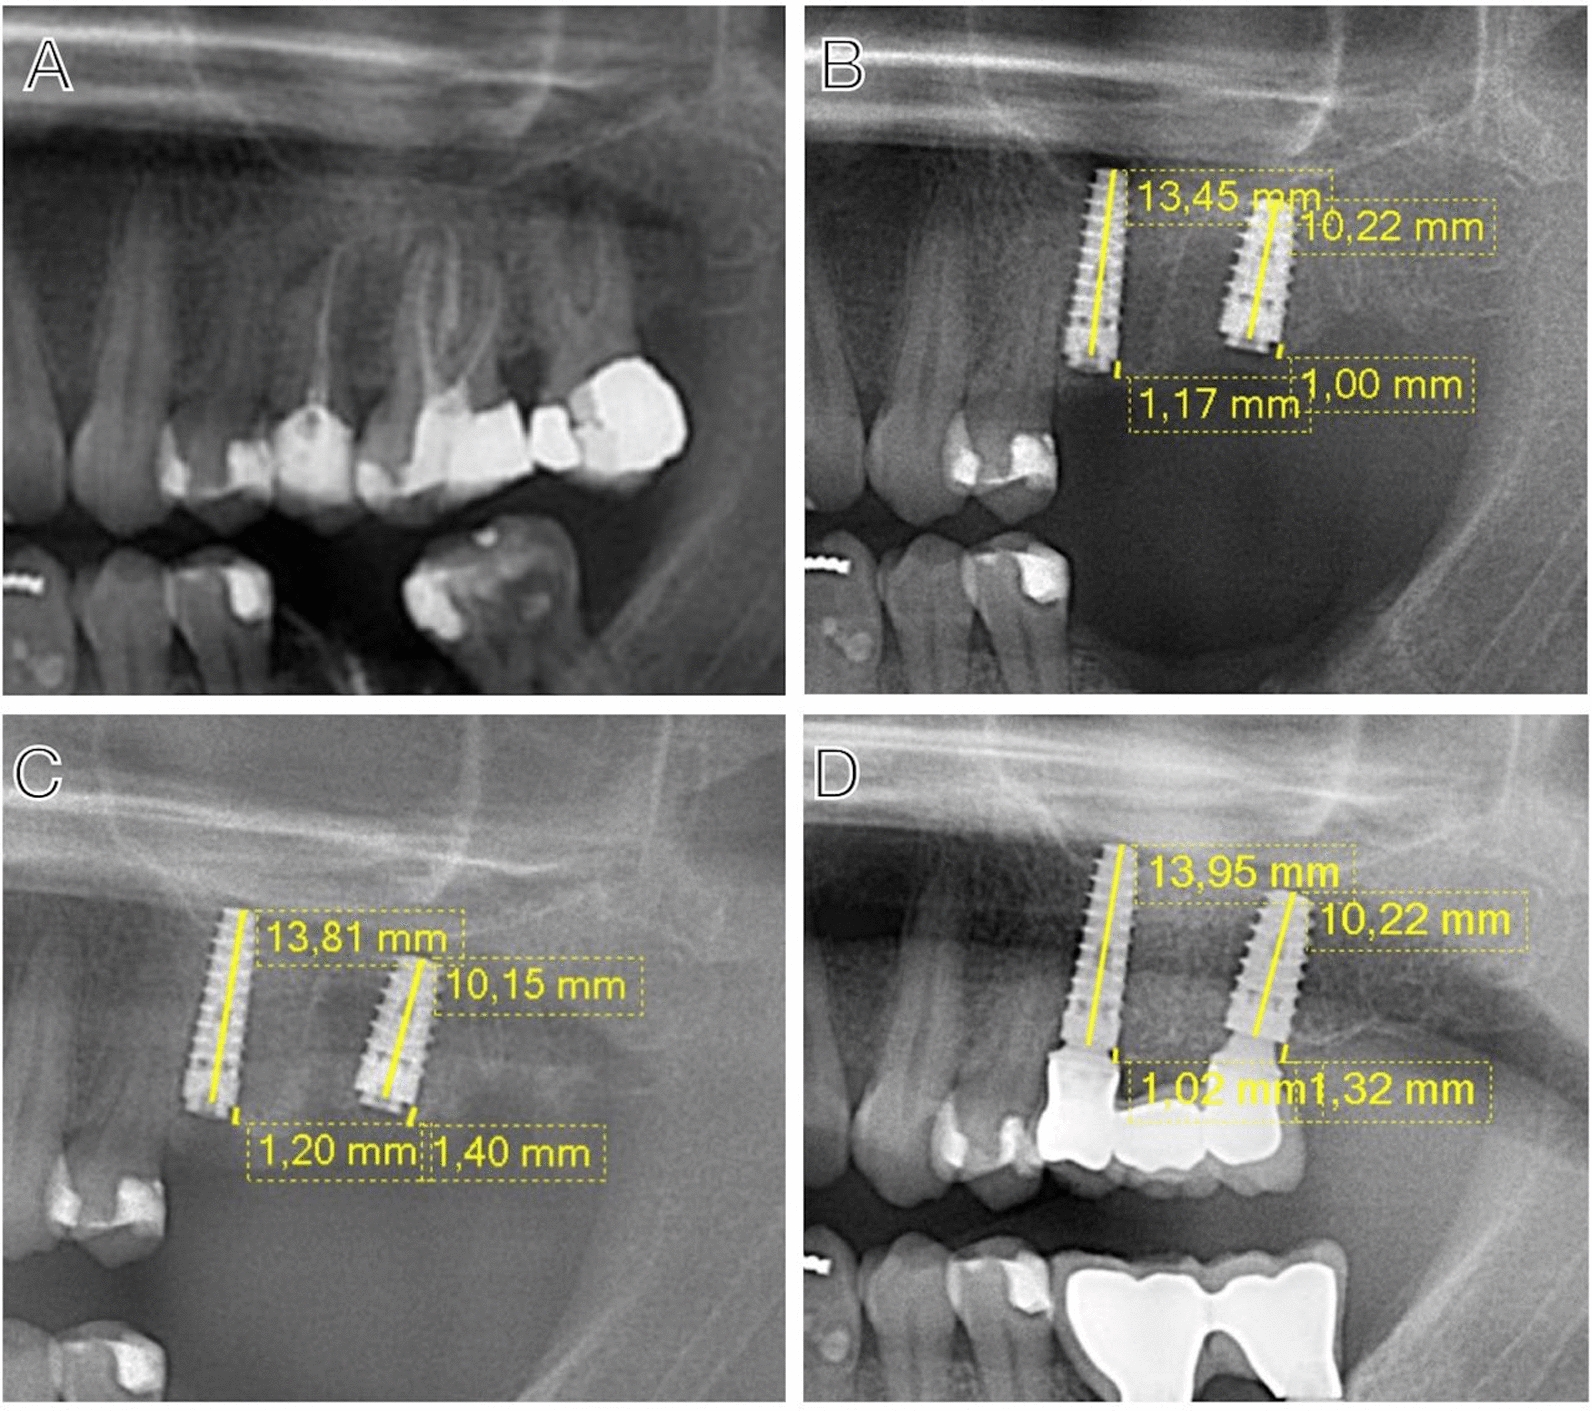
Assessment of the implant accuracyAfter the surgery, postoperative CBCT was taken with the same parameters as the preoperative ones. The postoperative images were imported into the accuracy measurement software (Yizhimei, DCARER, Suzhou, China) and were fused with virtual plans based on the selected reference points. To maximize alignment accuracy, five distinct points on the U-shaped registration device were chosen, as they are the most discernible in CBCT images. Furthermore, to maintain consistency across all models, the same five points were selected and aligned in the same sequence for each measurement. The alignment accuracy was controlled within 0.25 mm. After identification of the actual implants, the coronal, coronal mesiodistal, coronal buccolingual, coronal depth, apical, apical mesiodistal, apical buccolingual, apical depth, and angular deviations between the planned and the placed implants were calculated and reported (Fig. 4). The measurements were performed by one surgeon (X.Y.) who did not participate in the execution of the surgery. The measurements were repeated after a 2-week interval.
Fig. 4 Statistical analysis
Agreement between two repeated measurements was assessed by limits of agreement using statistical software (MedCalc Software Ltd, Ostend, Belgium). Descriptive and comparative statistical analyses were performed using a software package (SPSS, version 27.0; SPSS Inc., Chicago, IL). The mean value of two measurements was calculated as the final results. For descriptive statistical parameters of the data, the number of observations, mean, standard deviation (SD), median, minimum (Min), and maximum (Max) are presented. The normal distribution of data was evaluated using the Shapiro-Wilk test, and Levene’s test checked the equality of variance. One-way ANOVA was adopted when the normal distribution and variances were equal. The Kruskal-Wallis test was used when the distribution was not normal. Welch’s test was performed when the distribution was normal, but the variances were not equal. Post hoc comparisons were analyzed with the Bonferroni test to see if the variances were equal; otherwise, Tamhane’s test was performed. A significant difference was defined as p < 0.05. The boxplots were generated using Chiplot (http://www.chiplot.online/).
Comments (0)