
Remember me


All the 59 donors recruited were more than 60 years old, with a mean age of 72.15 years (SD: 12 years), of whom 39 were female (66%) and 20 were male (34%). Details of underlying diseases (64.4% of the patients) and symptoms of patients that had mild symptomatic SARS-CoV-2 infection (61%) are summarised in Table 1. Laboratory characteristics, such as the level of the leukocyte subsets, D-dimer and NT-proBNP, were also measured in most patients. Regarding influenza immunology status, 33 patients had received the influenza vaccine some months before the samples were collected, while 26 had not been vaccinated in the most recent vaccination campaign (2019–2020). Forty-nine patients were CMV-seropositive and 10 were CMV-seronegative (Table 1).
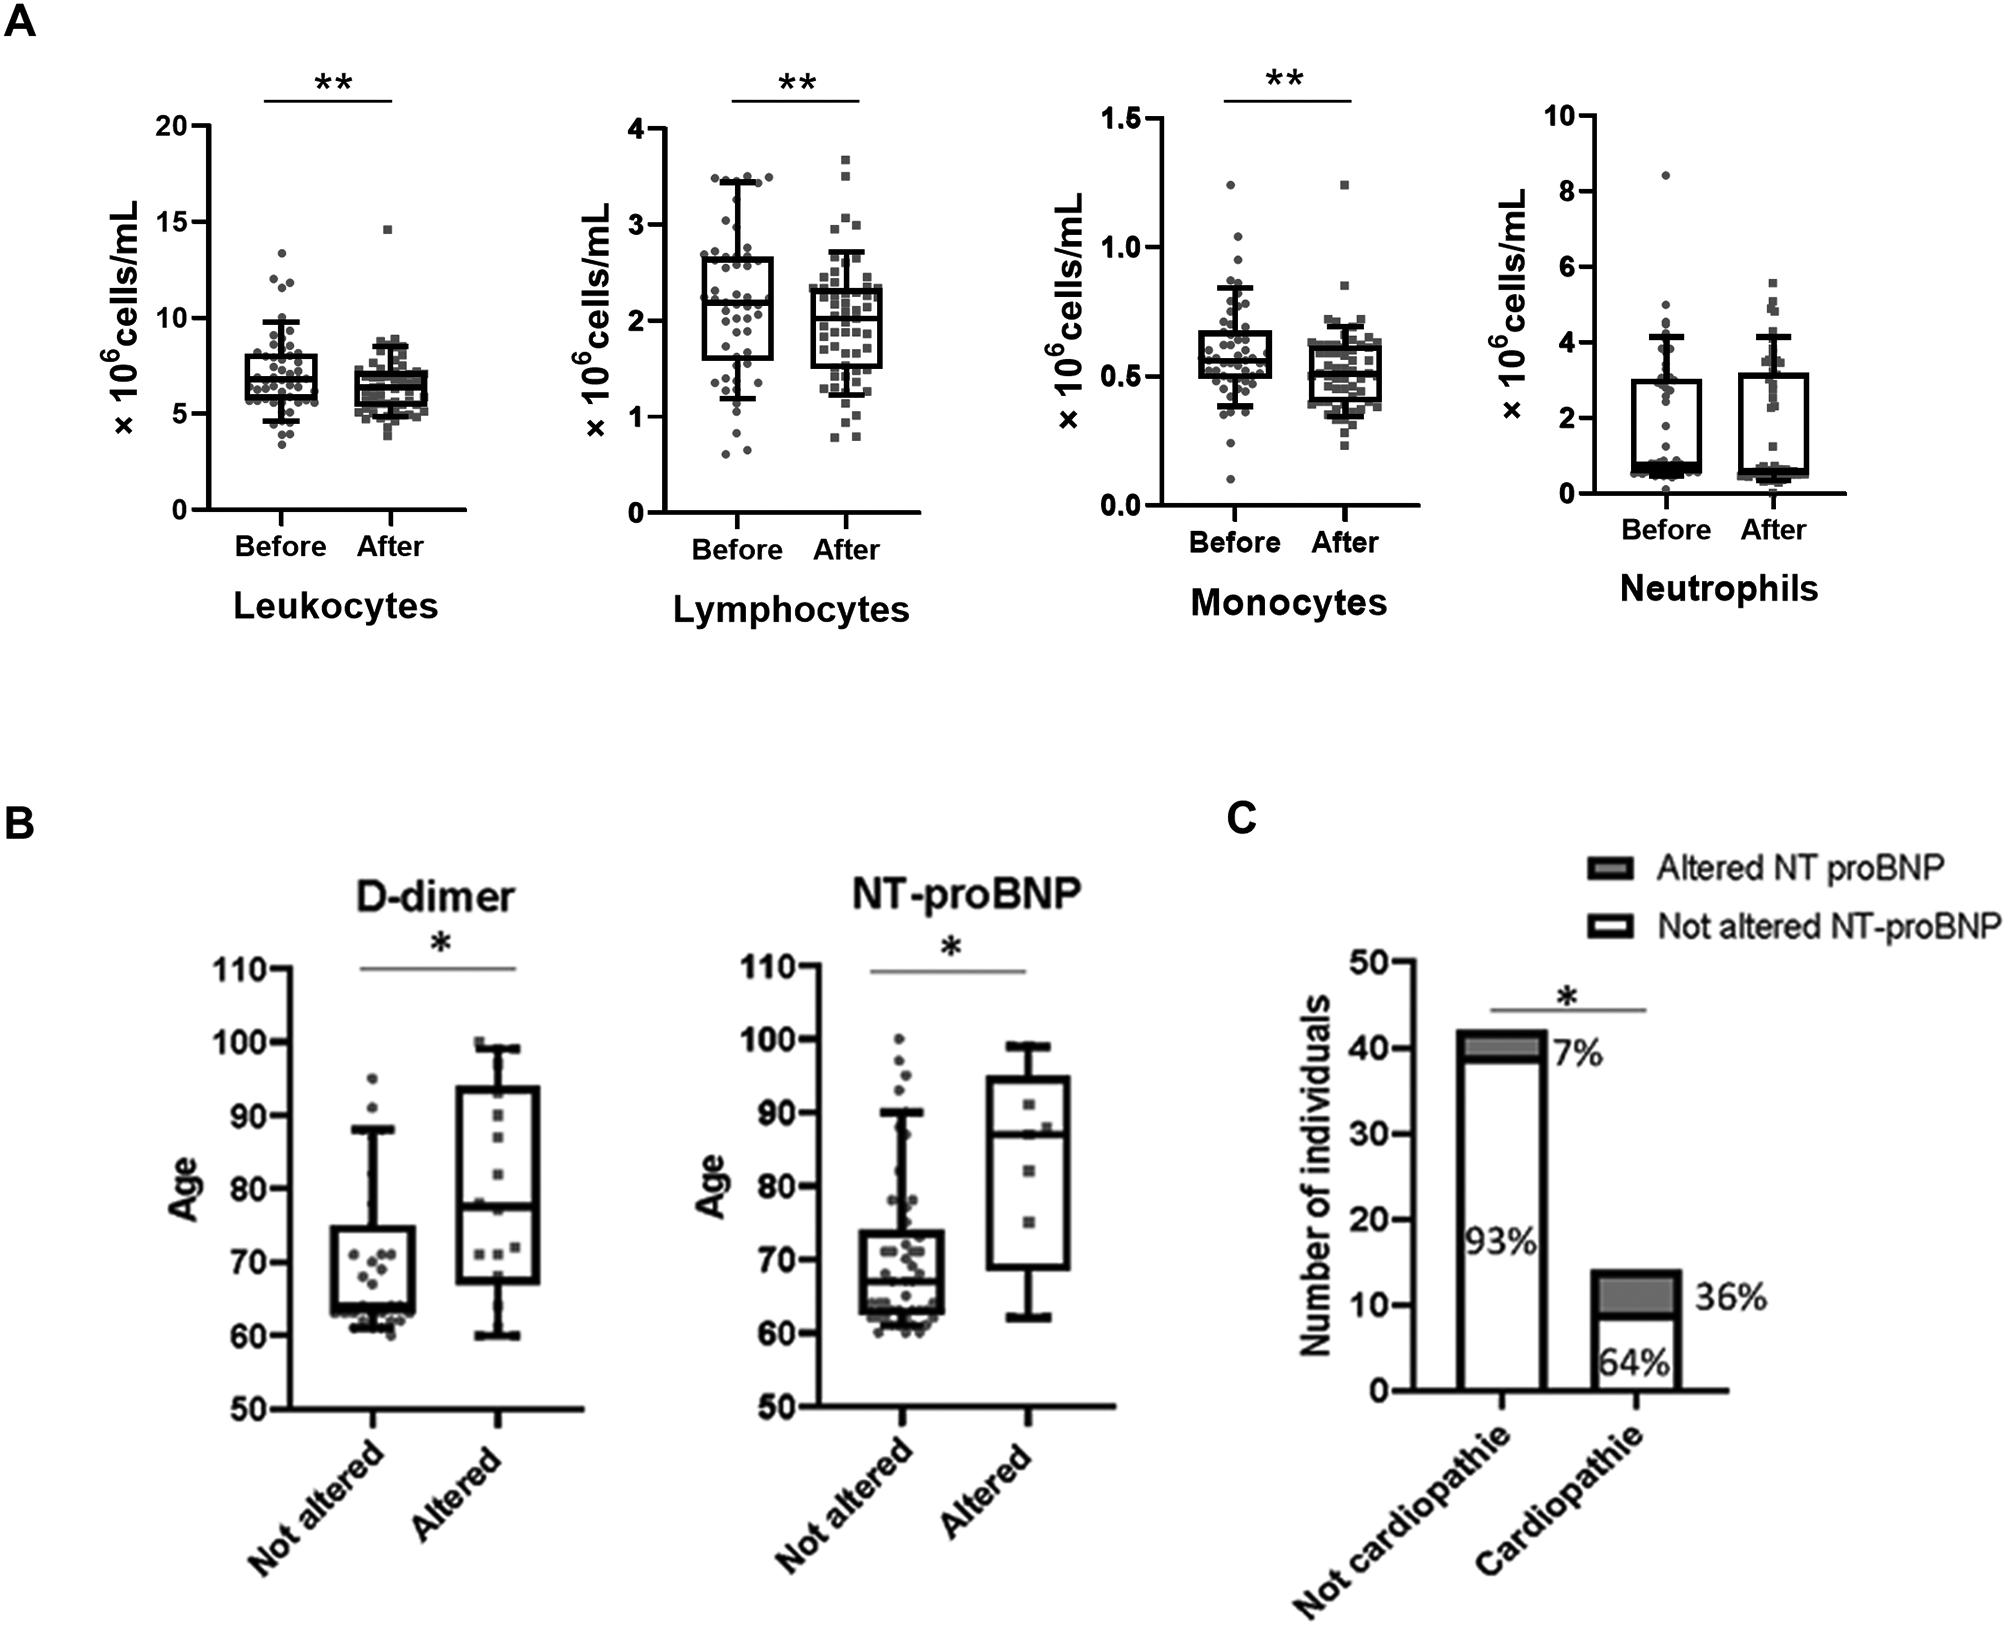
Table 1 Participant characteristicsHaemogram and biochemical characteristic recovery after SARS-CoV-2 infectionSince recruited patients had recently been infected with SARS-CoV-2, we wanted to determine whether some of the characteristics that are known to be altered during this infection had already returned to normal. As is well known, SARS-CoV-2 infection produces lymphopenia, as was seen in five of the patients for whom these data were available during the infection process (Supplementary Fig. 1). We wanted to establish whether patients showed normal levels of leukocytes when the study began. It was possible to obtain the basal haemogram information from 2 months to 4 years before the SARS-CoV-2 infection in 52 of the 59 patients. When the levels of the different leukocyte populations were compared before and after the infection, no statistically significant differences, or statistically significant but not biologically significant differences, were seen in the total leukocytes (Wilcoxon test, p < 0.01), lymphocytes (paired-samples t-test, p < 0.01), monocytes (Wilcoxon test, p < 0.01) or neutrophils (Wilcoxon test, p > 0.05) (Fig. 1A and Supplementary Fig. 2). The differences observed were not biologically significant since the total leukocytes, lymphocytes and monocytes are all within normal limits for the age range of the patients (4–10, 1–5 and 0.2-1 × 10⁶ cells/mL respectively) [22]. So, SARS-CoV-2 infection appeared not to affect leukocyte populations substantially once patients had completely recovered.
Fig. 1
Biochemical factors affected by SARS-CoV-2 infection. (A) Comparison between the level of total leukocytes (Wilcoxon test), lymphocytes (paired-samples t-test), monocytes (Wilcoxon test) and neutrophils (Wilcoxon test) populations before and after the SARS-CoV-2 infection. (B) Comparison of patients’ age between individuals with altered and unaltered D-dimer and NT-proBNP biochemical indicators (Student’s t-tests) (C) Representation of number of individuals without and with cardiopathie underlying disease (Pearson’s chi-squared test). It is indicated the percentage of individuals with altered NT-proBNP in each case. ** statistically significant differences (p < 0.01). * statistically significant differences (p < 0.05)
Fig. 2
Cellular and humoral responses detected. (A) Representation of the percentage of cases in which responses to the viruses (CMV among CMV-positive individuals in black, influenza in grey and SARS-CoV-2 in white) were not detected with each of the different measurements performed. (B) Schematic representation of the type of memory responses detected for the three viral infections (CMV, influenza and SARS-CoV-2). The percentage of patients in the different situations found for each virus is indicated (no detectable response in black, cellular response with no humoral response detected in dark grey, humoral response with no cellular response detected in light grey, and cellular and humoral responses detected in white). In the upper part is represented the percentage of patients that showed anti-S, anti-N or both humoral responses against SARS-CoV-2. In the bottom it is represented the percentage of patients that showed IFN-γ production, granzyme B production or both types of cellular responses against the three viruses. Vac: vaccinated_19/20. Unvac: unvaccinated_19/20
We now consider the biochemical characteristics that are known to be altered in SARS-CoV-2-infected patients and are considered indicators of a more severe COVID-19 disease. We measured D-dimer and NT-proBNP levels in serum samples of 49 and 58 of the 59 patients, respectively. Eighteen and nine individuals had an elevated level of D-dimer (> 500 ng/mL) and NT-proBNP (> 300 pg/mL), respectively, when the study began (Table 1). This finding was not associated with the patients’ gender or COVID-19 symptomatology. Elevated levels of both factors were more likely to occur in older patients, since individuals with altered characteristics were significantly older than those whose parameters were within the normal range (Student’s t test, p < 0.05, for both) (Fig. 1B). With respect to individuals’ existing underlying pathologies a higher prevalence of altered NT-proBNP was observed in patients who were suffering from an underlying cardiopathy (Pearson’s chi-squared test, p < 0.05) (Fig. 1C).
Cellular and humoral responses to the three virus modelsCellular and humoral memory responses to the three viral antigens were determined. Cellular responses were measured by IFN-γ ELISpot and granzyme B ELISpot. Humoral responses were measured as the level of specific antibodies against the different viruses in sera. It was not possible to obtain all results for all patients, especially in the case of granzyme B ELISpot since not enough cells could be isolated from some patients. Complete results of the three measurements were achieved in 74.6% of patients for CMV, 84.7% for influenza and 83% for SARS-CoV-2 of the 59 patients enrolled in the study.
No responses were obtained for some measurements, especially cellular memory measured by granzyme B ELIspot (Fig. 2A). No cellular or humoral response was detected in 17% of CMV (corresponding to seronegative CMV patients) and 3% of SARS-CoV-2 cases. However, most patients showed both cellular (with at least one of the two measurements obtained) and humoral responses to CMV, influenza and SARS-CoV-2 viruses (83%, 83% and 85%, respectively) (Fig. 2B).
Isolated cellular responses with no accompanying humoral response were seen for influenza in 17% of the patients (Fig. 2B). Conversely, an isolated humoral response with no detectable cellular response was observed for SARS-CoV-2 in 12% of the patients. Of these, 14% showed anti-N antibodies, and the remaining 86% had both anti-N and anti-S antibodies. Likewise, 96% of the patients with humoral and cellular responses had both anti-N and anti-S antibodies, while the other 4% had isolated anti-N (2%) or anti-S (2%) antibodies (Fig. 2B).
In all cases, positive cellular responses were detected mainly with IFN-γ-ELISpot measurement or both IFN-γ and granzyme B ELISpot. Just in the case of cellular responses to SARS-CoV-2, 5% of the patients showed granzyme B-ELISpot-positive results with negative IFN-γ-ELISpot. (Fig. 2B).
Anti-CMV responses83% of the patients were CMV-seropositive. Distributions of the different response measurements against CMV are represented in Fig. 3A. As mentioned above, humoral and cellular responses to CMV matched perfectly, whereby all seronegative patients were also negative for cellular responses, while the seropositive group of patients showed cellular responses. There was a positive correlation in the seropositive CMV patients between the two cellular responses measured as IFN-γ and granzyme B-producer-specific T lymphocytes (Spearman test; r = 0.6, p < 0.01). However, no significant correlation was observed between the anti-CMV cellular and humoral responses (Supplementary Fig. 3A).
Fig. 3
Characterisation of anti-CMV, anti-influenza and anti SARS-CoV-2 memory responses (A) Anti-CMV cellular (left and middle graphs) and humoral (right graph) responses among the CMV-seropositive patients. (B) Comparison of anti-influenza cellular (left and middle graphs) and humoral (right graph) responses between vaccinated and unvaccinated patients from the most recent vaccination campaign (2019–2020) (Mann–Whitney test). (C) Anti-SARS-CoV-2 cellular (left and middle graphs) and humoral (right graph) responses. * statistically significant differences (p < 0.05) Mann-Whitney U test. ** statistically significant differences (p < 0.01) Mann-Whitney U test
Anti-influenza responsesThe influenza-vaccinated status of all patients was known: 55.9% of them had been vaccinated in the most recent vaccination campaign. Nevertheless, it can be assumed that all the patients, vaccinated and unvaccinated, had been exposed to this seasonal virus during their lives. In fact, the cellular memory response to influenza (IFN-γ and/or granzyme B-producing T lymphocytes) was detected in all the patients. Regarding the humoral response, 94% of vaccinated and 69% of unvaccinated patients had antibodies against influenza at a level above our detection threshold. The great majority (80%) of the 17% patients who showed cellular responses without antibodies to the influenza vaccine were unvaccinated in the last vaccination campaign (2019–2020) (Fig. 2B). As expected, the group of individuals vaccinated in the last vaccination campaign had a significantly higher specific cellular memory response (Mann–Whitney test, p < 0.05 for IFN-γ and p < 0.01 for granzyme B producer T lymphocytes per 106 T lymphocytes) and anti-influenza antibody titre (Mann–Whitney test, p < 0.01) compared with the unvaccinated group (Fig. 3B).
The two different measurements of cellular response (IFN-γ and granzyme B production) and the values for IFN-γ-producer T lymphocytes and humoral response against influenza virus were both positively correlated (Spearman test; r = 0.6, p < 0.01 and r = 0.3, p < 0.05, respectively) (Supplementary Fig. 3B).
Anti-SARS-CoV-2 responsesAll the patients had been infected with SARS-CoV-2 for the first time and an adequate response to the virus was expected as they were asymptomatic or suffered only very mild symptoms. As described above, cellular or humoral responses to SARS-CoV-2 virus were observed in 97% of the cases (85% showed both types of response, while 12% presented only a humoral response). No response was detected in two patients studied by any of the methods used (Fig. 2B). Distributions of the different response measurements against SARS-CoV-2 are represented in Fig. 3C. As described above, some biochemical characteristics related to the severity of the SARS-CoV-2 infection, D-dimer and NT-proBNP levels were measured. No significant differences were found in the responses to SARS-CoV-2 between patients with and without altered parameters (Supplementary Fig. 4).
Positive correlations were noted between cellular responses, measured as specific IFN-γ-producer T lymphocytes, and humoral responses to SARS-CoV-2. The correlation was higher for anti-N antibodies (Spearman test, r = 0.5, p < 0.01) than for anti-S antibodies (Spearman test; r = 0.3, p < 0.05). As expected, the two humoral response measurements were significantly positively correlated (Spearman test, r = 0.5, p < 0.01). However, no significant correlation was observed between the two cellular response measurements (Supplementary Fig. 3C).
Relation between viral antigen model responsesComparing the cellular responses to the three viruses showed that the specific anti-CMV cellular response was stronger, in the CMV-seropositive group of patients, than the cellular response to the influenza virus, and both were stronger than the response to SARS-CoV-2, particularly when the cellular response was measured with IFN-γ ELISpot, since the differences between all three viral antigens’ responses were statistically significant (repeated measures ANOVA followed by Bonferroni adjustment, p < 0.01). When measured by granzyme B ELISpot, there were significant differences between CMV and SARS-CoV-2 (repeated measures ANOVA followed by Bonferroni adjustment, p < 0.05) and between influenza and SARS-CoV-2 (repeated measures ANOVA followed by Bonferroni adjustment, p < 0.01) but not between CMV and influenza in either of the unvaccinated_19/20 and vaccinated_19/20 patient groups (Fig. 4). Humoral responses could not be compared because they were measured in different ways.
Fig. 4
Comparison of cellular responses generated against the three viruses. (A) Influenza unvaccinated patients. (B) Influenza vaccinated patients. Statistical tests used: repeated measures ANOVA followed by post-hoc Bonferroni. * statistically significant differences (p < 0.05). ** statistically significant differences (p < 0.01)
We found a significant positive correlation between cellular responses to influenza and SARS-CoV-2 for IFN-γ-producer T lymphocytes (Spearman test; r = 0.4, p < 0.01) and granzyme B-producer T lymphocytes (Spearman test; r = 0.4, p < 0.05) although these were not apparent at the humoral level (Fig. 5A). On the other hand, there were no significant correlations of any of the measurements of the responses between CMV and SARS-CoV-2 or between CMV and influenza. However, comparing influenza and SARS-CoV-2 specific responses in CMV-seropositive and CMV-seronegative patients showed them to be consistently lower in CMV-seropositive than in CMV- seronegative patients, in both cases (Fig. 5B and C). This comparison was not significant probably because there were too few CMV-seronegative individuals in the sample for a difference of that magnitude to be significant.
Fig. 5
Relation between viral antigen model responses. (A) The relationship between anti-influenza and anti-SARS-CoV-2 cellular (left and middle) and humoral responses (right). Spearman correlation coefficients and p-values are shown. n.s. = no significant. (B) Anti-influenza specific responses comparison between seropositive and seronegative CMV patients (Mann–Whitney test). (C) Anti-SARS-CoV-2 specific responses comparison between seropositive and seronegative CMV patients (Mann–Whitney test)
Characterisation of the responses to the three antigen models in relation to the T lymphocyte phenotypeImmunosenescence may be related to the intensity of responses to the different virus infections. The immunophenotype of T lymphocytes by their degree of maturation (naïve/memory) and functional differentiation of CD4+ T lymphocytes (Th1/Th2/Th17) and their correlations with the viral responses were analysed.
CMVAgreeing with what is already well known and established, differences in the distribution of the T lymphocyte subpopulations were observed between CMV-seropositive and CMV-seronegative individuals (Supplementary Fig. 5A). CMV-seronegative patients had a significantly lower proportion of CD4+EM3 than did CMV-seropositive individuals (median: 0.03% vs. 6.8%; Mann–Whitney test, p < 0.01). However, the median proportions of CD4+CM and CD8+N were significantly higher in CMV-seronegative than in CMV-seropositive patients (30.4% vs. 22.6%; Mann–Whitney test, p < 0.05, and 16.2% vs. 7.1%; Mann–Whitney test, p < 0.01, respectively) (Supplementary Fig. 5A). With respect to the distribution of the functional subpopulations of CD4+ memory T lymphocytes, there was a significantly lower mean percentage of Th1 in CMV-seronegative than in CMV-seropositive patients (29.2% vs. 39.2%; Student’s t test, p < 0.01) (Supplementary Fig. 5B).
Considering the CMV-seropositive group of patients, the cellular response (IFN-γ and/or granzyme B-producing T lymphocytes) was negatively correlated with CD4+N, CD4+EM1 and CD8+N while there was a significant positive correlation with CD4+EM4. Regarding the humoral responses to CMV, there were negative correlations with CD4+CM, CD4+EM1, CD8+N, CD8+CM and CD8+EM1. However, a significant positive correlation was seen with the CD4+EM4, CD4+EM3, CD4+EMRA, CD8+EM3 and CD8+EMRA subsets (Fig. 6A). In the case of the functional differentiation of memory CD4+ T lymphocytes, the humoral response to CMV was positively correlated with Th1 type and negatively correlated with Th2 and Th17 (Fig. 6B).
Fig. 6
Heat maps showing the correlations between the viral responses and the different T lymphocytes subpopulations distribution. Vertical columns represent the different types of cellular or humoral responses (labelled at the bottom). Horizontally are represented T lymphocyte subpopulations (labeled on the left); for each subpopulation the upper line is expressed as a percentage while the bottom line is expressed as absolute values in cells/µL. The correlation scale (Spearman correlation coefficients) is represented in a greyscale from darker (negative correlation) to lighter (positive correlation). An asterisk indicates a statistically significant correlation (Spearman correlation, p < 0.05) while two asterisks indicate a highly statistically significant correlation (Spearman correlation, p < 0.01). (A) Correlations of responses with the different T lymphocyte subpopulations according to their differentiation stage (naïve-memory). The subpopulations indicated on the left on a light background correspond to the least differentiated subpopulations while on a dark background to the most differentiated for both CD4+ and CD8+ T lymphocytes. Percentages are referred to the total CD4+ or CD8+ T lymphocytes but in the case of subtypes of EM they are referred to CD4+EM or CD8+EM. (B) Correlations of responses with the different functional differentiation subpopulations of memory CD4+ T lymphocytes. Percentages are referred to the memory CD4+ T lymphocytes
InfluenzaIt is expected that recently vaccinated patients are a more homogeneous group with respect to the immune responses generated against influenza seasonal pathogen. In patients vaccinated in the last vaccination campaign (2019–2020), the cellular memory responses to the influenza virus (IFN-γ and/or granzyme B-producing T lymphocytes) were negatively correlated with CD4+EM3, CD8+EM3 and CD8+EMRA cells, and positively correlated with CD4+EM4 and CD4+EM1 cells. No significant correlations were noted between the level of antibodies and the distribution of any of the subpopulations (Fig. 6A). Regarding the functional differentiation of memory CD4+ T lymphocytes, the cellular response measured as IFN-γ-producer-specific T lymphocytes was negatively correlated with the Th2 subpopulation but positively correlated with the Th1.17 subpopulation (Fig. 6B).
SARS-CoV-2T lymphocyte cellular responses to SARS-CoV-2 (IFN-γ and/or granzyme B-producing T lymphocytes) were correlated negatively with CD4+EM4 and positively with CD4+EMRA. Regarding CD8+ T lymphocyte responses, there was a negative correlation between cellular responses and the CD8+EM3 and CD8+EMRA subsets. Analysis of the humoral responses revealed that the level of anti-S antibodies was negatively correlated with the CD4+N, CD4+CM, CD4+EM1 and CD8+N subsets, whereas anti-N antibodies were not significantly correlated with the distribution of any of the subpopulations (Fig. 6A). In terms of the functional differentiation of memory CD4+ T lymphocytes, the humoral response, measured as anti-S antibodies, was negatively correlated with the Th2 and Th17 subpopulations. The negative correlation with Th17 lymphocytes was also seen at the cellular level (Fig. 6B).
Comments (0)