
Remember me

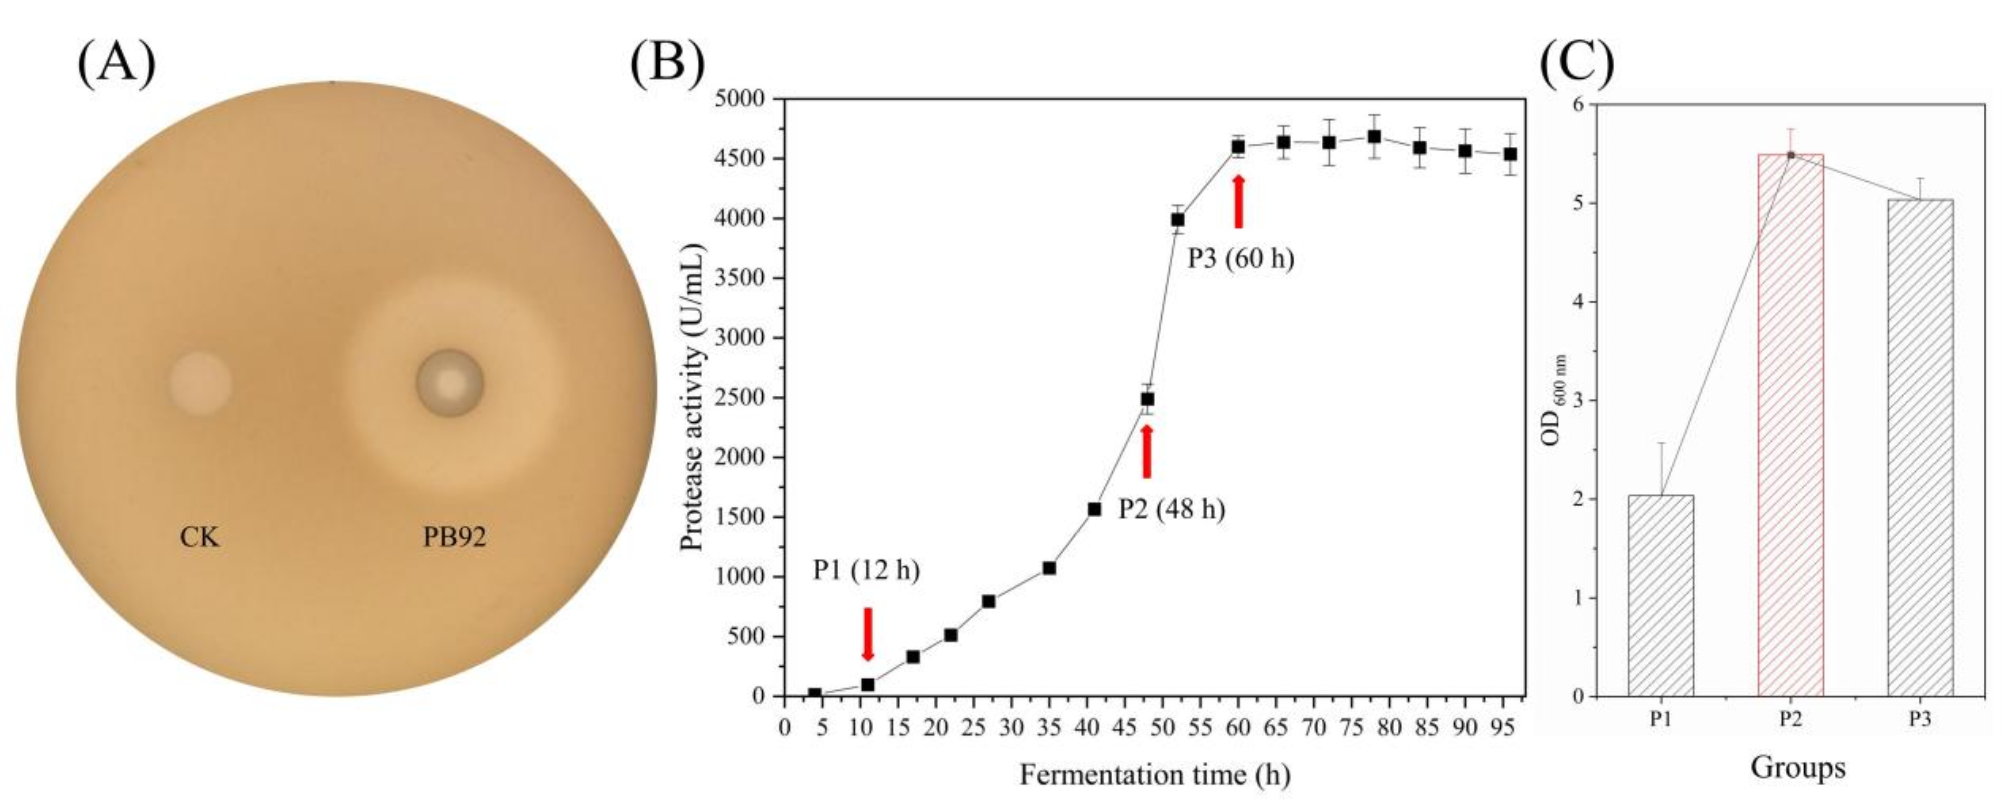
A foreign expression plasmid of the target gene PB92 was constructed after verifying the accuracy of the sequence for the recombinant plasmid pBE-09-PB92 (promoter pShuttle-09 and the SP BslB), which was expressed in B. subtilis WB600. The transformed B. subtilis WB600 appeared as a clear transparent proteolytic circle after overnight incubation on a plate containing 1.0% skim milk powder (Fig. 1A). The results showed that the protease PB92 could achieve efficient expression in B. subtilis. To determine the time point of sampling, we further investigated the relationship between the extracellular enzyme activity and fermentation time of the protease PB92. By detecting the extracellular activity of the protease PB92 at 16 fermentation time points (0–96 h), the results revealed that the extracellular protease activity of the protease PB92 rapidly increased from 10 h to 60 h of fermentation, and after 66 h, the extracellular protease activity plateaued, with the highest extracellular enzyme activity reaching 4687.93 ± 191.03 U/mL in B. subtilis (Fig. 1B). The extracellular protease activity of the 3 groups of sequenced samples was 130.63 ± 4.26 U/mL, 2363.20 ± 137.32 U/mL, and 4528.53 ± 121.09 U/mL. Compared with that of the P1 group, the extracellular protease activity of the P2 group increased by 18.09-fold. Compared with that of the other groups, the P3 group reached the highest activity point and increased by 34.67-fold compared with that of the P1 group, and the P3 group increased by 1.91-fold compared with the P2 group (Fig. 1B). The growth trend of the strains showed that the P2 group was the highest, and the OD 600 nm of the P3 strain decreased (Fig. 1C).
Fig. 1
Preparation of sequenced samples. (A) Transparent zone formed by the protease PB92. CK and PB92 represent B. subtilis WB600 strains containing empty vectors and PB92 target genes, respectively. (B) Fermentation results of the protease PB92 recombinant strain. To determine protease activity, culture samples were collected at 16 time points from 4 to -96 h. (C) Strain growth data of the sequence sample. Three parallel samples were obtained at 12 h (P1), 48 h (P2), and 60 h (P3) of fermentation
Sequencing data analysis of RNA-sequencing and Ribo-sequencingAfter RNA sequencing, filtering and alignment, 3982, 3988, and 3996 genes were detected in the P1, P2, and P3 groups, respectively, accounting for more than 93.98% of the total number of reference genome genes (Table S2). Correlation coefficient analysis was performed to assess sample reproducibility between groups. The results revealed that each set of samples has a high correlation coefficient (R ≥ 0.91) (Fig. 2A), there were no abnormal samples. Cluster analysis between the samples also revealed that each group of samples was clustered individually into the same branch (Figure S1). These results show that the samples within each group exhibit good reproducibility. The differentially expressed genes between the three groups were statistically analysed, with fold change ≥ 2 and FDR < 0.05 as the screening thresholds. The results revealed that the genes that differed between the three comparison groups were all arranged in a volcanic arrangement (Fig. S2). The comparison groups P1 vs. P2, P1 vs. P3, and P2 vs. P3 revealed 605 (403 upregulated, 202 downregulated), 1089 (697 upregulated, 392 downregulated), and 367 (228 upregulated, 139 downregulated) significantly different genes, respectively. P1 vs. P3 was also the group comparison with the greatest difference among the three comparison groups (Fig. 2B).
Fig. 2
RNA-sequencing and Ribo-sequencing data analysis (n = 3 in each group). (A) Pearson correlation between two samples of RNA-sequencing data; (B) histogram of differentially expressed genes with fold changes ≥ 2 and FDR < 0.05 between two comparison groups; (C) Pearson correlation between two samples of Ribo-sequencing data; (D) volcano map of Ribo-sequencing data; (E) histogram of differentially expressed genes with fold changes ≥ 2 and FDR < 0.05 between two comparison groups. Abbreviations: P1 = 12 h; P2 = 48 h; P3 = 60 h; “r” stands for samples for Ribo-sequencing
After Ribo-sequencing and filtering, the alignment rate with the reference genome reached 86.0%. A total of 4226 and 4200 genes were detected in rP1 and rP3, respectively, covering more than 99.00% of the genes and exhibiting higher sequencing quality than RNA sequencing (Table S3). The results of the Pearson correlation coefficient analysis revealed that the correlation between three replicates in the two groups of samples was extremely high, and the value reached more than 0.87 (Fig. 2C). The differentially expressed genes in the rP1 vs. rP3 groups showed a volcanic distribution (Fig. 2D). A total of 1272 differentially expressed genes (fold change ≥ 2, FDR < 0.05) were found, of which 701 were upregulated and 571 were downregulated (Fig. 2E). This result suggests that there are more differentially expressed genes at the level of translation.
Analysis of the associations of differentially expressed genes at the transcription and translation levelsTo further explore the changes in gene expression at both the transcription and translation levels in B. subtilis, we compared the relative expression of 4237 genes annotated via Ribo-seq and RNA-seq in the same sample. The results revealed that the relative expression of the genes measured at the two levels was not consistent, and there was a significant difference in the expression of some genes at the two levels (Fig. 3A). Furthermore, we calculated the Pearson correlation coefficient of differentially expressed genes between translation expression and transcript abundance in the two comparison groups. The results revealed that the Pearson correlation coefficient of P1 vs. P3 at the transcription and translation levels was only 0.5354 (Fig. 3B).
Fig. 3
Analysis of the associations of differentially expressed genes at the transcription and translation levels. (A) Comparison of the relative expression of genes. (B) Scatterplot of correlation analysis for different genes
Integrative analysis to determine the target gene setsTo further explore the major differential gene sets associated with the efficient expression of foreign protein, we performed Venn analysis between the three comparison groups at the transcriptional level. There were 54 differentially expressed genes common to the three comparison groups (Fig. 4A). The characterization and analysis of 8 different trends of 54 highly correlated differentially expressed genes revealed significant upregulation (P = 0.00022) and significant downregulation (P = 4.9E-06) of 22 and 19 genes, respectively, with increasing fermentation time. The other types of trend plots were not significant (P > 0.05), so these genes were culled (Fig. 4B). Fortunately, the 41 differentially expressed genes (Table S5) associated with the efficient expression of foreign protein revealed by RNA-seq also showed significant differences at the level of translation via Venn analysis (Fig. 4C). On the other hand, 436 (187 upregulated, 149 downregulated) gene sets with significant differences only at the translation level were also of interest (Fig. 4D). Combined with the in vitro experimental indices between the two groups, the extracellular protease activity of the P3 group increased by 34.67 times compared with that of the P1 group, and these differential gene sets that were specific to the translation level may also be closely related to the efficient expression of foreign protein.
Fig. 4
Determination of target gene sets. (A) Venn analysis of three comparison groups at the transcription level. (B) Trend analysis of the target gene set. (C) Venn analysis of all differentially expressed genes at the transcription level and the target gene set at the translation level. (D) Volcano map of uniquely different gene sets at the translation level. Abbreviations: P1 = 12 h; P2 = 48 h; P3 = 60 h
Pathway enrichment analysis of the target gene setTo reveal the pathways of the key differential gene sets, the main differential gene sets were analysed by KO enrichment in units of the KEGG pathway. The results revealed the top 10 pathways with significant enrichment of 41 common differentially expressed genes at the transcription and translation levels, of which the first 9 pathways belong to metabolism: starch and sucrose metabolism; nitrogen metabolism; porphyrin metabolism; arginine and proline metabolism; 2-oxocarboxylic acid metabolism; oxidative phosphorylation; degradation of aromatic compounds; glycolysis/gluconeogenesis; biosynthesis of secondary metabolites; and the membrane phosphotransferase system (PST) pathway under the transport pathway (Fig. 5A). Sixteen significantly different genes were involved. The top 10 pathways were significantly enriched in 436 differentially expressed genes unique to the translation level, and the results revealed that 7 pathways were associated with metabolism: other glycan degradation, taurine and hypotaurine metabolism, propanoate metabolism, sulfur metabolism, arginine biosynthesis, lysine biosynthesis, and chlorocyclohexane and chlorobenzene degradation. There were two pathways involved in cell motility, flagellar assembly and bacterial chemotaxis, and a two-component system under the signal transduction pathway (Fig. 5B). Forty-seven significantly different genes were involved.
Fig. 5
Top 10 significantly enriched pathways of the target differential gene sets. (A) Forty-one differentially expressed genes at both the transcription and translation levels; (B) 436 differentially expressed genes unique to the translation level
Functional analysis of target genesThe pathways associated with the 16 major differentially expressed genes and the transformation process of the compounds were further revealed (Fig. 6). Two genes (putB and putC) with significantly upregulated expression were mainly involved in the regulation of the arginine and proline synthesis pathways (Fig. 6A). Only the membrane transport-related pathway (PTS) associated with the genes gmuA, gmuB, and gmuC was significantly downregulated, which was related mainly to the transmembrane transport of carbon sources (Fig. 6B). Carbohydrate metabolism involves two main pathways: glycolysis/gluconeogenesis and starch and sucrose metabolism. The former involves two differentially expressed genes, gmuD (downregulated) and acsA (upregulated) (Fig. 6C), and the latter involves five differentially expressed genes, gmuA, gmuB, gmuC, gmuD, and scrK. These genes were all downregulated, and these two pathways are related to glucose utilization (Fig. 6D). Energy metabolism involves two pathways, nitrogen metabolism and oxidative phosphorylation, which involve four downregulated differential genes, ctaA, ctaB2, narI, and narK, of which the ctaA and ctaB2 genes are involved in the oxidative phosphorylation pathway (Fig. 6E). These two genes also regulate porphyrin metabolism, which is related mainly to ATP synthesis (Fig. 6H). The narI and narK genes are involved in the nitrogen metabolism cycle and are ultimately closely related to the amino acid metabolism pathway (Fig. 6F). The biosynthesis of secondary metabolites pathway (bsdC, downregulated) and the degradation of aromatic compounds pathway (suhB, upregulated) also contain one gene each. The biosynthesis of secondary metabolites pathway was primarily involved in D-glucose-6P synthesis, which in turn participates in carbon metabolism (Fig. 6G). The pathway of degradation of aromatic compounds is associated with CoA, which further participates in the TCA cycle (Fig. 6I). Two significantly upregulated genes (argD and ilvD) associated with the 2-oxocarboxylic acid metabolism pathway were involved mainly in the synthesis of ornithine, valine, and isoleucine, which were in turn associated with the TCA cycle (Fig. 6J).
Fig. 6
Functions of 16 differentially expressed genes and corresponding pathways. (A) Arginine and proline metabolism; (B) phosphotransferase system; (C) glycolysis/gluconeogenesis; (D) starch and sucrose metabolism; (E) oxidative phosphorylation; (F) nitrogen metabolism; (G) biosynthesis of secondary metabolites; (H) porphyrin metabolism; (I) degradation of aromatic compounds; (J) 2-oxocarboxylic acid metabolism. The expression of differentially expressed genes is represented by a heatmap; each column in the figure represents a sample, and different colours represent different amounts of expression of genes in the sample, with blue representing downregulation and red representing upregulation
The pathways associated with the 47 major differentially expressed genes and the transformation process of the compounds were further revealed (Fig. 7). In the two-component system pathway, 16 differentially expressed genes were involved, of which 12 genes (comX, dnaA, bceB, dltC, dltD, cheB, tlpA, mcpA, cheA, cheW, eglS, and flgM) were significantly downregulated, while 4 genes (phoB, sacB, yodR, and yodS) were significantly upregulated (Fig. 7A). Among the cell motility pathways, flagellar assembly and bacterial chemotaxis were involved with 18 differentially expressed genes, and the flagellar assembly pathway (fliK, flgD, flgE, flhA, fliF, fliG, fliH, fliI, fliQ, fliJ, and flgM) and bacterial chemotaxis pathway (tlpA, mcpA, cheB, cheD, cheA, fliG, cheW, and cheC) showed a significant downwards trend (Fig. 7B and C). These 32 genes respond to changes in the external environment (orthophosphate, temperature, bacitracin, cAMP). In the amino acid metabolism pathway, arginine biosynthesis (yodQ, upregulated; ureB, rocG, and aspB, downregulated) and lysine biosynthesis (lysA, upregulated; murF and lysC, downregulated) were the main pathways, and arginine and lysine participated in the TCA cycle through the mediation of glutamate (Fig. 7D and E). Six differentially expressed genes (yngHB, yodR, and yodS, upregulated; pccB, ackA, and ytbE, downregulated) are involved in the propanoate metabolism pathway and participate in the TCA cycle through the production of succinyl-coA and acetyl-coA (Fig. 7F). Sulfur metabolism (tauC, yisZ, and yitB, upregulated; nrnA, downregulated) and taurine and hypotaurine metabolism (ywrD and rocG, upregulated; ackA, downregulated) participate in the TCA cycle through the production of acetate and isoleucine (Fig. 7G and H). In addition, sulfur metabolism can also be involved in glycolysis by synthesizing cysteine (Fig. 7H). Chlorocyclohexane and chlorobenzene degradation by the production of glycolate (Fig. 7J) and the degradation of other glycans (yesZ, upregulated; lytD, downregulated) by the degradation of carbon sources (Fig. 7I) are involved in glycolysis.
Fig. 7
Functions of 47 differentially expressed genes and corresponding pathways. (A) Two-component systems; (B) flagellar assembly; (C) bacterial chemotaxis; (D) arginine biosynthesis; (E) lysine biosynthesis; (F) propionic acid metabolism; (G) taurine and hypotaurine metabolism; (H) sulfur metabolism; (I) degradation of chlorocyclohexane and chlorobenzene; (J) degradation of other glycans. The expression of differentially expressed genes is represented by a heatmap; each column in the figure represents a sample, and different colours represent different amounts of expression of genes in the sample, with blue representing downregulation and red representing upregulation
Validation of partial genes and proteinsTo validate the RNA-seq results, we randomly selected ten differentially expressed genes and examined their expression patterns at the two fermentation stages via q‒PCR. Among them, the differentially expressed genes argD, putB, gmuC, ctaA, and scrK had significant differences in transcription and translation levels (Fig. 8A and B), and the differentially expressed genes ywrD, fliI, dltC, cheC, and aspB had significant differences only in translation level, and there were no significant differences in transcription level (Fig. 8A and B). Five genes (argD, putB, gmuC, ctaA, and scrK) were differentially expressed (P < 0.05) at different stages according to q‒PCR. In addition, the expression of five genes tended to be similar (argD and putB, upregulated; gmuC, ctaA, and scrK, downregulated) to the results of RNA-seq and q-PCR (Fig. 8C). However, there was still no significant difference (P > 0.05) in the remaining five genes (ywrD, fliI, dltC, cheC, and aspB) between the results of RNA-seq and q-PCR (Fig. 8D). In addition, we further validated the protein activity of four differentially expressed genes (argD, putB, scrK, and ywrD). The results revealed significant differences in the protein activities of the four differentially expressed genes between the two groups (Fig. 8E) (P < 0.05). The activity of these four proteins showed a similar trend (argD, putB, and ywrD, upregulated; scrK, downregulated) to the Ribo-seq results (Fig. 8E and B). However, although the ywrD gene was verified by RNA-seq (Fig. 8A) and q-PCR (Fig. 8D), there was no significant difference (P > 0.05). However, there was significant variation in protein activity (Fig. 8E) (P = 0.0258). Therefore, the FPKM obtained from RNA-seq can be reliably used to determine gene expression, and Ribo-seq more accurately measures the protein activity of the gene of interest.
Fig. 8
Validation of partial genes via q‒PCR (n = 9 in each group). (A) Heatmap analysis of 10 target genes at the transcriptional level in the sample. (B) Heatmap analysis of 10 target genes at the translational level in the sample. (C) The relative expression of five target genes with differences in transcription and translation levels was measured via q‒PCR. (D) The relative expression of five target genes with differences in only translation levels was measured via q‒PCR. (E) The protein activities of the four target genes were compared. Abbreviations: P1 = 12 h; P3 = 60 h; “r” stands for samples for Ribo-sequencing. Each column in the figure represents a sample, each row represents a gene, and different colours represent different amounts of gene expression in the sample. Using OriginPro 2018 C statistical analysis data, the difference between the two independent samples was statistically significant at P < 0.05
Comments (0)