
Remember me

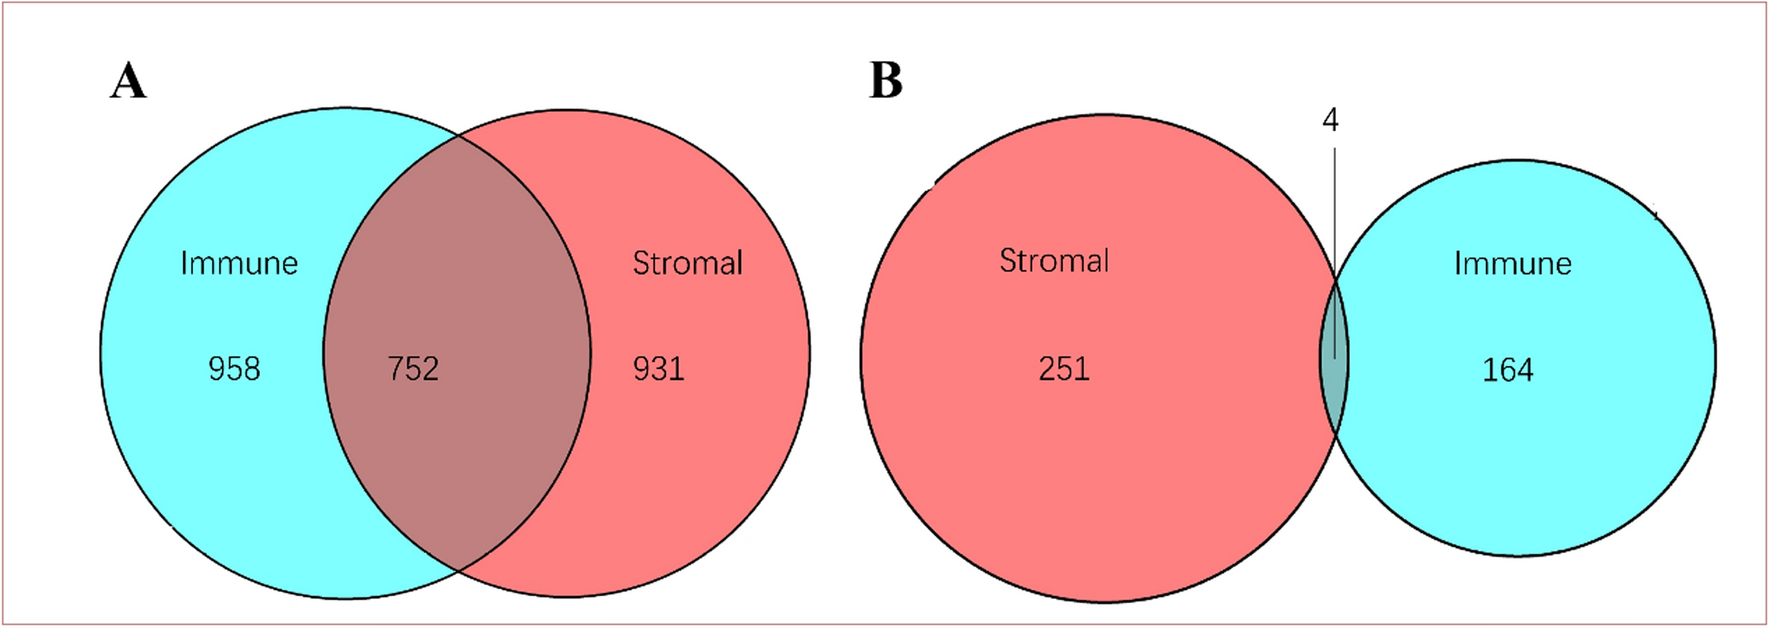

Differential expression analysis of ARGs was conducted between NPC tissues and normal nasopharyngeal tissues in GSE12452, GSE53819, and GSE61218. Among the three datasets, a total of 78 ARGs were identified with a p-value less than 0.05. Out of these, 52 were found to be upregulated, while nineteen were downregulated. Seven ARGs showed inconsistent regulation and were therefore not included in the study, as shown in Fig. 2A.
Fig. 2
Identification of differentially expressed ARGs with prognostic value. A Venn plot of differentially expressed ARGs in GSE12452, GSE53819, and GSE61218. B Venn plot of differentially expressed ARGs and prognosis-associated ARGs. C Forest plot of the univariate Cox regression in nine key genes in GSE102349. D Protein–protein interaction network of the nine key genes. E Correlation matrix of the nine key genes. ARGs: anoikis-related genes
Prognosis-related genes from ARGs in GSE102349 were identified using univariate Cox regression analysis. Fifty-one ARGs demonstrated a notable correlation with NPC patient's PFS (Table S2). The intersection between 71 DEGs and 51 prognosis-associated genes yielded 10 genes (Fig. 2B). To our dismay, HAVCR2 was upregulated in NPC tissues but correlated with a good prognosis during univariate Cox regression. Accordingly, it was also excluded from the study. Nine key genes (RBL2, PPP2R5A, PBK, SKP2, BIRC5, CYCS, EZH2, E2F1, and CDC25C) were finally selected to further study (Fig. 2C). CDC25C and E2F1 were the top 2 hub genes of the network interacting with other genes (Fig. 2D) and strongly correlated with other genes (Fig. 2E).
3.2 Identification of NPC classification pattern mediated by prognostic anoikis-related DEGsThe nine predictive anoikis-associated DEGs discussed earlier were subjected to consensus clustering from k = 2 to k = 6 in GSE102349, with k = 2 showing the most stable clustering results (Fig. 3A, B). The PLS-DA result showed a clear separation between the two clusters (Fig. 3C). Prognostic analysis of the two clusters revealed a better PFS for cluster 2 (Fig. 3D). CDC25C, CYCS, SKP2, BIRC5, PBK, E2F1, and EZH2 showed elevated levels in cluster 1 compared to cluster 2, whereas PPP2R5A and RBL2 exhibited lower expression in cluster 1 (Fig. 3E).
Fig. 3
Consensus clustering of differentially expressed ARGs associated with prognosis in GSE102349. A Clustering matrix for k = 2 achieved through consensus. B Cumulative distribution function for consensus clustering with k values ranging from 2 to 6. C PLS-DA of two ARGs clusters. D Kaplan–Meier curve of progression-free survival for two ARGs clusters. E Heatmap of the expression of 9 key ARGs between two clusters. F Enrichment of tumor progression-related pathways in cluster 1. G Enrichment of immune-related pathways in cluster 2. ARGs: anoikis-related genes; PLS-DA: partial least squares discriminant analysis
GSEA was performed on different enriched gene sets to explore the mechanisms related to the ARGs clusters (Fig. 3F–G). The findings indicated that cluster 1 had a significant enrichment of biological processes related to tumor progression, whereas cluster 2 showed significant enrichment of pathways related to the immune system.
3.3 Identification of three feature ARGs and construction of risk score by machine learningThe SVM-RFE analysis demonstrated that the error rate was minimized at N = 5 (Fig. 4A), with the identified genes being CDC25C, E2F1, RBL2, BIRC5, and PBK. Subsequently, a 3-gene signature (CDC25C, E2F1, and RBL2) was determined using LASSO based on the optimal λ value (Fig. 4B). Furthermore, the XGBoost analysis revealed RBL2, E2F1, CDC25C, CYCS, and BIRC5 as the top 5 important variables (Fig. 4C), while the RSF analysis identified E2F1, RBL2, CDC25C, BIRC5, and CYCS as the top 5 variables (Fig. 4D). Based on these findings, RBL2, E2F1, and CDC25C were identified as the key feature genes. Single-cell analysis showed that NPC cells expressed significantly less RBL2, high E2F1 and CDC25C than the non-malignant epithelial cells (Fig. 4E–G).
Fig. 4
Screening the feature ARGs and constructing the risk score using machine learning. Screening feature genes using SVM-RFE (A), LASSO (B), XGBoost (C) and RSF (D) algorithms. Single-cell analysis of RBL2 (E), E2F1 (F) and CDC25C (G). Kaplan–Meier curve and time-dependent ROC curve were generated to analyze progression-free survival in NPC patients using risk scores calculated by LASSO (H, I) and RSF (J, K) methods. ARGs anoikis-related genes, AUC area under the curve, LASSO Least Absolute Shrinkage and Selection Operator, SVM-RFE Support Vector Machine Recursive Feature Elimination, XGBoost eXtreme Gradient Boosting, RSF Random Survival Forests
Subsequently, we employed LASSO-COX regression and RSF algorithm to develop a risk score based on a signature of three ARGs (CDC25C, E2F1 and RBL2). Patients with high-risk scores showed a notably shorter PFS compared to those with low-risk scores (Fig. 4H, J). The C-index for the risk score derived from LASSO and RSF were 0.756 (95%CI 0.625–0.888) and 0.792 (95%CI 0.678–0.907), respectively. Additionally, the AUC of the time-dependent ROC was higher for the RSF risk score than for the LASSO risk score (Fig. 4I, K). Moreover, the IDI (0.118, 95% CI 0.035–0.220, p < 0.001) and NRI (0.460, 95% CI 0.130–0.792, p = 0.016) statistics indicated a preference for the RSF model compared to the LASSO model. Consequently, the RSF risk score was ultimately selected for predicting the survival of NPC patients in this study.
3.4 Characteristics and predictive significance of the risk score derived from the ARGs signatureIn GSE102349, NPC patients were categorized into high- and low-risk groups based on the median risk score calculated using the RSF algorithm. Patients in advanced stages (III-IV) exhibited a notably elevated risk score compared to those in early stages (I-II) (Fig. 5A). The risk score of patients with differentiated cancer was higher than those with undifferentiated or mixed type, although the p-value was not statistically significant (Fig. 5B). Patients with TME subtype I had the highest risk score, as shown in Fig. 5C. According to reports, individuals with TME subtype I experienced the lowest PFS [30].
Fig. 5
Characteristics and prognostic value of the risk score derived from the ARGs signature. Risk score in different clinical stages (A), morphology (B), and TME subtypes (C). D Multivariate Cox regression analysis and clinicopathologic factors associated with NPC. E Nomogram predicting the probability of the 1 and 2 years PFS. F Decision curve analysis evaluating the net clinical benefit of the risk model for the 1 and 2 years PFS. G, H Calibration plot of the nomogram predicting the probability of the 1 and 2 years PFS. I Difference in risk score between the two ARGs clusters. J Alluvial plot showing the relationships among the ARGs clusters, risk score and survival status. K Association between the risk score and relevant expression of EBV genes. L Kaplan–Meier curve of overall survival for TCGA-HNSCC patients with high- and low-risk score. M Multivariate Cox regression analysis for TCGA-HNSCC cohort. ARGs anoikis-related genes, DP disease progression, HNSCC head and neck squamous cell carcinoma, PF progression-free, PFS progression-free survival, TCGA The Cancer Genome Atlas
The multivariate Cox regression analysis showed that the risk score had an independent predictive value for NPC prognosis (HR = 4.33, 95% CI 2.15–8.72) (Fig. 5D). The nomogram, which included the risk score, morphology, TME subtype, and clinical overall stage, demonstrated stability and accuracy, indicating its clinical usefulness in treating NPC patients (Fig. 5E). The calibration curve findings showed agreement between the actual and estimated rates for the 1- and 2-year PFS (Fig. 5G, H). DCA further indicated a net benefit of the prognosis model (Fig. 5F).
Further investigation was conducted on the correlation between the risk score and two clusters of ARGs. The patients in cluster 1 were associated with a higher risk score (Fig. 5I) and a worse prognosis. A plot of alluvial type illustrated the connection between the clusters of ARGs, the risk score, and the status of survival (Fig. 5J). Concurrently, it was discovered that the risk score correlated positively with the relative expression of EBV genes like EBNA1, RPMS1, and A73 (Fig. 5K).
Due to the lack of other public datasets of NPC with survival data, we validated the predictive value of the risk score based on the ARGs signature in the TCGA-HNSCC cohort. Similarly, the high risk score was significantly associated with poor overall survival of patients (Fig. 5L), and the risk score was an independent prognostic factor (Fig. 5M).
3.5 Functional annotation of DEGs in groups with high- and low-risk scoresEnrichment analyses using GO, KEGG, and GSVA were conducted to evaluate the potential functions and pathways of DEGs in groups with high- and low-risk scores. The results of the GO analysis showed a notable increase in terms related to molecular function (MF), like cytokine receptor activity, immune receptor activity, DNA helicase activity, and ATP-dependent activity on DNA, along with terms linked to biological processes (BP), such as B cell receptor signaling pathway, immune response-regulating cell surface receptor signaling pathway, immune response-activating cell surface receptor signaling pathway, and antigen receptor-mediated signaling pathway (Fig. 6A). In addition, the KEGG analysis revealed that ribosome, cell cycle, DNA replication, nucleocytoplasmic transport, and spliceosome were the main pathways in the high-risk score group, whereas the low-risk score group showed significant enrichment in the chemokine signaling pathway, viral protein interaction with cytokine and cytokine receptor, B cell receptor signaling pathway, and natural killer cell mediated cytotoxicity (Fig. 6B). Additionally, the GSVA findings indicated a negative correlation between the risk score and pathways related to B cell differentiation, B cell proliferation in immune response, T cell receptor binding, T cell receptor complex, natural killer cell cytokine production, and immune dysregulation (Fig. 6C). Functional enrichment analyses suggested that DEGs associated with the risk score may be enriched in immune system-related pathways.
Fig. 6
Representative results of GO (A), KEGG (B), and GSVA (C) assessments of high- and low-risk score groups in GSE102349. CC cellular component, MF molecular function, BP biological process, GO Gene Ontology, KEGG Kyoto Encyclopedia of Genes and Genomes, GSVA Gene Set Variation Analysis
3.6 Immune landscape analysis of the risk scoreConsistent results from the four immune signature algorithms showed that the low-risk score group had notably higher percentages of B cells, T cells, and NK cells in comparison to the high-risk score group (Fig. 7).
Fig. 7
The landscape of the immune infiltration analyzed by EPIC (A), MCPcounter (B), quanTIseq (C) and xCell (D) signatures in high- and low-risk score groups
Furthermore, the immune score and stromal score obtained from xCell and ESTIMATE analyses exhibited a significant decrease with increasing risk scores (Fig. 8A–F). The findings indicate that individuals with a low-risk score exhibit a stronger immune response than those with a high-risk score. In the analysis of the immunophenoscore (IPS), it was found that the immunosuppressive cell score showed a significant positive association with the risk score, while the effector cell score and immune checkpoint score exhibited a significant negative association with the risk score (Fig. 8G–I). Additionally, the correlation analysis revealed a notable inverse correlation between the risk score and the levels of immune checkpoint genes, specifically PDCD1 (PD-1), CD80, CD86, CTLA4, TIGIT, BTLA, CD27, and CD28 (Fig. 8J). Patients classified in the cold tumor group with an immunosuppressive state demonstrated poorer PFS, decreased expression of RBL2, and increased expression of E2F1 and CDC25C compared to patients in the hot tumor group with immune activation (Fig. 8K–N).
Fig. 8
The immune score, expression of immune checkpoint genes, immune cold or hot tumor groups in NPC patients with varying risk scores. Correlation between the risk score and immune score (A), stromal score (B), and microenvironment score (C) in the xCell analysis. Correlation between the risk score and immune score (D), stromal score (E), and ESTIMATE score (F) in the ESTIMATE analysis. Correlation between the risk score and effector cell score (G), immunosuppressive cell score (H), and immune checkpoint score (I) in the IPS analysis. J Correlation between the risk score and levels of immune checkpoint genes. K Kaplan–Meier curve for progression-free survival in the immune cold and hot tumor groups. Contrasting the expression of RBL2 (L), E2F1 (M), and CDC25C (N) between the immune cold and hot tumor groups. *** p < 0.001
The aforementioned findings suggest a link between the ARGs risk score and the immune checkpoint expression. Following this, we investigated the prognostic implications of the ARGs risk score within the IMvigor210 group. Following treatment with anti-PD-L1 inhibitor, patients who had a complete or partial response showed lower risk scores than those who had stable or progressive disease (Fig. 9A, B). No difference in risk score was observed between patients at early (I-II) and advanced (III-IV) stages (Fig. 9C). Importantly, individuals with low risk scores demonstrated significantly longer overall survival compared to those with high risk scores (Fig. 9D). Furthermore, stratified analysis revealed that a high risk score was associated with inferior survival outcomes in both the early and advanced stage subgroups (Fig. 9E, F).
Fig. 9
The therapeutic efficacy of the ARGs risk score to anti-PD-L1 inhibitor in the IMvigor210 cohort. A Risk scores among different immunotherapy response of anti-PD-L1 inhibitor. B Percentages of response to anti-PD-L1 inhibitors in groups with high and low risk scores. C Risk score in the different clinical stages. Kaplan–Meier curves for two risk score groups in the entire IMvigor210 group (D), in patients at early stages (I–II) (E), and in those at advanced stages (III–IV) (F). ARGs anoikis-related genes, CR complete response, PD progressive disease, PR partial response, SD stable disease
3.7 Biological pathways involved of RBL2, E2F1 and CDC25CThe results of GSEA analysis for RBL2, E2F1 and CDC25C in NPC showed that the cell cycle and apoptosis-related signaling pathways were enriched (Fig. 10A–C). And the expression of these three key feature genes (RBL2, E2F1, and CDC25C) were significantly correlated with caspase family genes (CASP3, CASP7, CASP8, and CASP9), which are the key components of the apoptosis signaling pathway. (Fig. 10D).
Fig. 10
Biologic function analysis of RBL2, E2F1 and CDC25C in NPC. Enriched signaling pathways associated with RBL2 (A), E2F1 (B) and CDC25C (C). D Correlation network among three key feature genes (RBL2, E2F1 and CDC25C) and caspase family genes (CASP3, CASP7, CASP8 and CASP9). Red line means negative correlation and blue line means positive correlation; * p < 0.05, ** p < 0.01, *** p < 0.001
3.8 Validation of the RBL2 expression in NPCRT-PCR results indicated a notable decrease in RBL2 mRNA expression in NPC tissues compared to nasitis tissues (Fig. 11A, B). At the cellular level, the expression of RBL2 in NPC cell lines (5-8F, CNE1, CNE2, CNE2-EBV, HK1, HONE1, and TW03) were also significantly lower than that of immortalized nasopharynx cell NP69 (Fig. 11C).
Fig. 11
The mRNA expression level of RBL2 in NPC. A RBL2 expression was tested in NPC and nasitis tissues using RT-PCR. B Different expression of RBL2 between NPC tissues and nasitis tissues. C Different expression of RBL2 in NPC cell lines and NP69. * p < 0.05, ** p < 0.01, *** p < 0.001
Immunohistochemical staining was conducted on nasopharyngeal tissues and NPC tissues to confirm the RBL2 protein expression (Fig. 12A, B). Result showed that RBL2 protein was significantly overexpressed in normal epithelial tissues at nasopharynx as compared to NPC tissues (Fig. 12C), consistent with its mRNA expression pattern. ROC curve analysis of RBL2 indicated certain diagnostic accuracy (AUC = 0.640, 95%CI 0.509–0.771) (Fig. 12D).
Fig. 12
The RBL2 protein expression in NPC. Representative IHC images of RBL2 in normal nasopharyngeal tissue (A), and in NPC tissue (B) (Magnification: × 40). C IHC scores of RBL2 in normal nasopharyngeal tissues vs NPC tissues. D ROC curve of RBL2. IHC immunohistochemistry, N normal, T tumor; *** p < 0.001
Comments (0)