
Remember me


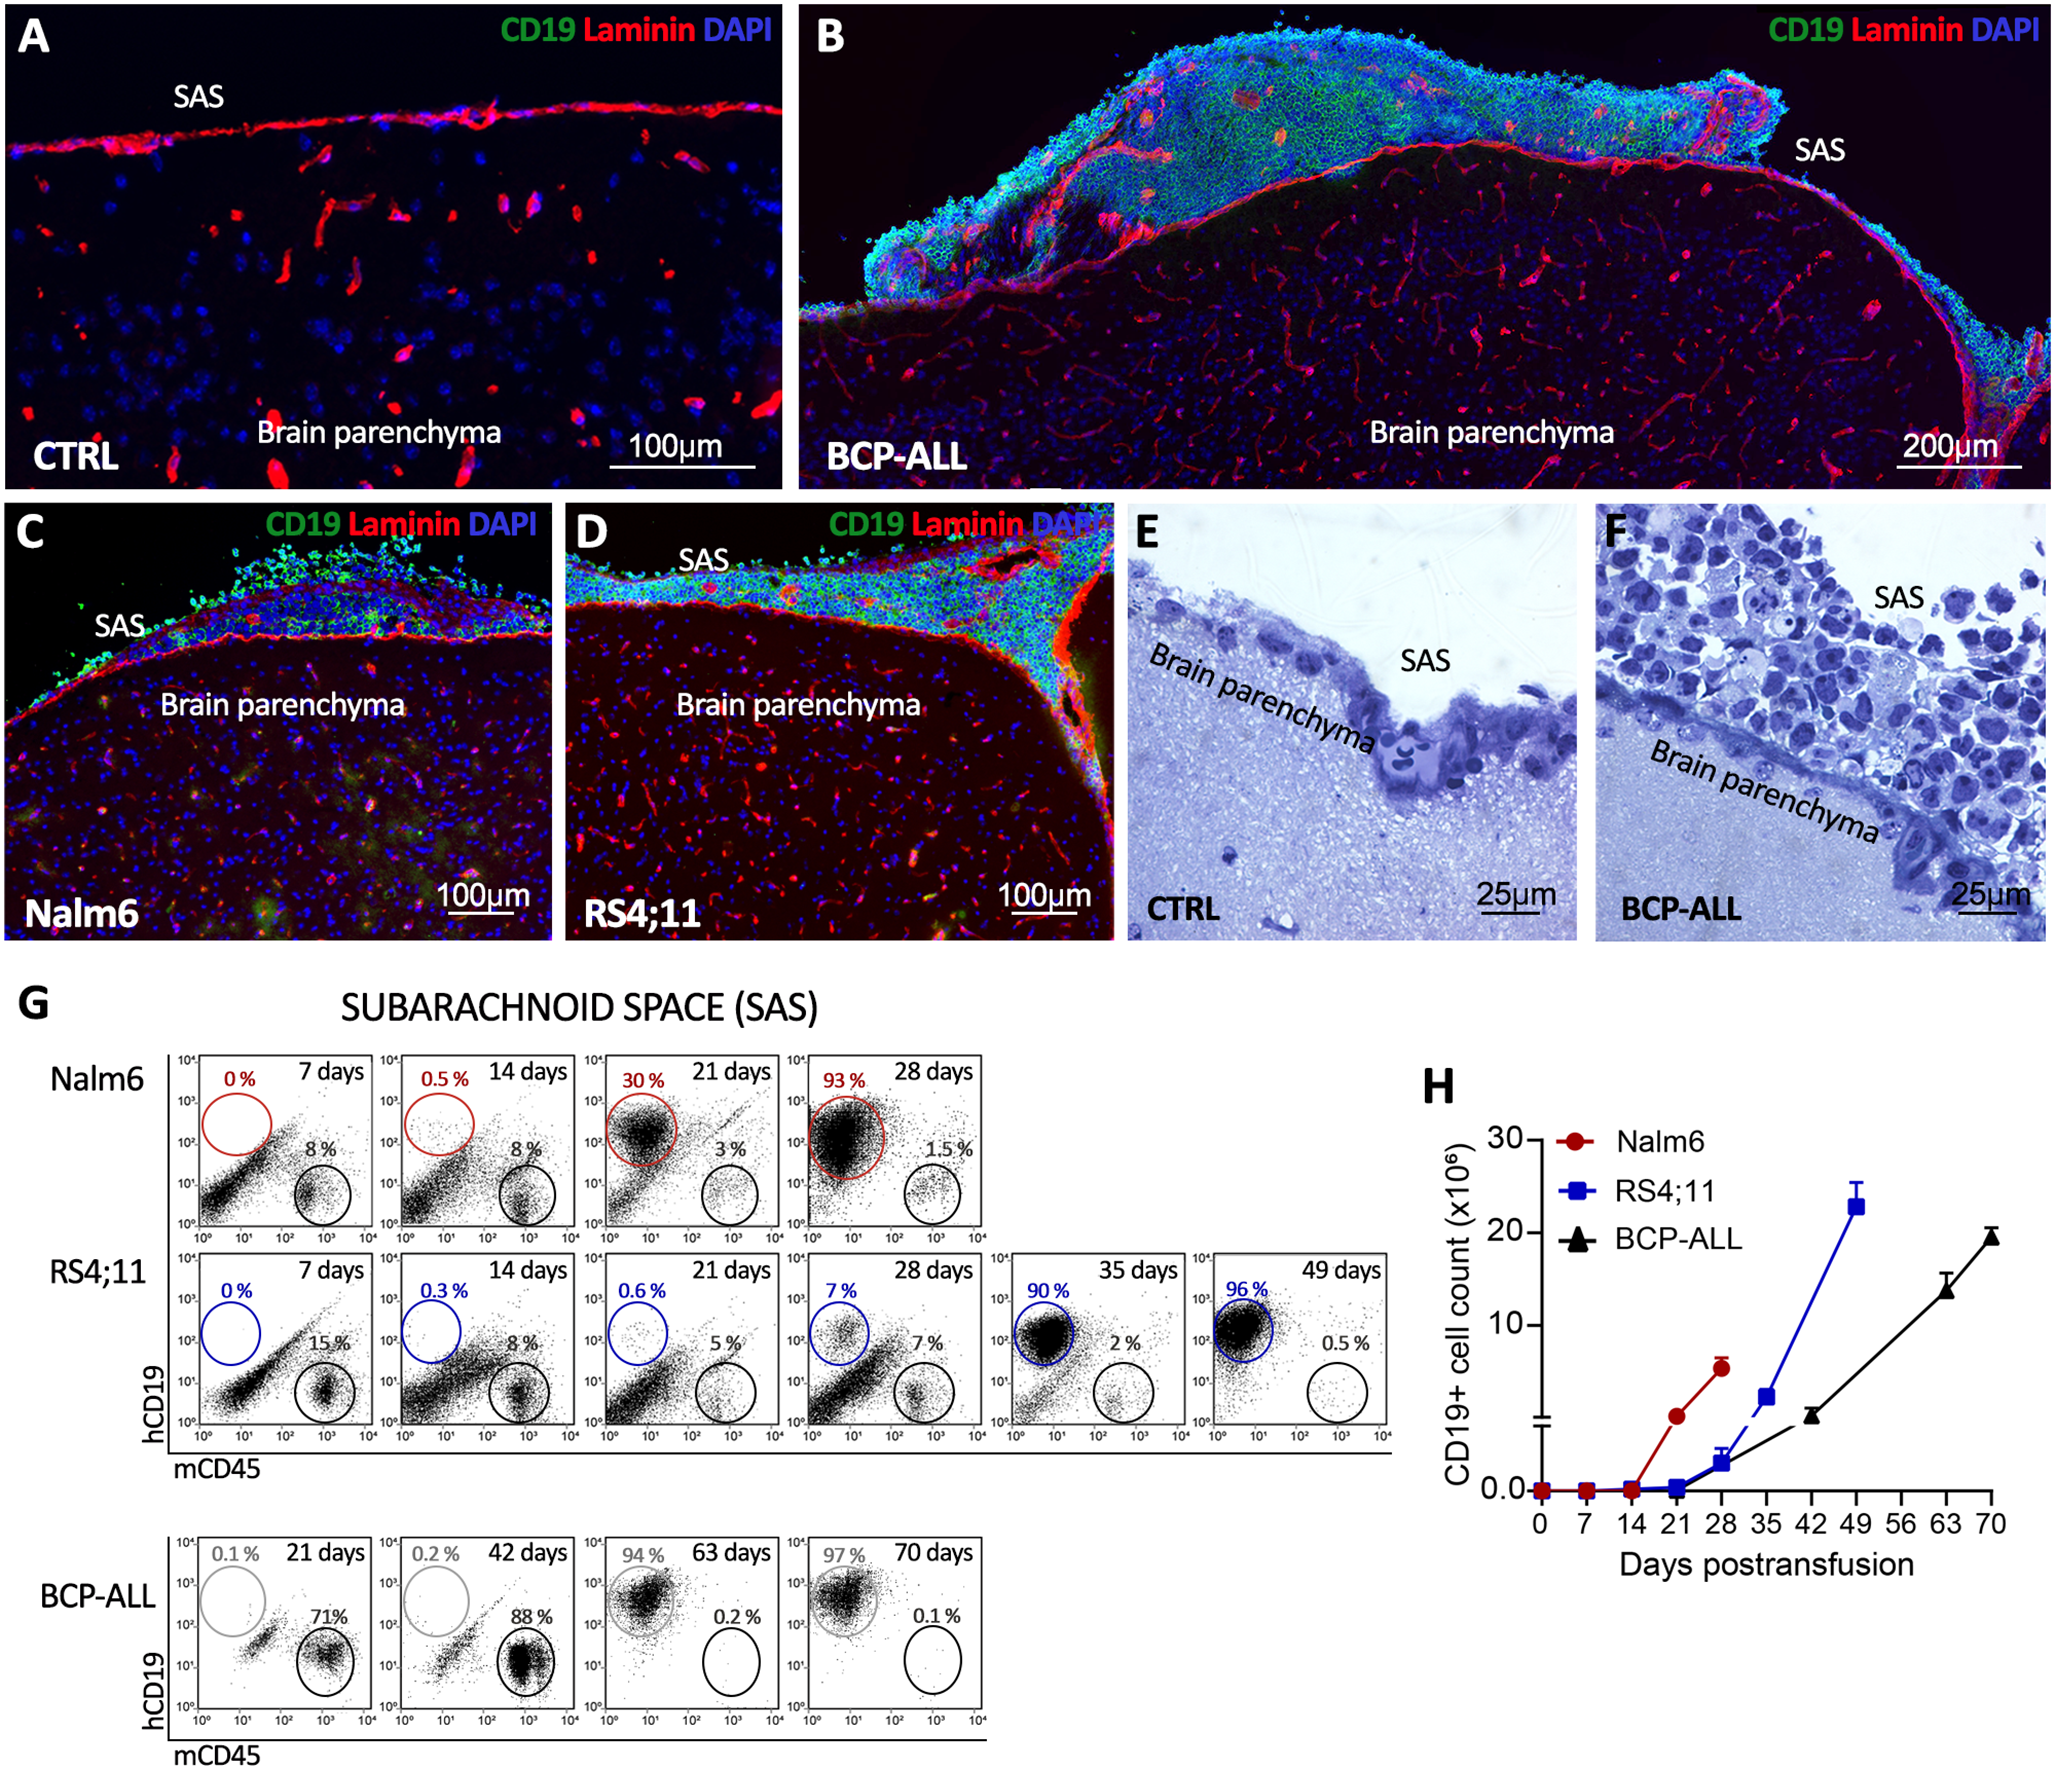
A total of 2,730 patients participated in this study, and 1,152 deaths were recorded. The median overall follow-up time was 7.14 years (95% confidence interval (CI): 7.03, 7.25). Participants were categorized into two groups: 264 (9.7%) in the TD-positive group and 2,466 (90.3%) in the TD-negative group. Among 264 TD-positive patients, 105 (39.8%) had a single TD, 111 (42.1%) had two or more, and 48 (18.1%) had missing data regarding the number of TDs. The number of TDs ranged from 1 to 10, with a median of two.
Baseline characteristics, stratified by the presence or absence of TD, are summarized in Table 1. Patients with TD were older than those without TD (age > 60 years: 49.2% vs. 40.0%; P = 0.004). They also exhibited larger tumors (mean size: 6.0 ± 2.4 cm vs. 4.6 ± 2.6 cm; P < 0.001), poorer tumor differentiation (71.2% vs. 64.5%; P = 0.030), higher rates of lymphovascular invasion (71.6% vs. 51.0%; P < 0.001) and perineural invasion (84.9% vs. 71.0%; P < 0.001), and more advanced TNM stages (stage III: 86.4% vs. 48.1%; P < 0.001). Additionally, these patients were more likely to undergo total gastrectomy (65.5% vs. 48.8%; P < 0.001) and postoperative chemotherapy (83.0% vs. 77.2%; P = 0.030), had fewer lymph node dissections (> 16 nodes: 87.1% vs. 92.5%; P = 0.002), and presented with elevated preoperative carcinoembryonic antigen (CEA) (26.5% vs. 17.0%; P < 0.001) and carbohydrate antigen 199 (CA199) (23.1% vs. 12.9%; P < 0.001) levels.
3.2 Correlation between the presence of TD and GC prognosisAs illustrated in Fig. 2, patients with TD had significantly lower OS compared with those without TD (hazard ratio (HR): 3.31; 95% CI: 2.84, 3.85; P < 0.001), including in stage II (HR: 3.02; 95% CI: 1.43, 6.38; P < 0.001) and stage III (HR: 1.90; 95% CI: 1.55, 2.32; P < 0.001). For stage I patients, those with TD also demonstrated a worse OS rate than those without TD, although the difference was not statistically significant (HR: 3.429; 95% CI: 0.092, 127.9; P = 0.193) (Fig. S3). Similarly, patients with TD in stages IIB (P < 0.001), IIIA (P < 0.001), IIIB (P = 0.003), and IIIC (P < 0.001) had worse OS compared with their TD-negative counterparts, while no significant difference was identified in stage IIA (P = 0.140). The negative impact of TD on OS was also found across different N (N0–N3b) and T (T3–T4) stages (Fig. S4 and Fig. S5; all P < 0.010).
Fig. 2
Kaplan-Meier curves for overall survival comparing TD-negative and TD-positive patients in both unmatched and matched cohorts. a-c Unmatched cohort: (a) all patients, (b) stage II patients, and (c) stage III patients. d-f Matched cohort: (d) all patients, (e) stage II patients, and (f) stage III patients. TD, tumor deposit
In a multivariable Cox model, TD was found as an independent predictor of mortality (HR: 1.92; 95%CI:1.63, 2.26; P < 0.001) (Table 2). Compared with TD-negative group, the TD-positive group had a significantly higher HR in the following subgroups: N0 (HR: 9.04; 95% CI: 3.77, 21.68; P for interaction = 0.02), no lymphovascular invasion (HR: 8.85; 95% CI: 4.78, 16.38; P for interaction = 0.03), no perineural invasion (HR: 12.36; 95% CI: 4.83, 31.60; P for interaction = 0.03), and no postoperative chemotherapy(HR:14.94; 95%CI: 5.79, 38.54; P for interaction = 0.02) (Fig. 3).
Table 2 The univariate and multivariate survival analyses of all patients with gastric cancerFig. 3
Forest plot illustrating the independent clinical risk factors for TD presence in patients with gastric cancer. TD, tumor deposit; HR, hazard ratio; 95%CI, 95% confidence interval; CEA, carcinoembryonic antigen; CA199, carbohydrate antigen 199
Following the 1-to-1 PSM, 256 matched pairs with balanced baseline clinicopathological characteristics were generated. The findings were consistent with those of the overall population, demonstrating significantly worse OS in the TD-positive group (HR: 1.62; 95% CI: 1.31, 2.00; P < 0.001), including stages II and III (all P < 0.050) (Fig. 2).
3.3 Effects of postoperative chemotherapy on the prognosis of patients with TDThe analysis concentrated primarily on patients with stage II and III GC. Among TD-positive patients, those receiving chemotherapy had significantly better prognoses compared with those without chemotherapy (HR: 0.52; 95% CI: 0.37, 0.74; P < 0.001). This trend was noted in both stage II (HR: 0.52; 95% CI: 0.19, 1.45; P = 0.210) and stage III (HR: 0.52; 95% CI: 0.36, 0.76; P = 0.001) subgroups, although statistical significance was not reached in stage II (Fig. S6). Similarly, chemotherapy improved outcomes for TD-negative patients with GC (HR: 0.62; 95% CI: 0.52, 0.74; P < 0.001), with significant benefits found in both stage II (HR: 0.52; 95% CI: 0.36, 0.75; P = 0.001) and stage III (HR: 0.62; 95% CI: 0.51, 0.75; P < 0.001) subgroups (Fig. S6).
3.4 Correlation between the number of TDs and GC prognosisThe relationship between the number of TDs, LNMs, and patient mortality risk was analyzed using RCS analysis. The results indicated that both TDs and LNMs was associated with a higher risk of mortality, with TDs exerting a more significant impact on the GC patients’ prognosis than LNMs. The presence of two TDs quadrupled mortality risk in GC patients, whereas ten LNMs tripled this risk, demonstrating that a single TD has a greater adverse effect on prognosis than a single LNM (Fig. 4a, b). However, the mortality risk associated with TDs plateaued once the number exceeded two, whereas the risk associated with LNMs continued to increase with additional LNMs.
Fig. 4
Effects of TD and LNM on gastric cancer patients’ prognosis. a-b Restricted cubic spline regression analysis of overall survival in the number of TDs (a) and LNMs (b), and the shaded area represents the 95% confidence interval (CI); c-d Overall survival (c) and disease-free survival (d) according to the number of TDs; e-f Overall survival (e) and disease-free survival (f) according to the modified TNM staging system. TD, tumor deposit; LNM, lymph node metastasis
To further validate the impact of the number of TDs on OS and disease-free survival (DFS), patients were categorized into TD-negative, 1-TD, 2-TD, and ≥ 3-TD groups. Compared with the TD-negative group, the HRs for OS were 2.26 (95% CI: 1.78, 2.88) for 1-TD, 3.97 (95% CI: 2.88, 5.48) for 2-TD, and 4.92 (95% CI: 3.72, 6.52) for ≥ 3-TD. The 5-year OS rates were 64.7%, 34.6%, 18.9%, and 13.6%, respectively (P < 0.001) (Fig. 4c), and no significant difference was found between the 2-TD and ≥ 3-TD groups (P = 0.309). A similar trend was noted for DFS. The 5-year DFS rates were 62.5%, 34.0%, 19.3%, and 13.6%, respectively (P < 0.001). HRs for DFS were 2.28 (95% CI: 1.79, 2.89) for 1-TD, 3.85 (95% CI: 2.80, 5.29) for 2-TD, and 4.65 (95% CI: 3.51, 6.16) for ≥ 3-TD (Fig. 4d).
3.5 External validation of modified staging models and proposal of a new staging strategyThe current primary cohort was utilized to compare the predictive accuracy of six different modified staging models against the 8th edition AJCC TNM staging system. Discriminatory ability was assessed using the C-index and AIC, where higher C-index values and lower AIC values indicated superior performance. Among the models, integrating TDs into N staging demonstrated superior predictive ability compared with the system that classified TD as part of T4a (Table 3).
Table 3 Comparison of the performance of the TNM staging system and other revised staging systems for gastric cancerGiven the significant impact of a single TD on GC prognosis compared with a single LNM, this study tested equivalencies of one TD to two, three, four, and five LNMs within the TNM staging. The model equating one TD to four LNMs exhibited the best prognostic performance, surpassing the 8th edition AJCC TNM system and other modified models (C-index: 0.751, AIC: 15954.0).
3.6 The prognostic effect of including TD in TNM stagingAfter excluding 48 TD-positive patients with missing TD count data, a modified staging system incorporating one TD as equivalent to four LNMs was applied. Among TD-positive patients, 68.0% (147/216) experienced stage upgrades, representing 5.5% (147/2,682) of the entire cohort. The highest rate of stage migration was identified in stage IIIa (10.22%) (Fig. 5a). Additionally, 75.5% (163/216) of TD-positive patients had upgrades in N stage, accounting for 6.0% (163/2,682) of all patients, and N2 exhibited the highest migration rate (12.6%) (Fig. 5b).
Fig. 5
After incorporating 1 TD as 4 LNM into gastric cancer TNM staging, a Changes in TNM stage distribution; b Changes in N stage distribution
Notably, 12.04% (26/216) of TD-positive patients were upstaged from stage II to stage III. These upstaged patients exhibited significantly worse OS compared with other stage II patients (HR: 10.97; 95% CI: 4.55, 26.44; P < 0.0001), while similar OS to original stage III patients (HR: 1.08; 95% CI: 0.66, 1.78; P = 0.761) (Fig. 4e). Similarly, their DFS was poorer than stage II patients (HR: 3.39; 95% CI: 2.09, 5.50; P < 0.001), while was comparable to stage III patients (HR: 1.08; 95% CI: 0.668, 1.73; P = 0.740) (Fig. 4f).
3.7 Development and validation of a prognostic nomogramA prognostic nomogram was developed based on multivariate analysis results and the equivalence of one TD to four LNMs (Fig. S7a). The nomogram demonstrated superior predictive performance, with a C-index of 0.765 and an AUC of 0.806, outperforming individual risk factors (Fig. S7c). Furthermore, calibration curves indicated excellent agreement between predicted outcomes and observed results (Fig. S7b).
Comments (0)