
Remember me

This retrospective single-center study was approved by the local institutional review board (cantonal ethics committee Zurich). It was performed according to the principles of the Declaration of Helsinki and national ethics standards. All patients signed a written general consent form allowing their health-related data to be used for research purposes.
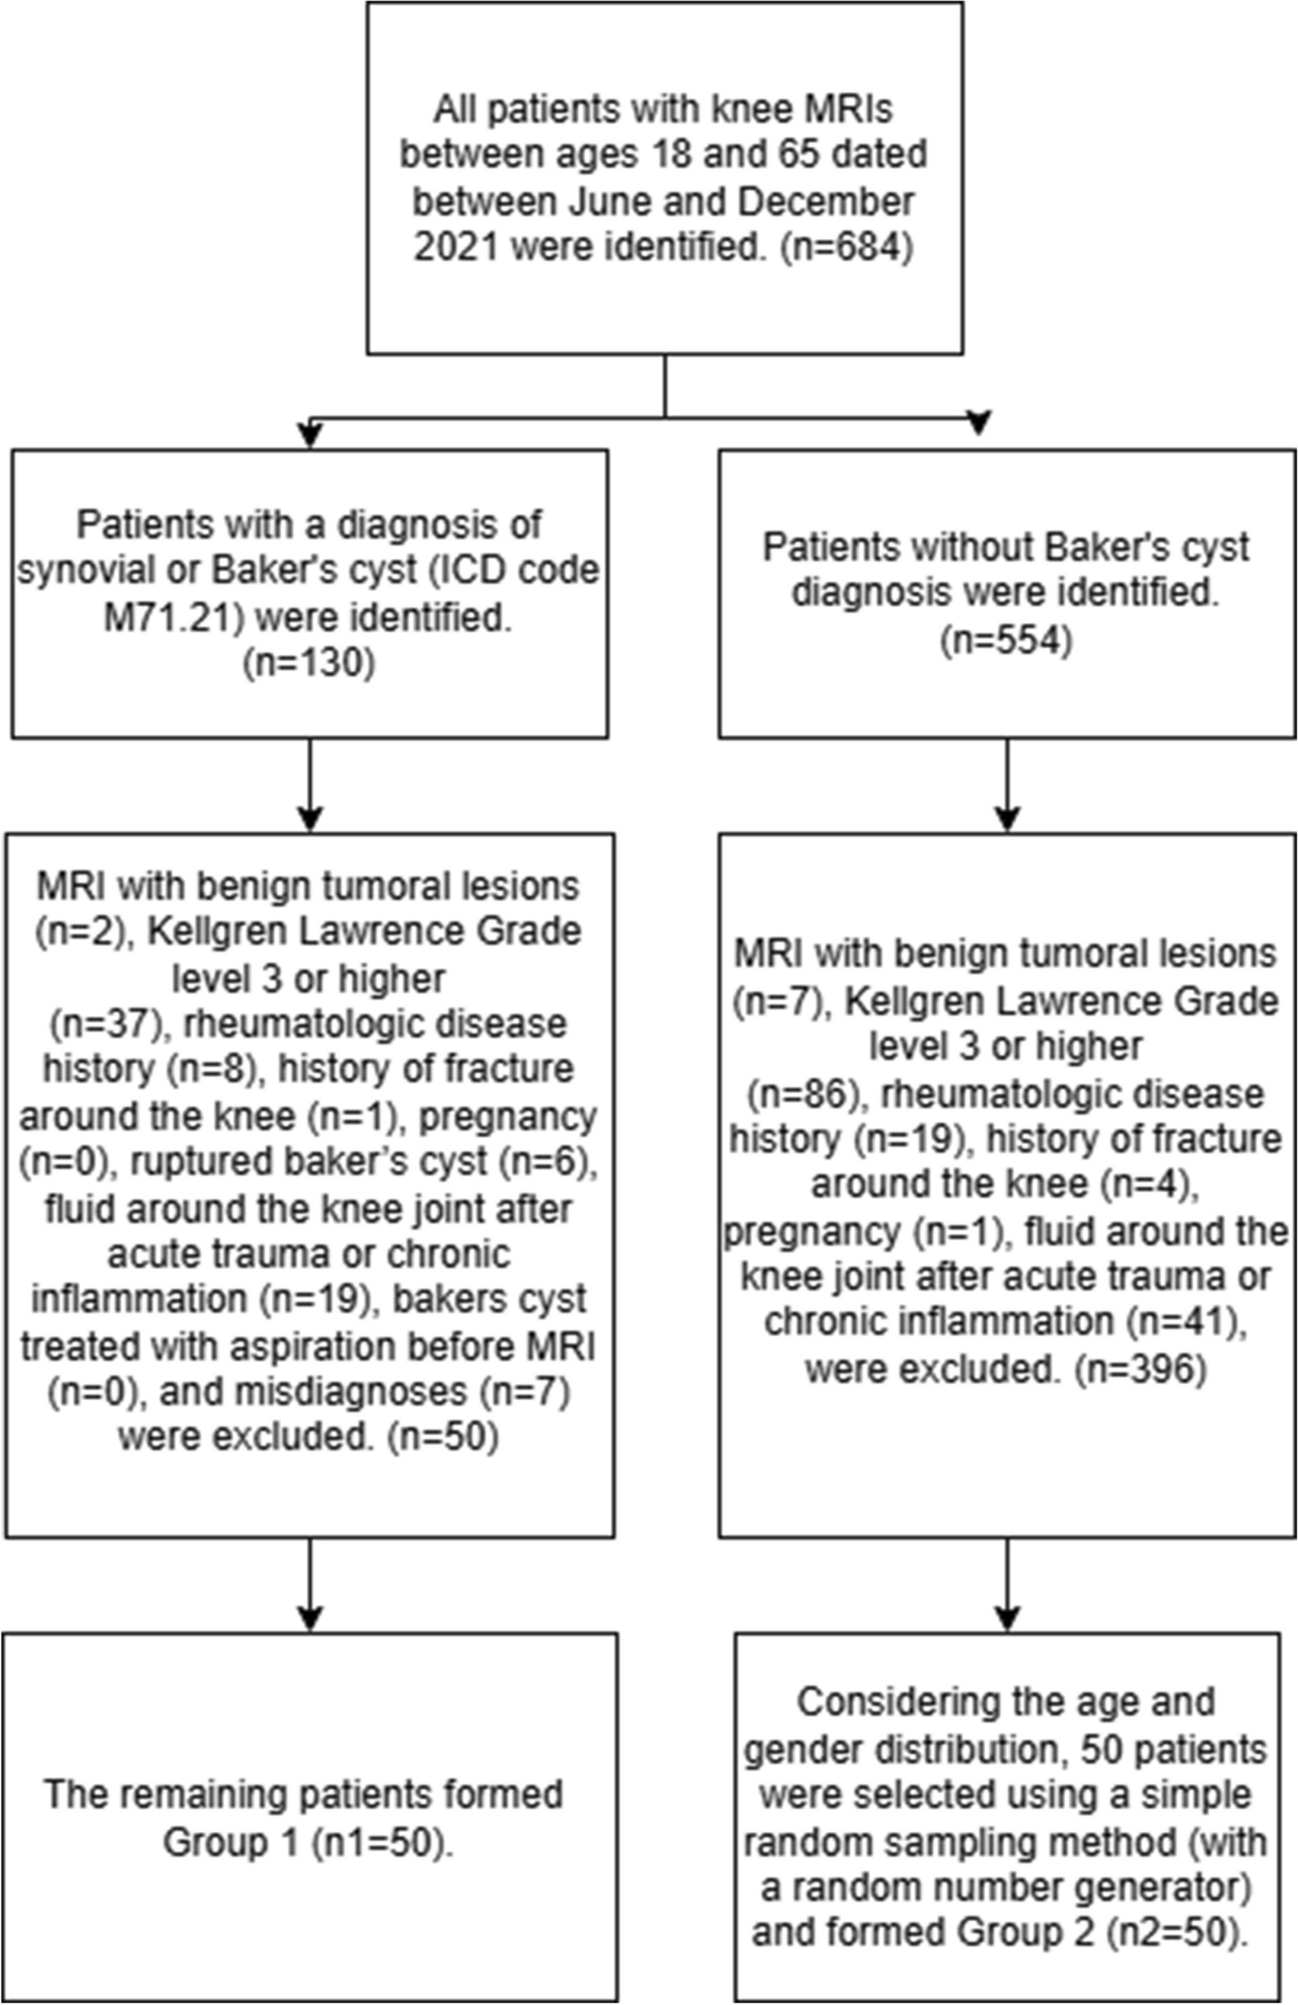
PatientsFor retrospective identification of the patient cohorts, the institutional radiation monitoring system (EasyDose-QM, version 1.8.131, BMS) was searched for patients who underwent clinically indicated CT scans of the pelvis, knee, or ankle on a single CT scanner (SOMATOM Definition AS/AS + , Siemens Healthineers) before January 2020 (without tin filter) and after December 2020 (with tin filter). Only patients who provided written informed consent were included in the study. Patients with metal implants in the scan area and patients under the age of 18 years were excluded. In total, 300 examinations from 288 patients were included. For each joint (hip, knee, ankle), 50 examinations with tin-prefiltration and 50 examinations without tin-prefiltration were selected (Fig. 1). Patient characteristics such as age, body mass index (BMI), and gender were extracted from the picture archiving and communication system (Merlin, Phoenix-PACS) and the electronic patient records.
Fig. 1
Schematic overview of the 300 evaluated examinations. For each scan location, 100 CT scans were included, equally partitioned into 50 examinations with tin filter and 50 examinations without tin filter
CT examinationsAll images were acquired in the clinical setting and conducted using the standard clinical protocol in the corresponding period. All examinations were performed on the same CT scanner (SOMATOM Definition AS/AS + , Siemens Healthineers) before and after installation of the tin filter. All patients were imaged in a supine position. The pelvis, knee, and ankle examinations were checked within the PACS for metal implants in the scan region. If present, the examinations were excluded to allow a better comparison between the groups. For every single scan, radiation dose parameters CTDIvol, DLP, and effective dose, as well as the acquisition parameters kV, mAs/rotation, collimation, pitch factor, and scan length, were extracted from EasyDose-QM and PACS. For better comparison of qualitative and quantitative image analysis, only images reconstructed with the same convolution kernel, slice thickness, and iterative reconstruction strength were evaluated. Four scans with differing reconstruction parameters were excluded from qualitative and quantitative image analysis, one examination reconstructed with BR38 in the conventional group in the knee, and three examinations reconstructed with BR51 in the tin-prefiltered group in the knee. The CT acquisition and reconstruction parameters are listed in the expanded Table 1.
Table 1 CT acquisition and reconstruction parametersQuantitative analysis of radiation dose parameters and patient characteristicsAll CTDIvol estimates were computed by the scanner using the 32 cm IEC Body Dosimetry Phantom as reference. The effective dose displayed in EasyDose-QM was calculated by the integrated software VirtualDose™CT (Virtual Phantoms Inc.). The percentage difference in median CTDIvol, DLP, and effective dose between tin-prefiltered and conventional scans was computed. Tin-prefiltered and conventional scans were compared for each location regarding CTDIvol, DLP, effective dose, and scan length using the Mann–Whitney U test. The body mass index (BMI) was computed manually based on the extracted patient’s height and weight. Patient characteristics such as age and BMI were compared using the Mann–Whitney U or the t-test. Patients’ gender was compared using the Chi-square test.
Qualitative image analysisTwo musculoskeletal radiologists (T.M. with 4 years of experience and G.W. K with 8 years of experience) rated conventional and tin-prefiltered CT images on a PACS workstation and were blinded to each other. Images were anonymized and presented in random order. No washout period was necessary as no patient received a conventional and a tin-prefiltered CT of the same body region. Observers used axial, sagittal, and coronal images with the images being displayed in the bone window and additionally in the soft tissue window for evaluation of soft tissue structures. Readers were blinded to clinical information and imaging results. The following features were rated on a 4-point Likert scale: depiction of bone anatomy (1 = poor, 2 = fair, 3 = moderate, 4 = good), depiction of soft tissue (1 = poor, 2 = fair, 3 = moderate, 4 = good), image noise (1 = very high, 2 = high, 3 = moderate, 4 = minimal), image artifacts (1 = very strong, 2 = strong, 3 = weak, 4 = none), and diagnostic image quality (1 = poor, 2 = fair, 3 = moderate, 4 = good). For each reader, scores for each qualitative feature were compared between conventional CT and tin-prefiltered CT examinations using the Mann–Whitney U test. Interreader agreement for the qualitative measures was assessed using weighted kappa coefficients.
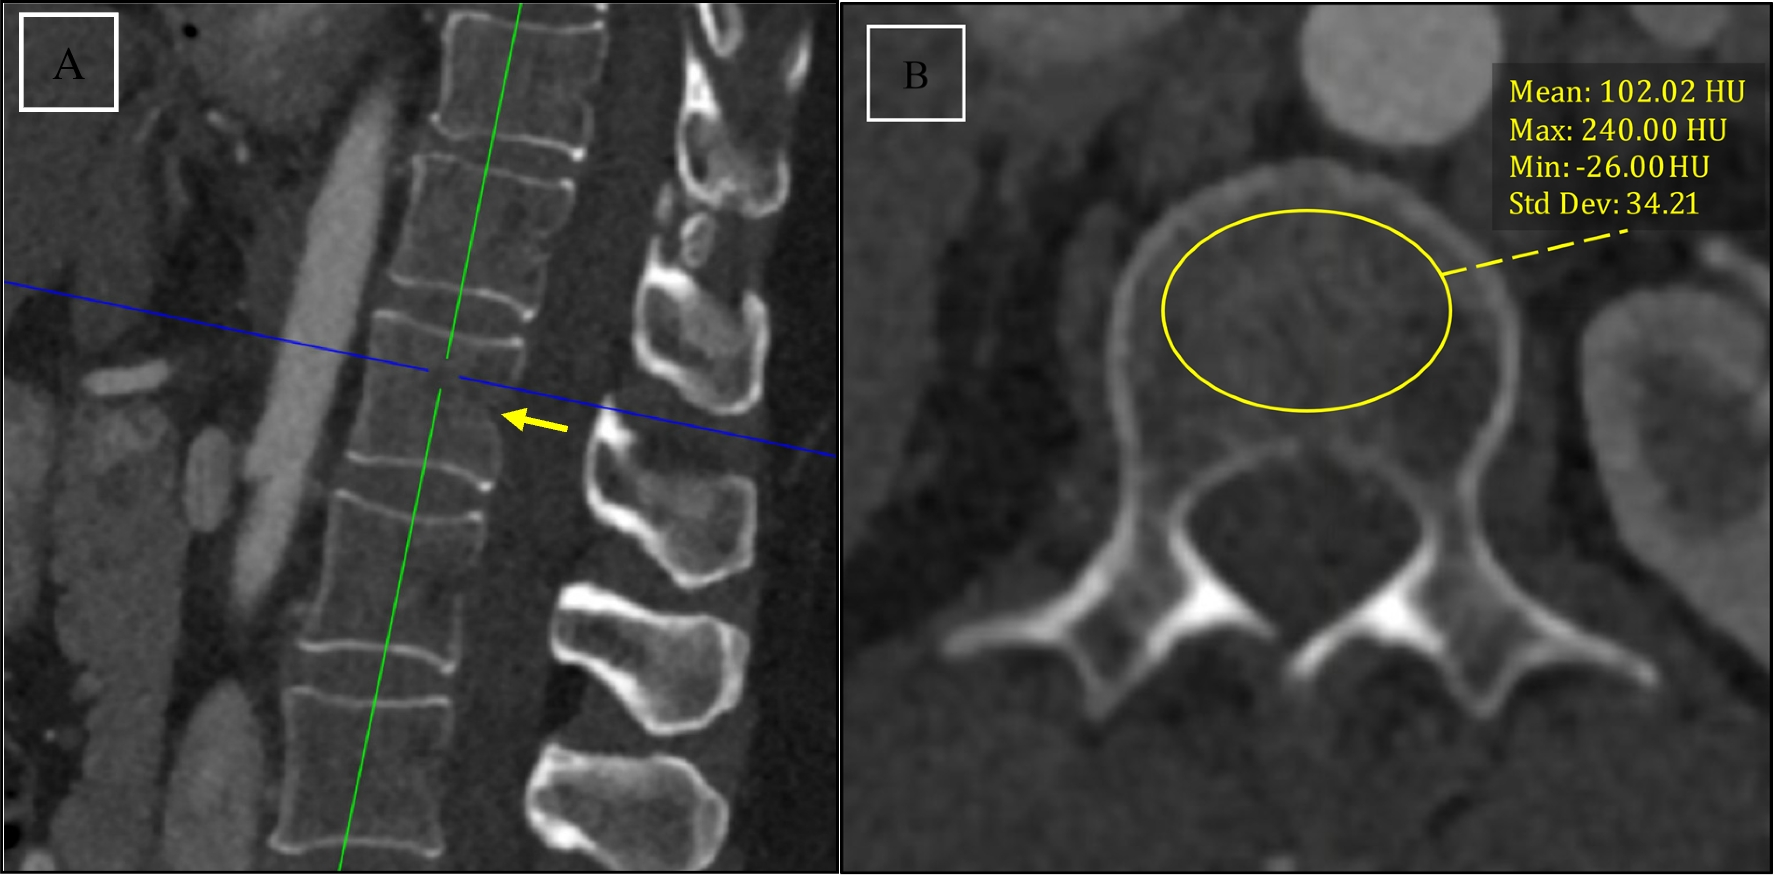
Quantitative image analysisFor objective image assessment, CT values (HU) and standard deviation (SD) of the cortical bone, the muscle, and the subcutaneous fat were evaluated by drawing standardized regions of interest (ROIs) of equal size (10 mm2) in nearly identical anatomical locations using anatomical landmarks. Assessment was conducted on axial slice images with a slice thickness of 1 mm in the pelvis, 1 mm in the knee, and 0.6 mm in the ankle. For the cortical bone, ROIs were placed in the cortical bone of the proximal femur (pelvis), the distal femur (knee), and the distal tibia (ankle). For the muscle, ROIs were placed in the gluteus medius muscle (pelvis), the vastus medialis muscle (knee), and the tibialis anterior muscle (ankle). For subcutaneous fat, ROIs were placed in the subcutaneous fat of the lower abdominal wall (pelvis), the anterior subcutaneous fat of the distal femur (knee), and the anterior subcutaneous fat of the distal tibia (ankle). Image noise was defined as the SD of the CT attenuation in the air [10, 14] measured by standardized ROIs of 10 mm2 outside the body, anterior to the pelvis wall (pelvis), anterior to the knee (knee), and medial to the distal tibia (ankle). Signal-to-noise ratio (SNR) and contrast-to-noise ratio (CNR) were calculated for cortical bone, muscle, and subcutaneous fat for conventional CT and tin-prefiltered CT. The following equations were used: SNRtissue = (HUmean_tissue/SDbackground_air); CNRtissue1 – tissue2 = (HUmean_tissue1- HUmean_tissue2/SDtissue1). Quantitative measurements were compared between conventional CT and tin-prefiltered CT examinations using the Mann–Whitney U test.
Statistical analysisContinuous variables were assessed for normal distribution with the Shapiro–Wilk test and for homogeneity of variances with the Levene test. If distributed normally, continuous data are presented as mean with standard deviation (SD). Continuous data with non-normal distribution are reported as median with 25th percentile (Q1) and 75th percentile (Q3). Comparisons were considered statistically significant at an alpha level of less than 0.05. Weighted kappa was categorized according to the system of Landis and Koch [17]: less than 0.200, slight agreement; 0.200–0.399, fair; 0.400–0.599, moderate; 0.600–0.799, substantial; and 0.800 or greater, almost perfect. All statistical analyses were performed using SPSS Statistics (version 29, IBM).
Comments (0)