
Remember me


The initial search in Pubmed, Google Scholar, and Cochrane library identified 339 studies. Based on the abstracts, 326 studies were excluded. The remaining 13 studies underwent a detailed review. Of these, 10 studies were excluded due to lack of OS data stratified by EoR in line with RANO classes. After a thorough analysis, 3 investigations were included in the meta-analysis (see Fig. 1).
Fig. 1
PRISMA flowchart for study selection
Tropeano et al. [11], a single-center retrospective study from Italy with 117 patients, reported a median age of 63 years, 65.8% MGMT methylation, and high preoperative Karnofsky Performance Status (KPS, mean 91.6). Bjorland et al. [12], based in Norway, analyzed 235 patients in a population-based cohort with a median age of 62.6 and did not report MGMT methylation rates or KPS. IDH1 status was not routinely tested in this study but younger patients and those with histological features of low-grade glioma were investigated regarding IDH1 mutation and those patients were excluded. Tropeano et al. [11] and Bjorland et al. [12] directly applied the RANO resection classification. Park et al. [13], a multicenter study in Korea and Germany with 1,158 patients, found 40.6% MGMT methylation and a median KPS of 90. This study provided a multifactorial classification stratification system based on volumetric EoR, MGMT promotor methylation, age and KPS. All studies used the Stupp protocol as a standard, though variations in chemotherapy and radiotherapy adherence were noted. The study by Park et al. [13] not directly adapted the RANO classification but their Class 1 patients definitely underwent a complete resection of both CE tumor portions and NCE tumor portions, which implies that they are RANO class 1 (0 cm [3] CE + ≤ 5 cm [3] NCE). Class 2 and 3 patients of these study were not included because there could be also RANO class 1 resected patients among these groups. Therefore, 163 IPD of their Class 1 constitute RANO class 1 patients and 106 of their Class 4 patients have not undergone a RANO class 1 resection. Table 1 summarizes the key characteristics of the included studies.
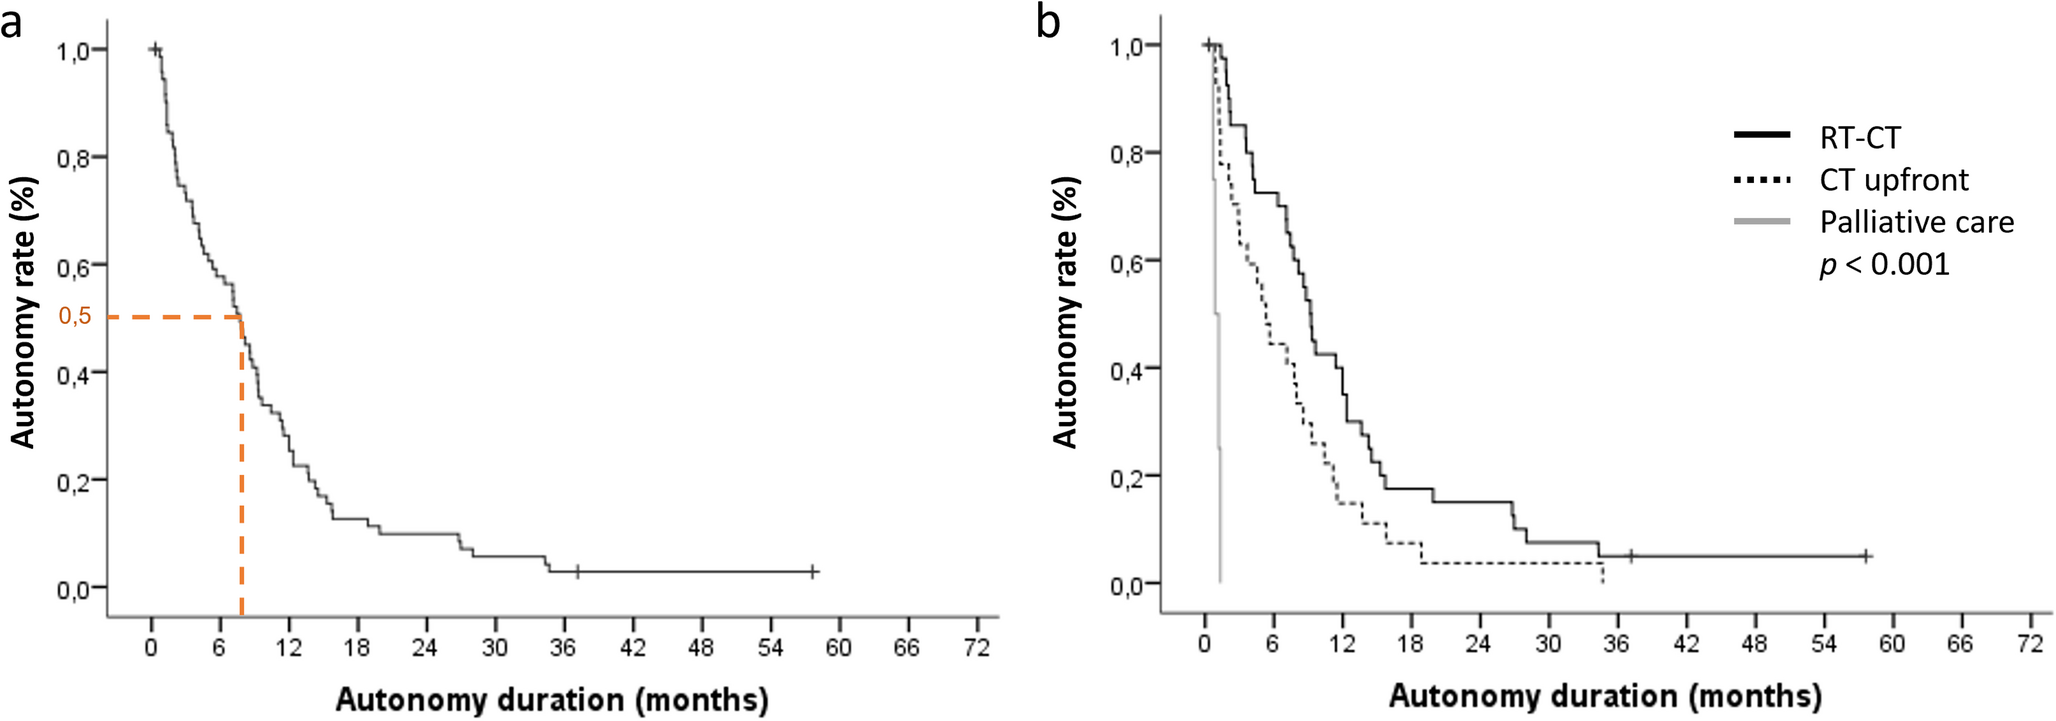
Table 1 Characteristics of the included studiesOverall survival stratified by RANO classesIPD reconstruction of OS data was possible in 580 patients. Median (Interquartile range) follow-up time of the total cohort was 15.6 (10.1–28.8) months. One-hundred-sixty-three patients underwent a supramaximal RANO class 1 resection with a median survival time of 35.6 months (95% CI: 30.9–40.4). The 12-, 18-, and 24-month OS probabilities in RANO class 1 resected GB patients were 92.4%, 83.7%, and 73.0%. The comparison with all other 417 patients who underwent no RANO class 1 (Classes 2a, 2b, 3a, 3b, 4) resection revealed a significant longer OS probability for those who underwent RANO class 1 resections (log-rank test: p < 0.001). The median survival time of those patients classified as RANO classes 2 (a, b), 3 (a, b) or 4 was 13.9 months (95% CI: 13.0-14.7). The 12-, 18-, and 24-month OS probabilities in patients not classified as RANO class 1 resected were 58.5%, 33.3%, and 21.3%. Figure 2a demonstrates the Kaplan-Meier plots illustrating these data. Further comparisons were made between the subgroups within each RANO class (2a, 2b, 3a, 3b, 4). One-hundred-and-eleven patients underwent a RANO class 2a resection with a median survival time of 19.0 months (95% CI: 16.9–21.1). The 12-, 18-, and 24-month OS probabilities in RANO class 2a resected GB patients were 74.2%, 54.7%, and 36.2%. Eighty-four patients underwent a RANO class 2b resection and the median OS time was 14.1 months (95% CI: 12.3–15.9). The OS probabilities at 12, 18, and 24 months for glioblastoma patients who underwent RANO class 2b resection were 59.5%, 27.4%, and 17.9%, respectively. RANO class 3a and 3b resected GB patients had median survival times of 9.8 months (95% CI: 7.1–12.5) and 9.1 months (95% CI: 7.2–10.9), respectively. The overall survival (OS) probabilities at 12, 18, and 24 months were 35.7%, 27.5%, and 19.2%, respectively, for patients who underwent RANO class 3a resections, compared to 29.6%, 11.1%, and 7.4% for those with RANO class 3b resections. Figure 2b demonstrates the OS probabilities of all RANO classes.
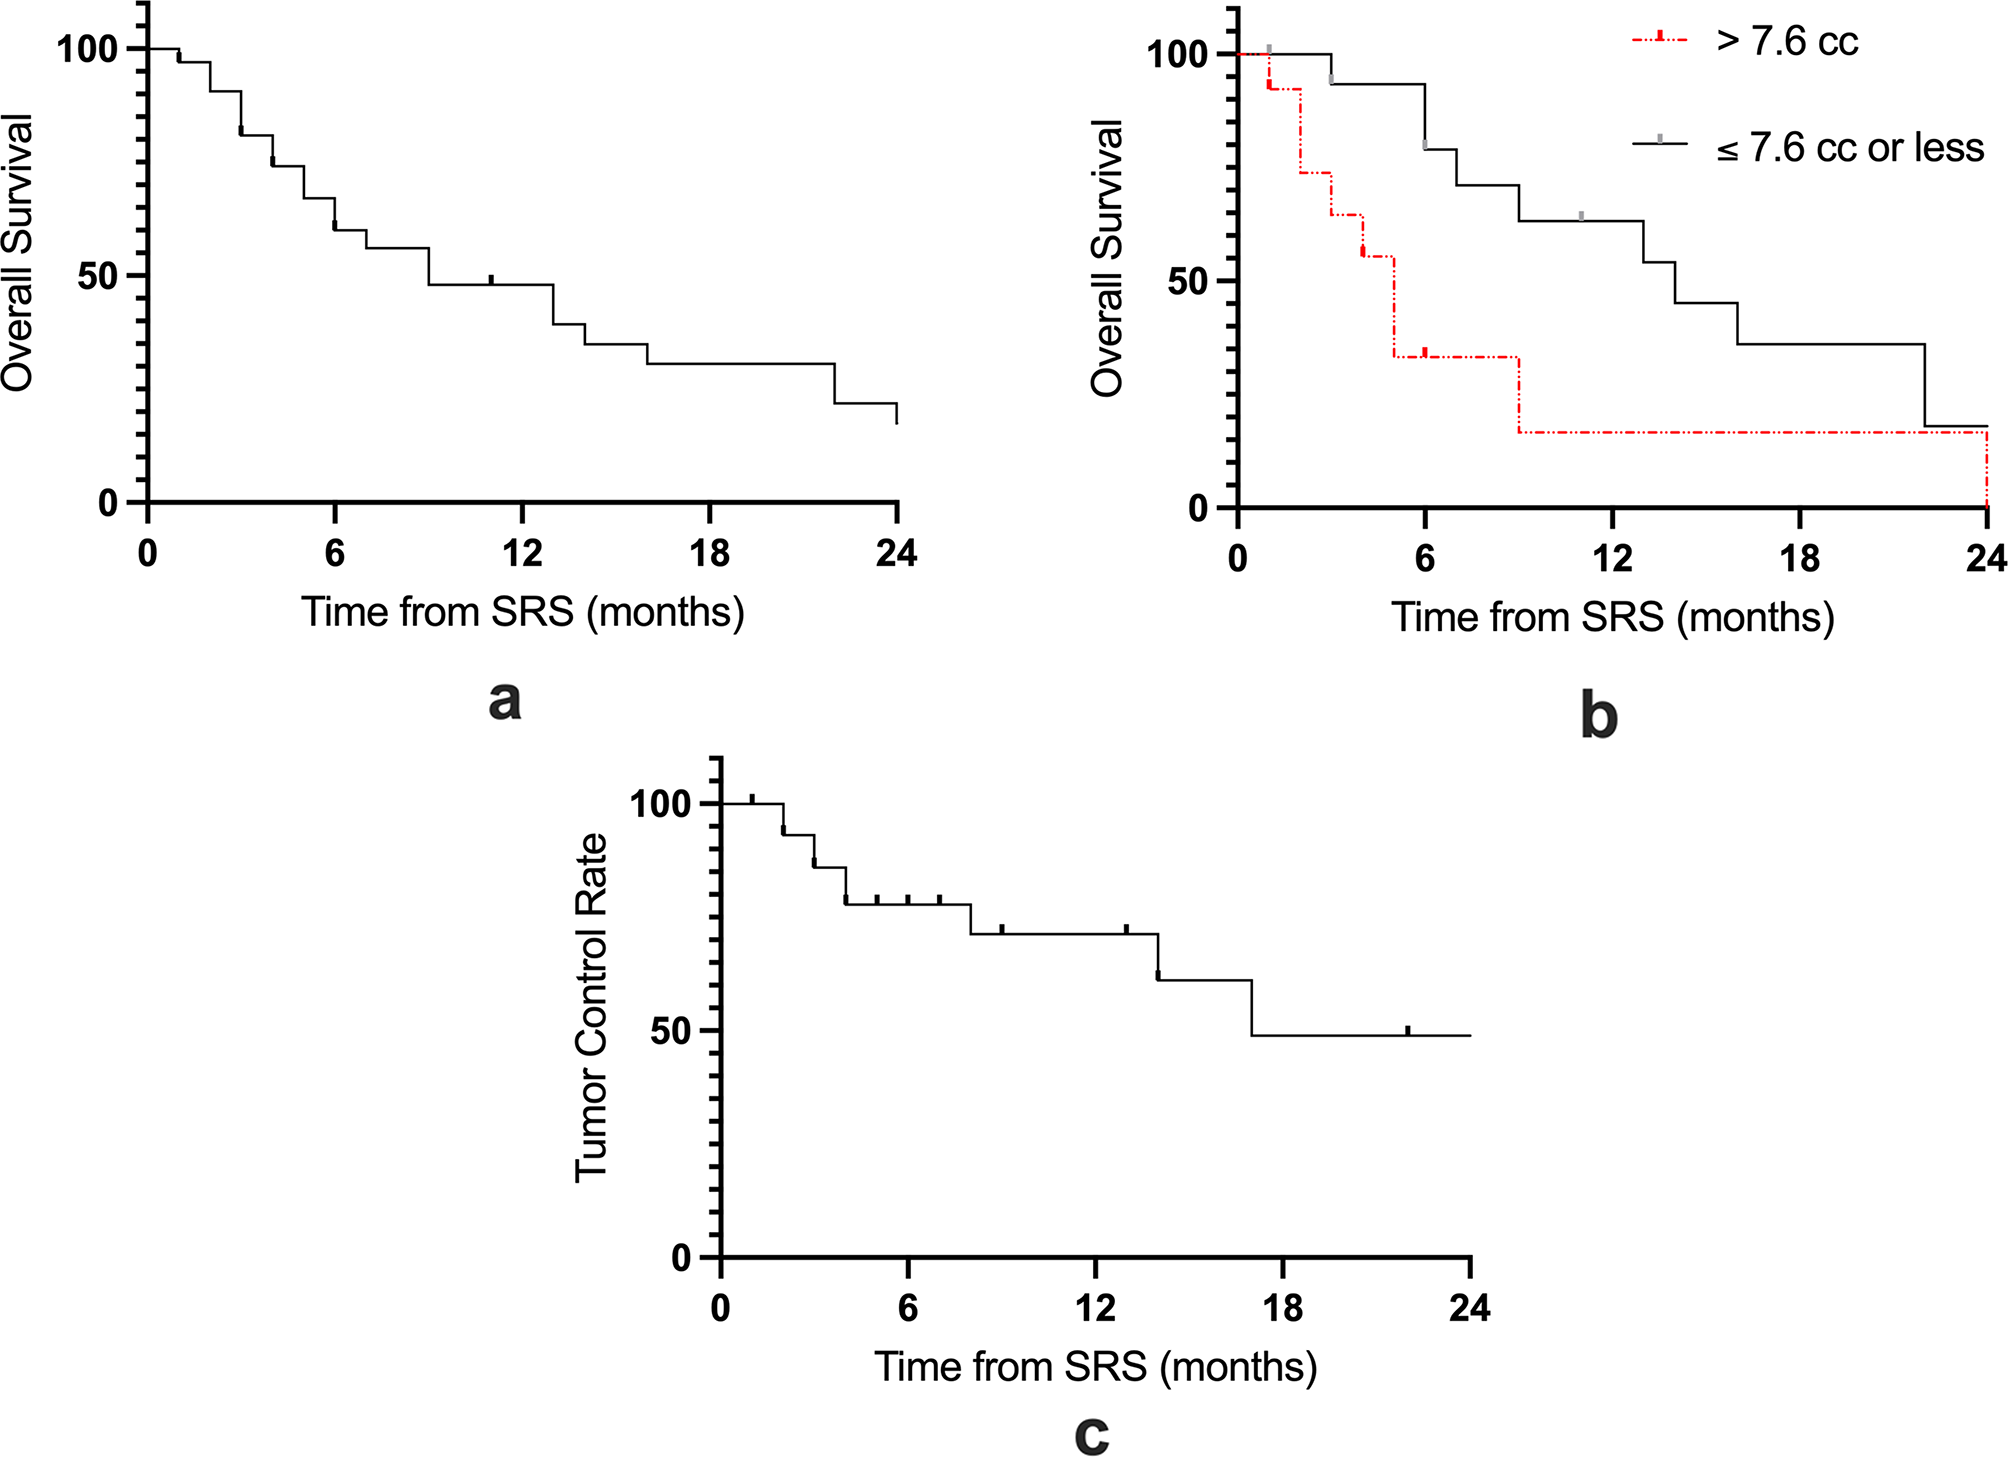
Fig. 2
Kaplan-Meier Survival Curves Stratified by RANO Classes. A: Kaplan-Meier survival curves comparing OS between patients in Class 1 (supramaximal resection) and No Class 1 (other resection classes combined). The log-rank test shows a significant survival advantage for Class 1 (p < 0.001). Shaded areas represent 95% confidence intervals, and the number of patients at risk is displayed below the plot. B: Kaplan-Meier survival curves for OS across six RANO classes: Class 1, Class 2a, Class 2b, Class 3a, Class 3b, and Class 4. The survival probabilities differ significantly between these groups (log-rank test p < 0.001), demonstrating the prognostic value of detailed stratification. Confidence intervals are shaded for each class, and the number of patients at risk over time is listed below the plot. Both panels highlight the critical impact of EOR on survival, with supramaximal resection (Class 1) showing the longest survival
Subgroup analysis of IDH1 wild-type glioblastomasFurther validation of the results was performed with exclusion of the study by Bjorland et al. [12] to ensure that the findings are stringent even in a cohort, which includes only patients who were all routinely tested for IDH1 mutations. The number of patients of RANO class 1 resected group is not altered in this subgroup analysis because the study by Bjorland et al. [12] provided no RANO class 1 data. This subgroup analysis of proven IDH1 wild-type GBs included 345 patients. RANO class 2a resection patients had median survival time of 17.0 months (95% CI: 13.8–20.1) and OS probabilities at 12-, 18-, and 24-month were 71.0%, 41.9%, and 25.8%, respectively. Log-rank test comparing the median OS of RANO class 1 resected IDH1 wild-type GB patients (35.6 months (95% CI: 30.9–40.4)) showed a significant longer OS of these patients compared to RANO class 2a resected GB patients (p < 0.001), too. The median OS probabilities of RANO class 2b resected GB patients was 15.1 months (95% CI: 13.6–16.5). Supplementary Fig. 1 summarizes the results.
Subgroup analysis of each RANO classesUnivariable Cox regression analysis revealed significantly reduced hazards of death for RANO class 1 compared to all other RANO classes. Specifically, RANO class 1 had HRs of 0.43 (95% CI: 0.32–0.57) when compared to class 2a, and similarly favorable comparisons against RANO classes 2b, 3a, 3b, and 4 (p < 0.001 for all comparisons). The strongest survival advantage was observed when comparing class 1 to class 4 (HR: 0.12, 95% CI: 0.07–0.19). Further comparisons among non- RANO class 1 categories were performed and it was found that RANO class 2a was associated with better survival outcomes than class 2b (HR: 0.58, 95% CI: 0.43–0.78, p < 0.001). No significant differences were found between class 2b and 3a, 3a and 3b, or 3b and 4, as their HRs crossed the null line. These results underscore the survival benefits of achieving a supramaximal (class 1) resection. Figure 3 displays Forest plots showing each comparison with RANO class 1 and also the consecutive comparison of RANO resection classes with their neighboring RANO classes.
Fig. 3
Forest Plot of Hazard Ratios Comparing RANO Classes. This figure presents hazard ratios (HRs) with 95% confidence intervals (CIs) for survival outcomes, comparing various RANO resection classes. In the top panel, comparisons are made between Class 1 (supramaximal resection) and other RANO classes, including aggregated Non-Class 1 (HR: 0.28, 95% CI: 0.23–0.37). Hazard ratios consistently favor Class 1, indicating significantly improved survival compared to other classes. Notably, Class 1 shows a stronger survival benefit over Class 3b (HR: 0.12, 95% CI: 0.07–0.19) and Class 4 (HR: 0.17, 95% CI: 0.12–0.24). In the bottom panel, comparisons between intermediate RANO classes are shown. Noteworthy findings include Class 2a outperforming Class 2b (HR: 0.58, 95% CI: 0.43–0.78), suggesting a survival benefit for complete over near-total resection. Differences between other pairs, such as Class 3a vs. Class 3b, do not reach statistical significance. The dashed red vertical line at HR = 1 marks no effect, where hazard ratios to the left favor the first class in each comparison
Bias and quality evaluationThe quality assessment of three retrospective studies—Tropeano et al. [11], 2024, Bjorland et al. [12], 2023, and Park et al. [13], 2024—highlights strengths and limitations in their methodological rigor. All studies clearly stated research objectives, defined their study populations, and achieved participant rates above 50% of eligible cases, ensuring adequate sample representation. They also measured exposures prior to outcomes and provided sufficient follow-up periods to assess survival, a critical outcome in glioblastoma research. However, none of the studies justified their sample sizes, which may affect the robustness of statistical power. Additionally, exposure measurements were well-defined, but they were not reassessed over time, potentially limiting the accuracy of longitudinal data. None of the studies employed blinded outcome assessors, introducing a risk of bias in the results. Despite these limitations, all studies adjusted for key confounders in their statistical analyses, enhancing the reliability of their conclusions regarding the prognostic impact of EOR. Further details are summarized in Fig. 4.
Fig. 4
NIH Quality Assessment of Retrospective Studies. This figure displays the quality assessment of various retrospective studies based on the NIH criteria. Each study is evaluated across several methodological parameters, such as whether the research question was clearly stated, if the study population was well defined, and if sufficient follow-up and confounding adjustments were made. Key categories include: Each study is marked with a “Yes” or “No” based on whether the study meets the criteria. “NA” (Not Applicable) is used when certain criteria do not apply to specific studies
Comments (0)