
Remember me

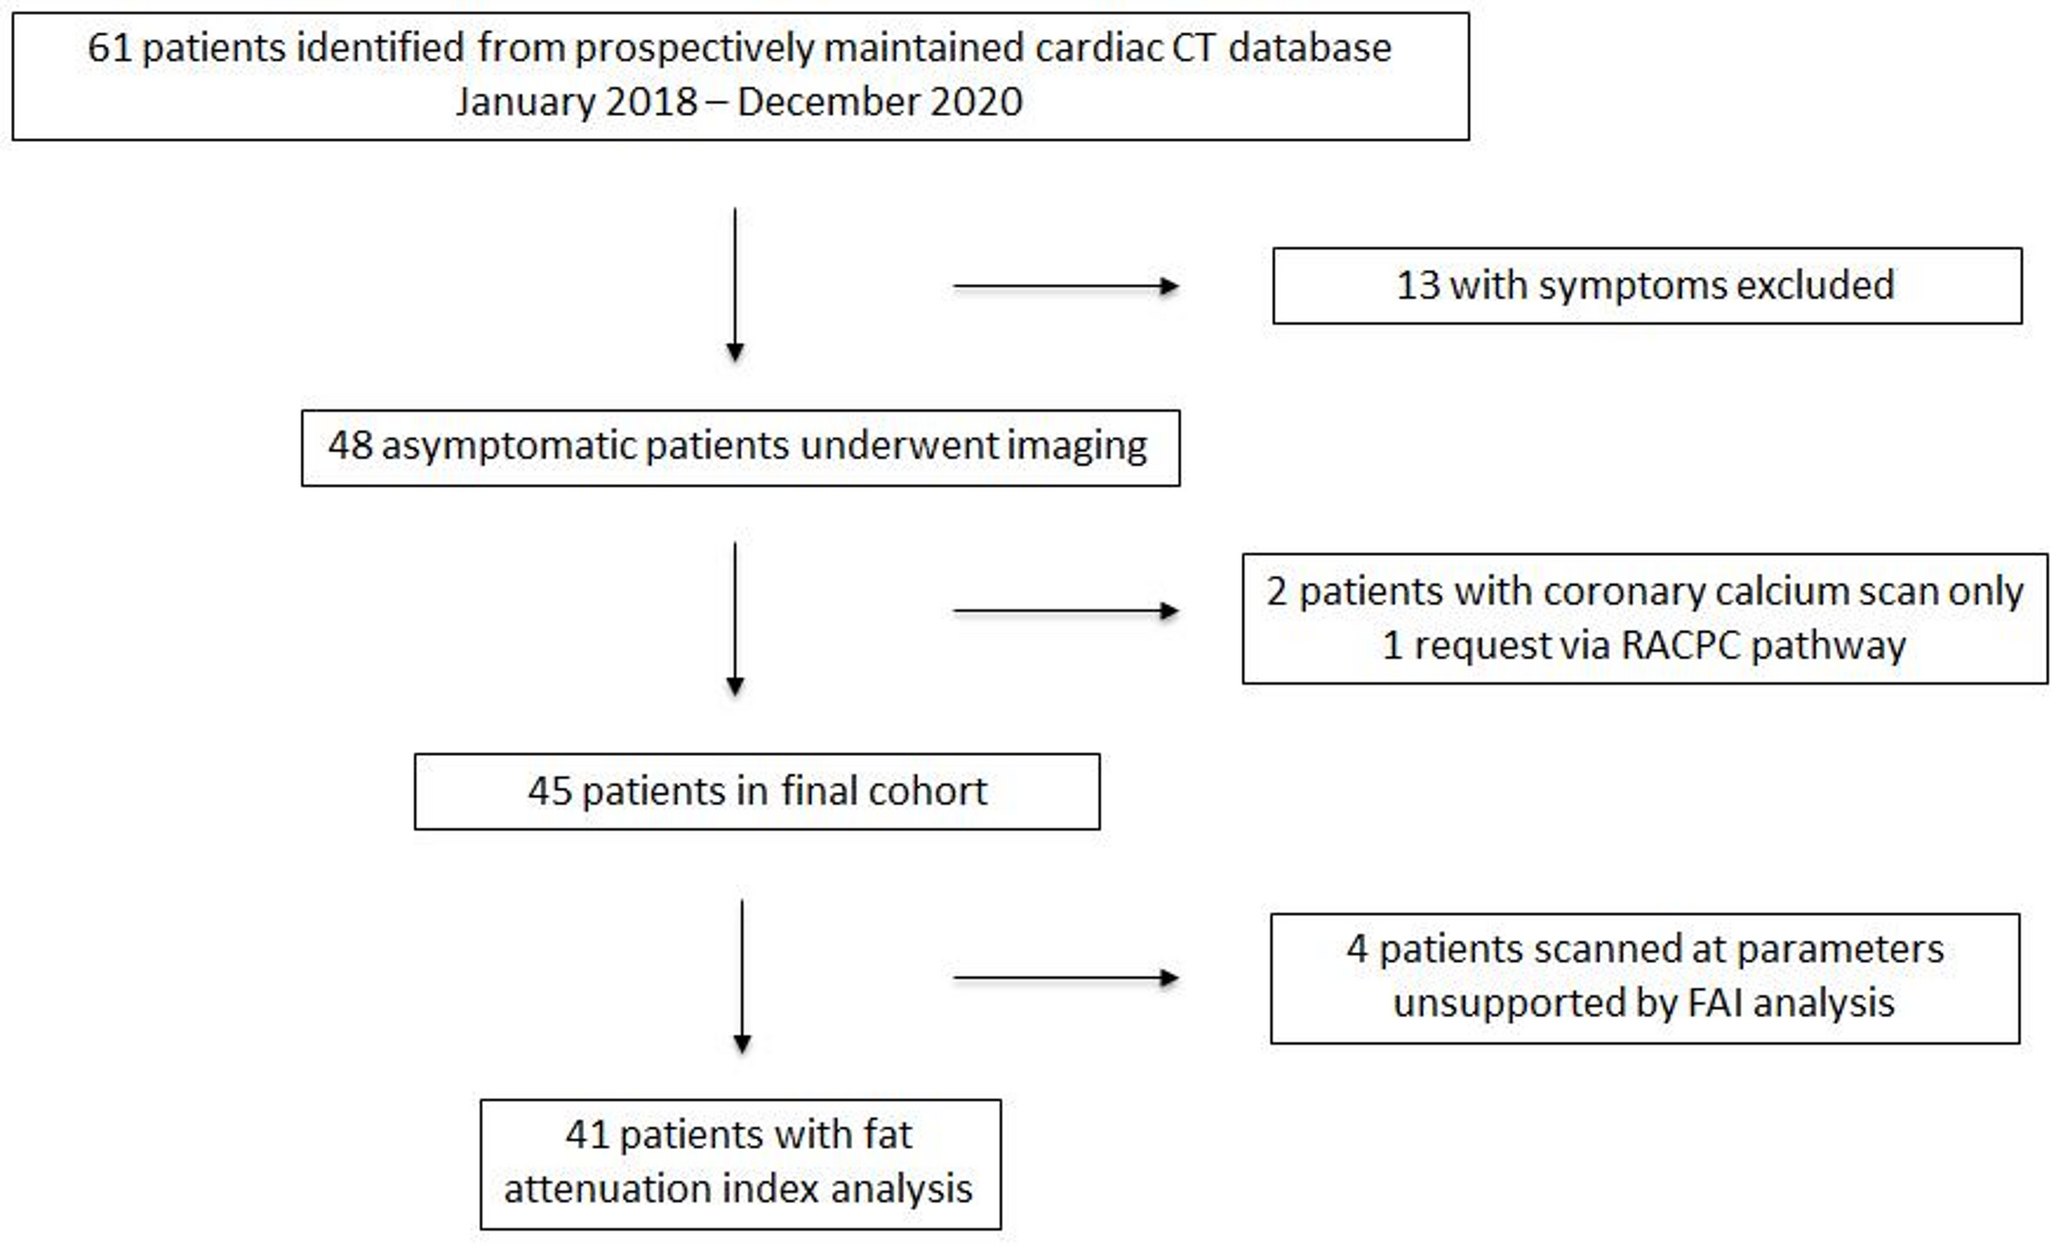

A total of 247 patients with AF were enrolled. After exclusion, 195 patients were included in the study (Fig. 3), with a median age of 64.0 (54.0, 70.0) years and 132 (67.69%) males. Among them, 20 patients failed to undergo TEE and adopted TTE as an alternative to perform 2D-STE due to advanced age, cardiac insufficiency, or resistance to invasive examination, thus these patients lacked LAA echocardiographic parameters. According to the Utah classification, 52 (27%) patients were stage I, 40 (21%) were stage II, 44 (22%) were stage III, and 59 (30%) were stage IV. In this study, we defined Utah stage I and II as the mild LAF group and III and IV as the severe LAF group, since the latter had a higher likelihood of AF recurrence and a worse prognosis after ablation [5, 6]. The baseline characteristics and echocardiographic parameters of both groups are shown in Table 1. Compared to mild LAF, patients with severe LAF had higher age (66.0 y versus 60.0 y), uric acid levels (380.65 µmol/l versus 325.43 µmol/l), CHA2DS2-VA score (2.04 versus 1.32) and HAS-BLED score (1.48 versus 1.05). Persistent atrial fibrillation (PeAF) (92% versus 40%) and heart failure (21% versus 2%) were more common in patients with severe LAF. In terms of echocardiographic parameters, patients with severe LAF had higher values of parameters such as LASI, LAD, LAV, LAVI, LAA-D, LAA-L and E/e’, and lower values such as LVEF, LAA-PEV, LAA-EF, LASr, LAScd, LASct, PALS and pLASRr, P < 0.05.
Fig. 3
Patient selection flowchart. AF: atrial fibrillation; LGE-CMR: late gadolinium enhanced cardiac magnetic resonance; 2D-STE: two-dimensional speckle tracking echocardiography
Table 1 Baseline characteristics and echocardiographic parameters of mild and severe left atrial fibrosis patients with atrial fibrillationComparison between controls and AF patients93 healthy individuals were collected as controls for echocardiographic parameters. The median age was 35.0 (27.0, 46.0) years. Comparison of echocardiographic parameters between healthy controls and patients with AF is presented in Table 2. Of the 195 patients with AF, 68% were PeAF. Compared to paroxysmal atrial fibrillation (PAF), patients with PeAF had higher age (65.5 y versus 56.0 y), and severe LAF (72% versus 13%) was more common in patients with PeAF. As for echocardiographic parameters, PeAF patients had higher values of echocardiographic parameters such as LASI, LAD, LAV, LAVI, LAA-D, LAA-L and E/e’, and lower values of parameters such as LVEF, LAA-PEV, LAA-EF, LASr, LAScd, LASct, PALS, and pLASRr, P < 0.05. In addition, patients with AF had higher LASI, LAD, LAV and LAVI, and lower LVEF, LASr, LASct, LAScd, PALS and pLASRr compared to healthy controls, P < 0.05. Comparison of LAA parameters between controls and AF patients was lacking because healthy individuals only underwent TTE to perform 2D-STE.
Table 2 Echocardiographic parameters in controls and patients with atrial fibrillationFactors associated with LAF degreeThe 195 patients with AF were randomly split into training and testing cohorts in a ratio of 7 to 3. The baseline characteristics of the training and testing cohorts are shown in the Supplement, all characteristics were balanced between the two cohorts and demonstrated no statistical differences (P ≥ 0.05). Univariate logistic regression analysis was conducted on all collected variables and 22 significant variables were obtained with P < 0.05. Further multivariate logistic regression analysis was performed on the above variables, and 7 independent predictors for diagnosing of LAF degree were ultimately determined (Table 3), namely age (OR 0.90, 95%CI 0.83–0.99, P = 0.021), CHA2DS2-VA score (OR 2.00, 95%CI 1.08–3.70, P = 0.027), LAA-EF (OR 0.89, 95%CI 0.80–0.99, P = 0.035), PALS (OR 1.38, 95%CI 1.09–1.76, P = 0.008), LASI (OR 25.45, 95%CI 4.13–156.68, P < 0.001), LASct (OR 0.69, 95%CI 0.52–0.93, P = 0.013) and LAScd (OR 0.67, 95%CI 0.50–0.90, P = 0.007). Based on the results of multivariate logistic regression, the predictive model was fitted and a nomogram for severe LAF degree diagnosis was generated (Fig. 4). The nomogram demonstrated an excellent ability to diagnose severe LAF in patients with AF by plotting the ROC curves (Fig. 5A and B), with an AUC of 0.90 in the testing cohorts (95% CI, 0.81–0.99). The optimal cut-off point was ≥72, and the sensitivity and specificity of diagnosis were 87% and 73%, respectively. Furthermore, the calibration curves showed ideal agreement between the severe LAF degree diagnosed based on the nomogram and the actual (Fig. 5C and D). The DCA curves for both training and testing cohorts demonstrated that this nomogram has promising clinical application potential (Fig. 5E and F), and a clear net clinical benefit can be achieved by using this model to assist clinical decision-making.
Table 3 Univariate and multivariate logistic regression for the risk factors of severe left atrial fibrosisFig. 4
The nomogram prediction model for severe left atrial fibrosis. LAA-EF: left atrial appendage emptying fraction; PALS: peak atrial longitudinal strain; LASI: left atrial stiffness index; LASct: left atrial strain during contraction phase; LAScd: left atrial strain during conduit phase
Fig. 5
(A, B) Receiver operating characteristic curves of the nomogram for severe left atrial fibrosis in the training and validation cohorts. (C, D) Calibration plots of the nomogram for severe left atrial fibrosis in the training and validation cohorts. (E, F) Decision curve analysis of the nomogram for severe left atrial fibrosis in the training and validation cohorts
Factors associated with LAATLAAT group in this study included not only patients with definite thrombus in the LAA but also those with grade 4 or higher SEC, as both had a higher risk of thromboembolism. Of the 175 patients with AF who underwent TEE, 27 had LAAT, with a 15% incidence of LAAT. Among the LAAT patients, 26 (96%) were PeAF, 24 (89%) were severe LAF, 1 (4%) was Utah stage I, 2 (7%) were stage II, 7 (26%) were stage III and 17 (63%) were stage IV. Patients with PeAF (χ²=60.12, P < 0.001) and severe LAF (χ²=20.18, P < 0.001) were more likely to develop LAAT. The analysis of intergroup variability of baseline characteristics in patients with and without LAAT is shown in the Supplement. Uric acid levels (409.84 µmol/l versus 341.27 µmol/l), CHA2DS2-VA scores (2.44 versus 1.43) and HAS-BLED scores (1.85 versus 1.18) were higher in patients with LAAT. No significant difference in age and gender distribution among patients with and without LAAT (P ≥ 0.05). For echocardiographic parameters, LAAT patients had relatively high values for LASI, LAD, LAV, LAVI, LAA-D, LAA-L, E/e’, LVDs and LVDd, and relatively low values for LVEF, LAA-PEV, LAA-EF, LASr, LAScd, LASct, PALS and pLASRr, P < 0.05. After performing univariate and multivariate logistic regression analyses on the variables with significant differences between groups, the following independent predictors of LAAT were obtained (Table 4): CHA2DS2-VA score (OR 3.17, 95%CI 1.35–7.43, P = 0.008), UA (OR 1.02, 95%CI 1.01–1.04, P < 0.001), LAA-EF (OR 0.65, 95%CI 0.48–0.89, P = 0.008), LAA-PEV (OR 0.01, 95%CI 0–0.01, P < 0.001) and LASct (OR 0.59, 95%CI 0.36–0.95, P = 0.030). And ROC curves were plotted (Fig. 6A), the AUC of the above parameters was shown in Table 5. However, the diagnostic ability of CHA2DS2-VA score and UA were average, because their AUC < 0.7. The best diagnostic performance was noted for LAA-PEV (AUC 0.92, 95%CI 0.88–0.96, optimal cut-off ≤ 0.485 m/s, sensitivity 93%, specificity 80%). Besides, LASct had the highest diagnostic efficacy among 2D-STE parameters (AUC 0.80, 95%CI 0.73–0.88, optimal cut-off ≤ 2.5%, sensitivity 82%, specificity 67%).
Table 4 Univariate and multivariate logistic regression for the risk factors of left atrial appendage thrombosisTable 5 Receiver operating characteristic curves analysis evaluating the value of the risk factors in predicting left atrial appendage thrombosisFig. 6
(A) Receiver operating characteristic curves for predicting left atrial appendage thrombosis. (B) Receiver operating characteristic curves for predicting atrial fibrillation recurrence after ablation. UA: uric acid; LAA-EF: left atrial appendage emptying fraction; LAA-PEV: left atrial appendage peak blood flow emptying velocity; LASct: left atrial strain during contraction phase; LAA-L: left atrial appendage length; E: early diastolic peak velocity of mitral orifice; e′: average early diastolic peak velocity of mitral annular septal and lateral corners; E/e′: E-to-e′ ratio
Factors associated with AF recurrenceOf the 195 patients with AF, 160 underwent RFA therapy. The mean postoperative follow-up time was 11.0 ± 2.8 months, with 6 patients lost to follow-up and 2 patients whose total follow-up time was less than 6 months. Finally, 152 patients completed the follow-up and 28 patients occurred AF recurrence, with a recurrence rate of 18.4%. Among the AF recurrence patients, 25 (89%) were PeAF, 23 (82%) were severe LAF, 1 (4%) was Utah stage I, 4 (14%) were stage II, 8 (28%) were stage III and 15 (54%) were stage IV. Patients with PeAF (χ²=12.36, P < 0.001) and severe LAF (χ²=18.7, P < 0.001) were more likely to occur AF recurrence. The analysis of intergroup variability of baseline characteristics in patients with and without AF recurrence is shown in the Supplement. Uric acid levels (408.12 µmol/l versus 335.10 µmol/l) were higher in AF recurrence patients. Regarding echocardiographic parameters, AF recurrence patients had relatively high values for LASI, LAD, LAV, LAVI, LAA-D, LAA-L and E/e’, and relatively low values for LVEF, LAA-PEV, LASr, LAScd, LASct, PALS and pLASRr, P < 0.05. After performing univariate and multivariate logistic regression analyses, LAA-L (OR 1.11, 95%CI 1.01–1.23, P = 0.034), E/e’ (OR 1.41, 95%CI 1.12–1.78, P = 0.003) and LASct (OR 0.83, 95%CI 0.70–0.98, P = 0.03) were acquired as the independent predictors of AF recurrence after ablation (Table 6). The ROC curve was then plotted (Fig. 6B), and the AUC of the above parameters was presented in Supplement. The diagnostic power of LAA-L was poor as the AUC < 0.7. In addition, the best diagnostic performance was noted for E/e’ (AUC 0.79, 95%CI 0.72–0.86, optimal cut-off ≥ 10.88, sensitivity 93%, specificity 64%), and LASct had the highest diagnostic efficacy among 2D-STE parameters (AUC 0.75, 95%CI 0.67–0.84, optimal cut-off ≤ 5.5%, sensitivity 89%, specificity 56%).
Table 6 Univariate and multivariate logistic regression for the risk factors of atrial fibrillation recurrence after ablation
Comments (0)