
Remember me

For this exploratory ML-based analysis, we used secondary data from an RCT which was designed and conducted by our research team (blinded). Briefly, we implemented a 16-week multimodal PA intervention in 36 nursing homes in southwestern Germany. The intervention combined PA to train endurance/ cardiorespiratory fitness, muscular strength and balance, as well as cognitively stimulating exercises by utilizing ritualized program sequences. The study was funded by the Dietmar Hopp Foundation. The study was retrospectively registered in the German National Register of Clinical Trials (blinded), and was approved by the Ethics Committee of (blinded). A detailed description of the study methodology can be found in the study protocol [15]. The effects of the multimodal PA intervention on gait, motor/ physical performance and ADL performance using traditional statistical analysis have been published [16,17,18].
Study design and participantsThe multicenter RCT included standardized assessment of cognitive function, motor performance and ADL at baseline and post-intervention. Eligible participants were identified by staff of participating nursing homes. All participants, or their legal guardians, were informed of the content and aims of the study and gave their written consent to participate.
Prior to the study, eligible participants were allocated either to the intervention group (IG) or the control group (CG, also received the PA intervention after completion of the study) using minimization software (MinimPy0.3 [19]). We applied the following inclusion criteria for participation in the study: (1) diagnosis of primary dementia or “suspected dementia” (i.e., without a confirmed clinical diagnosis) verified by a general practitioner and / or based on ICD-10 criteria, (2) Mini Mental State Examination (MMSE) indicating mild to moderate dementia (MMSE: 10–24), (3) age > 65 years, (4) being able to walk for approx. 10 m with or without walking aids, and (5) clearance by a general practitioner. Participants with secondary dementia, other severe cognitive impairments, neurological or other severely acute diseases and / or no informed consent were excluded.
Predictor variables for ML analysisMultimodal PA interventionBriefly, the 16-week multimodal PA intervention consisted of two sessions per week, each lasting approx. 60 min. The exercises took approx. 45 min and consisted of a combination of motor and cognitive tasks. Specifically, the motor tasks focused on muscular strength, balance, endurance/ cardiorespiratory fitness and flexibility, and were performed with varying durations and at moderate to submaximal intensities. Small training devices such as dumbbells, sandbags, skipping ropes or pool noodles were used. In addition, various cognitive tasks were combined with the motor exercises to provide cognitive stimulation such as memory (e.g., “What was the destination of the last imaginary journey?”), attention (e.g., remembering a particular sequence of numbers), language (e.g., naming animals), and executive function (e.g., responding to acoustic or visual cues). During the 16-week intervention, a progression of intensity of both motor and cognitive exercises was implemented, e.g., by increasing the number of repetitions or difficulty level for the motor and cognitive exercises, by following a predefined progression protocol and supervised by experienced instructors. For ML-based analysis, we used adherence to the intervention as predictor variable.
Physical performanceBefore and after the 16-week PA intervention, physical performance was assessed, mainly focusing on ADL, mobility, balance, and lower extremity muscular strength and functionality. For ADL, the Barthel [20] questionnaire and the two task-related tests Physical Performance Test (PPT) [21] and Erlangen Activities of Daily Living (EADL) [22] were administered. Motor performance related to mobility was measured using the Timed-Up and Go Test (TUG) [23] and the 6-m walking test (6MWT) [24]. Balance was assessed using the Balance Score of Frailty and Injuries: Cooperative Studies of Intervention Techniques–4 (FICSIT) [25] and lower extremity muscular strength and functionality using the modified chair stand test (STS_mA_time, time for five repetitions, STS_mA_rep, amount of repetitions during 30 s) [26, 27]. For ML-based analysis, we used the three ADL tests (Barthel, EADL, PPT) and the five variables of physical performance (TUG, 6MWT, FICSIT, STS STS_mA_time, STS_mA_rep) as predictor variables.
Other baseline variablesDemographic variables, i.e., sex and age, as well as type and severity of dementia and number of medications were assessed using questionnaires, and body mass index (BMI, weight and height) was measured. Information on subjective general health status was collected using the Cumulative Illness Rating Scale (CIRS) [28]. For ML-based analysis, we used seven variables (sex, age, BMI, dementia form, dementia severity, medication number, CIRS severity index, and CIRS morbidity index) as predictor variables.
Detailed information on the multimodal PA intervention, as well as administrational assessments as part of the RCT can be found in the study protocol and previous publications on the RCT [15, 17, 18].
Outcomes for ML-based analysisCognitive performance was assessed before (baseline) and after (post) the PA intervention. All tests were standardized and administered under the supervision of trained test assessors.
Screening instrument for Global cognitionWe administered MMSE [29] to screen for global cognition, and used MMSE total score for analysis. The score has a maximum of 30, with higher scores indicate better performance and a score of < 25 indicates further extensive assessment for dementia using cognitive test battery as detailed below.
Cognitive testsSemantic verbal fluency was assessed using the Regensburg Word Fluency Test (RWT_animals) [30], subtest animals. We recorded the number of animals produced correctly per minute, with higher values indicating better performance. Executive function and visual-spatial function was assessed using the Clock Drawing Test (CDT) [31]. Deviations in the drawing were scored according to Shulman [31] from 1 to 6, with lower scores indicating better performance (1 = clock perfect, 2 = mild visuospatial errors, 3 = clock incorrect, 4 = moderate disorganization, 5 = severe visuospatial disorganization, 6 = no representation of the clock). We also used Trial Making Test part A (TMT-A) [32] to assess attention/ executive function and processing speed, with less time required indicating better performance (maximum time: 180 s). Verbal short-term and working memory was assessed using Digit Span forward and backward (DS_for, DS_back) [33], and we used length of highest digits correctly reproduced forwards and backwards for analysis, with higher values indicating better performance. Finally, we administered California Verbal Learning Test (CVLT) [34] to assess episodic verbal learning and memory. For analysis, we used correct repetitions of 16 nouns during long delay free recall, with higher values indicating better performance.
Statistical analysisAll participants who met the inclusion criteria and were randomized to either the IG or CG were included in the dataset used for the ML-based analysis, with the exception of deceased participants. A multiple imputation procedure (fully conditional specification imputation method, ten imputations and ten iterations) was used to account for missing data. Several constraints were defined for multiple imputations, with cognitive performance as both outcome and predictor variable, supplemented by adherence, socio-demographic variables, and motor performance. To ensure the plausibility of the imputed data, other constraints were defined, such as minimum and maximum values according to the observed range in each variable, rounding according to the original data, 100 maximum case draws and ten maximum parameter draws.
The cognitive performance of each individual was classified as decline or non-decline by comparing the baseline values with the values after the 16-week PA intervention. A decrease in cognitive performance was referred to as a decline, a maintenance or an increase as a non-decline. The normal distribution of the data was checked using the Shapiro–Wilk test and corresponding plots. Differences in baseline characteristics between IG and CG and in outcome variables between cognitive decliners and non-decliners of the intention-to-treat sample were compared using t-tests for continuous data and chi2-tests for non-parametric and/or categorical data. Differences in the distribution of cognitive decliners and non-decliners between IG and CG of the intention-to-treat sample were tested using chi2-tests. In addition, time*group effects were calculated using two-factor ANOVA.
For the ML analysis, the cognitive variables (MMSE, RWT_animals, CDT, TMT, DS_for, DS_back, CVLT) were defined as outcome variables and health and demographic variables (sex, age, BMI, dementia form, dementia severity, medication number, CIRS severity index, and CIRS morbidity index), ADL (Barthel, EADL, PPT), and physical performance variables (TUG, 6MWT, FICSIT, STS STS_mA_time, STS_mA_rep) as predictor variables. All predictor variables were included in the ML model. Support Vector Machine (SVM) is one of the most commonly used machine learning models to classify data [35]. An SVM model was used to classify each primary outcome into two classes: (1) Decline, meaning that post-intervention scores were lower than baseline scores, and (2) Non-decline, meaning that post-intervention were equal to or greater than baseline scores. This was not the case for TMT, where less or the same time means no decrease. Therefore, for this variable, the calculation was done in reverse (pre-post) in order to be able to interpret it in the same way. It is known that the choice of hyperparameters used to train an SVM model, such as regularization parameters or kernels, can greatly impact model performance [36]. To tackle this, we use fivefold cross-validation with grid search "GridSearchCV" technique [37] for finding the optimal parameter configuration from a given set of parameters in a grid (see Table 1). Data was split in a ratio of 80:20 for training and held-out testing sets, respectively, while maintaining a similar distribution of samples with decline and non-decline in primary outcomes. GridSearchCV performs a fivefold cross-validation on the training data for hyperparameter optimization. The best set of parameters is selected using the area under the ROC curve (AUC) as a validation metric. Using this optimal set of hyperparameters, we re-train the model on the entire training set and report results on the held-out test set. This entire pipeline with the SVM model and GridSearchCV were run separately for the intervention and control groups. The performance was evaluated using AUC and the trained model's accuracy. The code supporting this study is open-source and available at GitHub [https://github.com/jaygshah/PA-CognitionML].
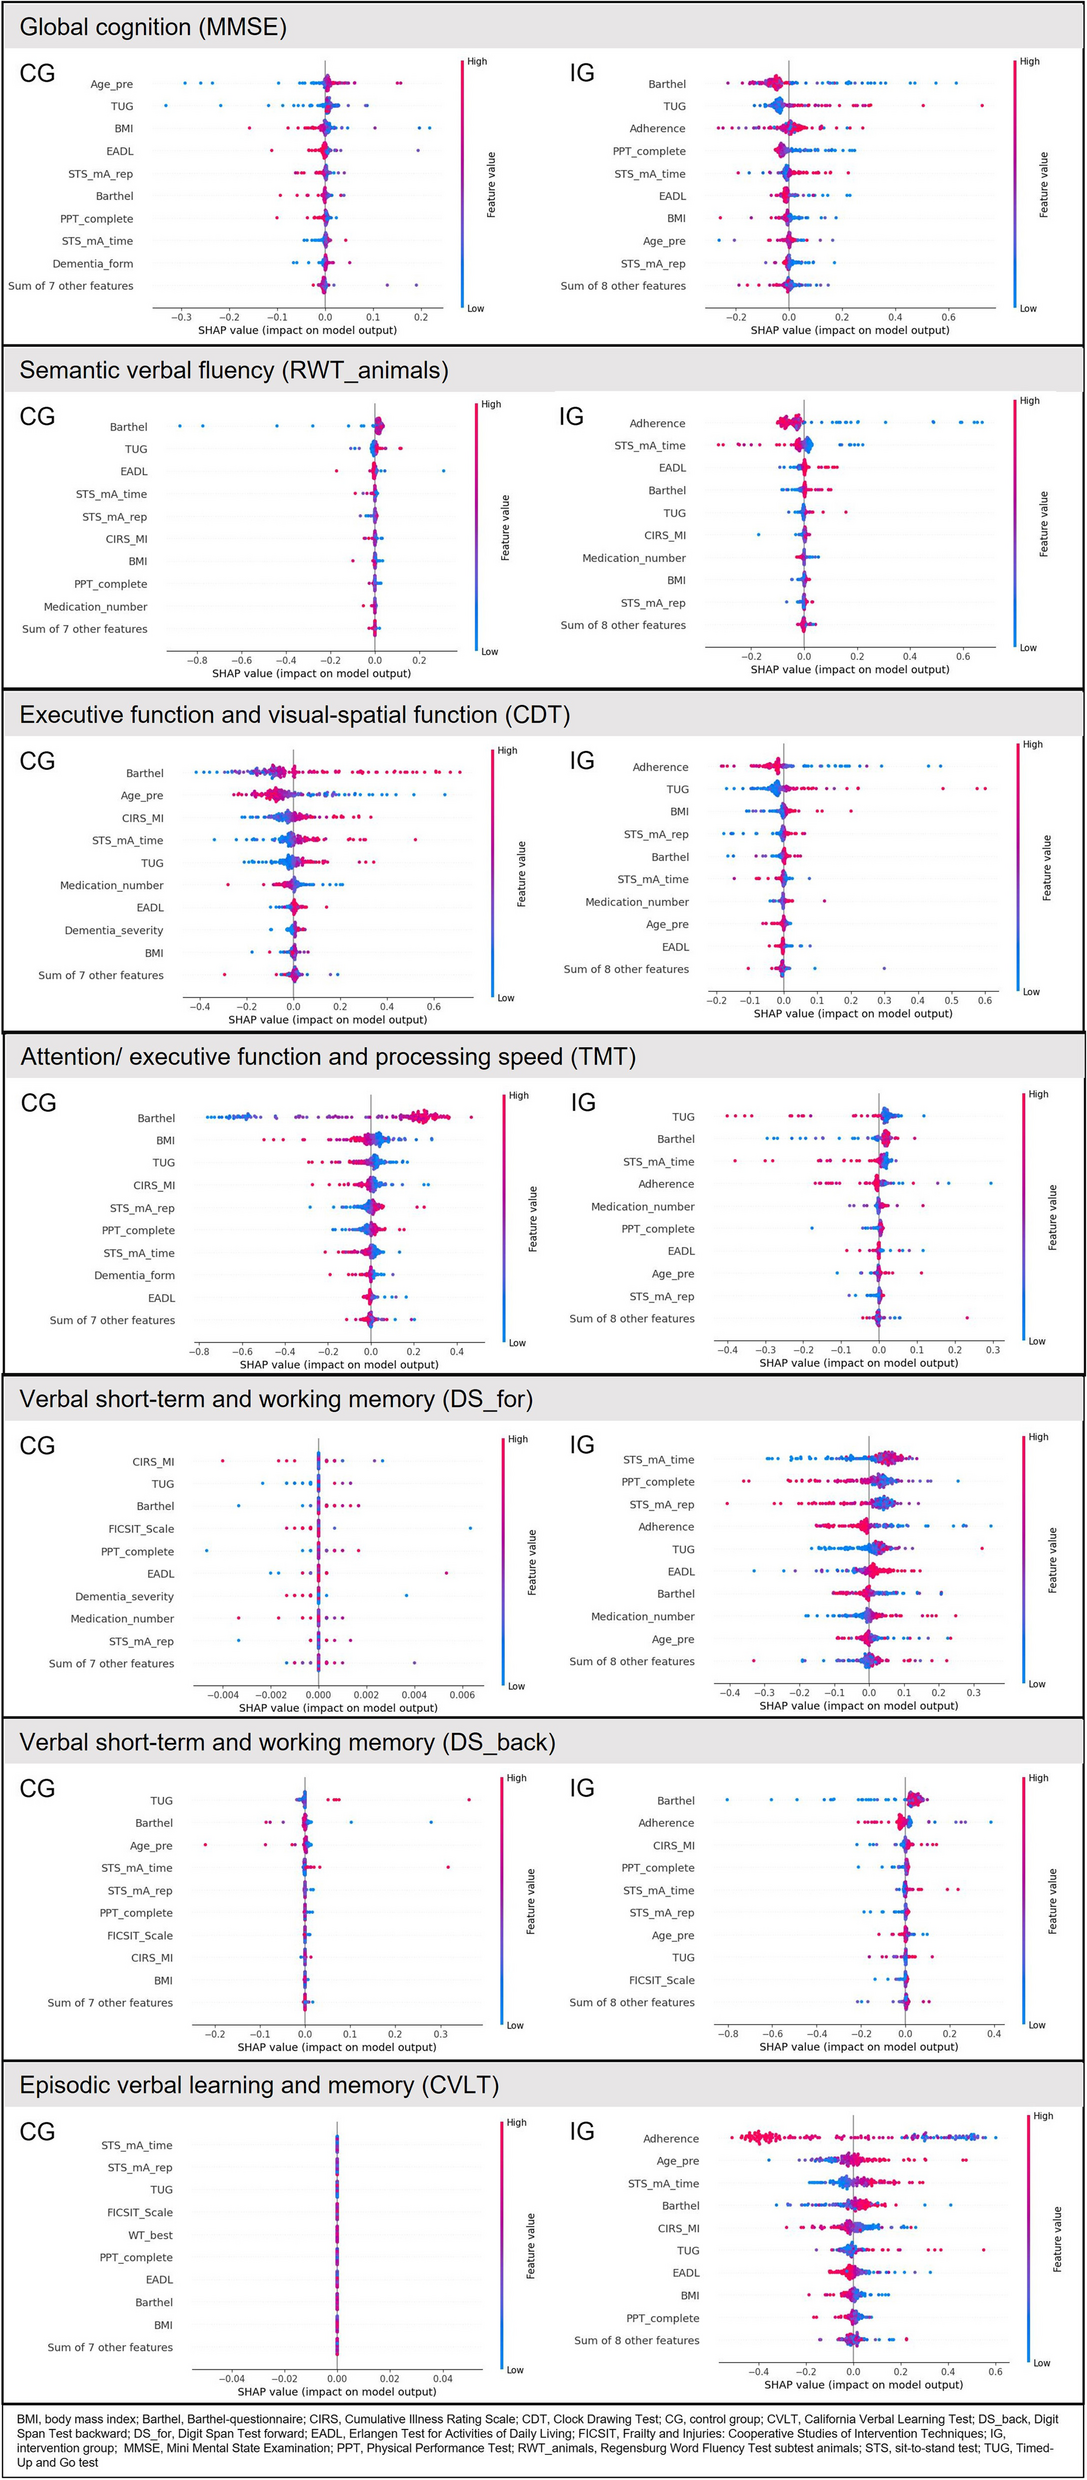
Table 1 Grid of parameters used to find best model fit using support vector machine model and grid search cross-validation techniqueTo further investigate the associations between predictor and outcome variables using the developed SVM model, we used SHapley Additive exPlanations (SHAP). SHAP is a powerful model explainability tool for understanding predictions of complex machine learning algorithms [38]. It deconstructs individual predictions into a sum of contributions from each predictor while considering their relative importance. In this study, we used SHAP’s beeswarm plot (Fig. 1) to interrogate the relative importance of predictors in a prediction and their actual relationships with outcome variables.
Fig. 1
Classification of decline vs. non-decline in the cognitive outcome variables, presented by SHAP plots for CG and IG. Refer to the Statistical Analysis subsection in Methods for information on interpretation of SHAP plots
Interpreting SHAP plot:
1.For each predictor (input variable to the ML model), each dot represents a sample from the dataset spread horizontally along the X-axis. Samples are stacked vertically where the density of SHAP values is high. The bigger the spread, the higher the significance of the predictor in prediction.
2.The feature value color bar on the right displays the raw values of predictors and their impact on model predictions. Examining the trend of predictor variables' high (red) or low (blue) values can help understand their relationship to predicted cognitive trajectory.
3.On the left, predictors (input variables to the ML model) are listed in decreasing order of their importance to model predictions (i.e., their decreasing order of mean absolute SHAP values).
4.In Fig 1, the first plot (left) shows a SHAP plot of model predictions trained using the control group, whereas the second plot (right) shows the intervention group. Samples on the right side of the Y-axis (SHAP value > 0) were predicted as declining, whereas the ones on the left were predicted as non-declining.
Comments (0)