
Remember me
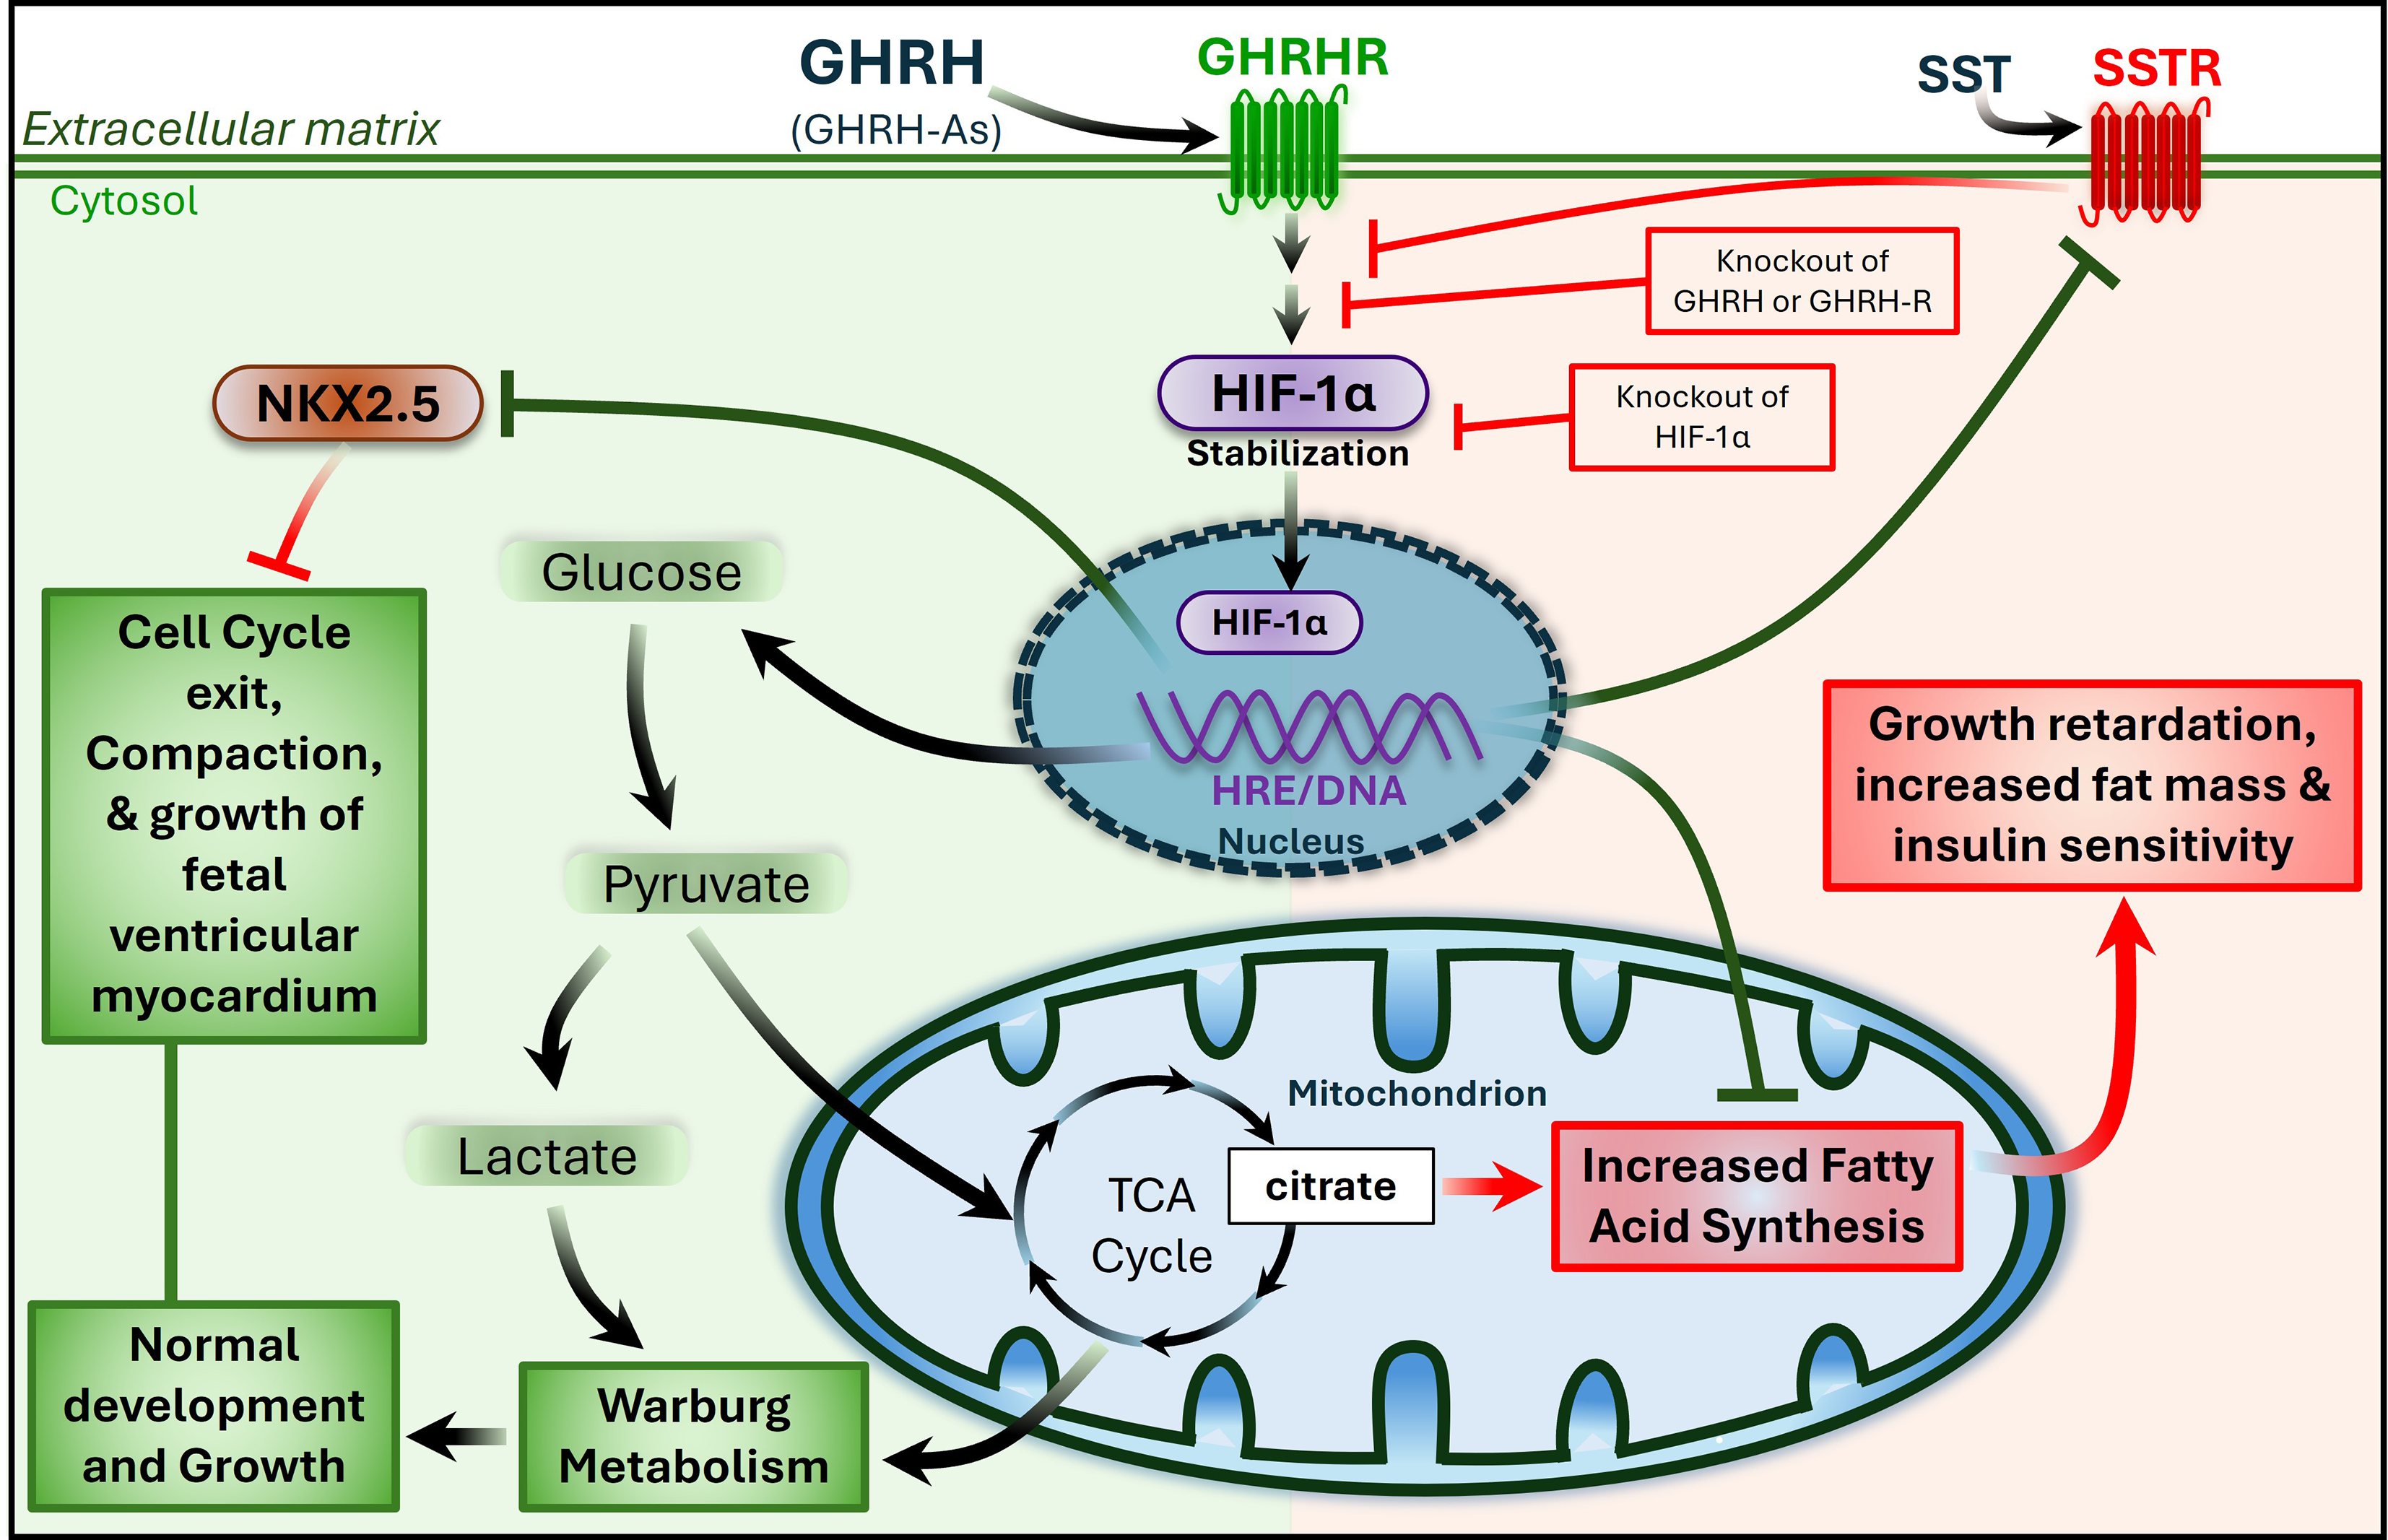

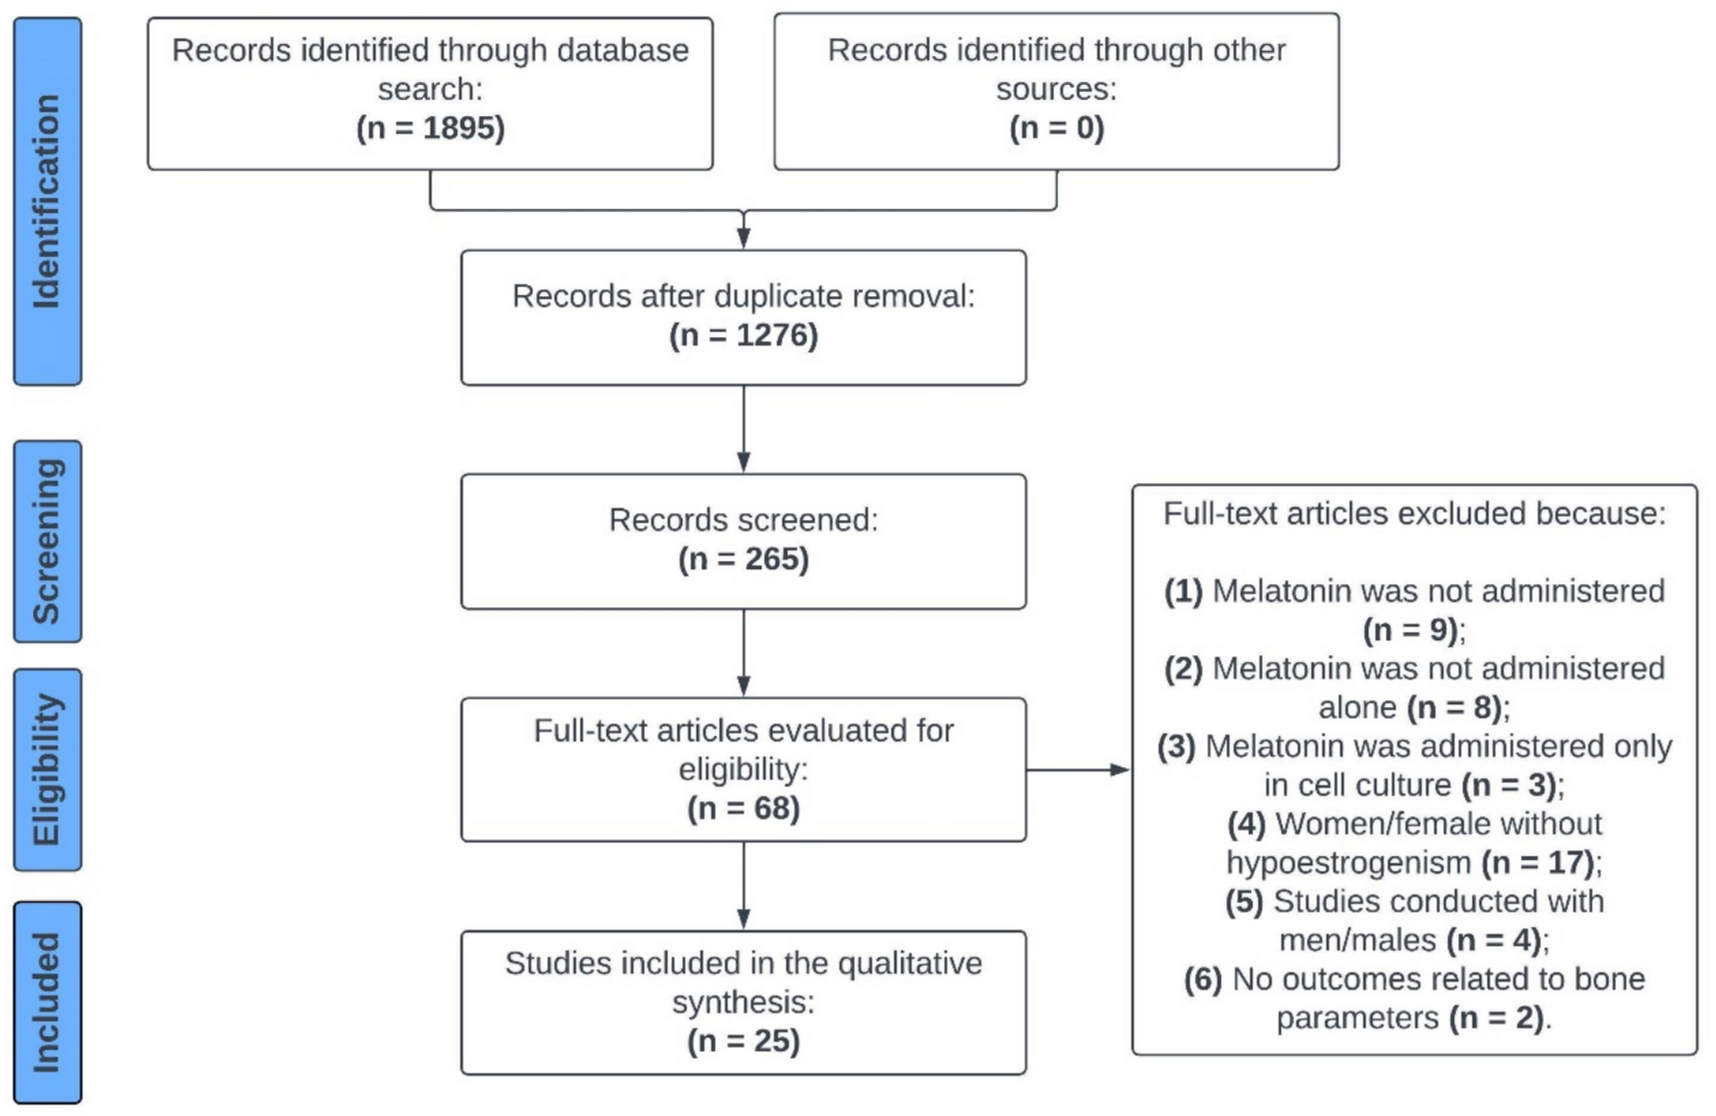
The selection process of the studies for the qualitative and quantitative synthesis is depicted in Fig. 1. A total of 1722 articles were retrieved from a systematic search of the literature in PubMed, Scopus, and Web of Science. After elimination of duplicates (n = 765), 957 articles underwent title and abstract examination, resulting in the exclusion of 900 studies that were out of scope for the current review. For the remaining 54 reports, full text was collected and assessed for eligibility. A total of 33 studies were excluded due to the reasons presented in Fig. 1. Additionally, 2 studies were identified from screening references list of eligible studies. Thus, 26 studies met the pre-defined inclusion criteria and were included in the systematic review. The full text of the included studies was again reviewed in detail by two authors and, 10 reports were identified as eligible for the Ki-67 meta-analysis.
Fig. 1
Flowchart illustrating the literature search and the selection process for the studies included in the systematic review and meta-analysis
3.2 Characteristics and quality of the studiesAll original articles selected for qualitative analysis were observational studies with retrospective (n = 24) [12, 18, 20,21,22,23,24,25,26,27,28,29,30,31,32,33,34,35,36,37,38,39, 41, 45] and prospective (n = 2) data [19, 36]. The diagnosis method was identified in most of the studies including imaging modalities [21, 33], histopathological scores, including Weiss [12, 20, 21, 25, 27, 30, 31, 36, 37, 41, 45], van Sloten [24] and Lin-Weiss-Bisceglia [33, 45] scores, and the evidence of malignant features, as local invasion, or distant metastasis [26, 28, 29]. The diagnosis tool was not clearly stated or not reported in five studies [19, 23, 34, 38, 39]. Among the twenty-six studies included in the systematic review, twenty-one articles provided data for IGF2 (n = 2) [21, 23] or for Ki-67 (n = 19), in separate [24,25,26,27,28,29,30,31,32,33,34,35,36,37,38,39,40,41, 45], while five studies contained data for both markers [12, 18,19,20, 22]. The individual characteristics of the included studies are summarized in Table 1 and Table 2.
QUADAS-2 criteria revealed that the overall quality of the included studies was acceptable (Fig. 2), as the percentage of articles with a high risk of bias and applicability concerns did not exceed 25%. Missing information regarding blinding interpretation of IHC staining from ACT diagnosis and lack of description of ACC and ACA classification using the same diagnosis criteria were the main reasons for the unclear risk of bias in reference standard and flow and timing domains, respectively. The tumor origin was confirmed by one study through the evaluation of markers of adrenal cortical differentiation, as steroidogenic factor 1 (SF-1), melan-A and alpha-inhibin. In the remaining studies n = 25, this assessment was not directly reported, therefore, applicability concerns in patient selection domain were rated as unclear for most of the studies. High applicability concerns were detected for studies that performed IGF2 and/or Ki-67 IHC not aiming to assess the accuracy of these markers for ACT diagnosis. The quality assessment of each study within the four domains is presented in Supplementary File 3.
Fig. 2
Risk of bias and applicability concern of the included studies according to Quality Assessment of Diagnostic Accuracy Studies 2 (QUADAS-2)
3.3 Evaluation of IGF2 for ACC diagnosisSolely seven out of twenty-six studies assessed IGF2 expression by IHC in both benign and malignant ACT (Table 1). IGF2 immunostaining was evaluated by three different methods: qualitative [18], semi-quantitative [12, 19, 21, 22] and quantitative analysis [20, 23].
A qualitative method was employed by one study, considering a positive staining when a perinuclear dot-like signal or Golgi pattern immunoreactivity was observed. This immunohistochemical staining pattern demonstrated a sensitivity and specificity of 76.5% and 95.5%, respectively [18].
Four studies used a semi-quantitative method to evaluate IGF2 expression, yet different score systems were employed. Two studies used a scoring system ranging from 0 to 4. Soon et al., classified a score 0–1 as negative, whereas a score ranging from 2 to 4 translated as a positive staining. This study demonstrated that 100% of ACAs were negative whereas 78% of ACCs were positive (score 2 + or more), showing a perinuclear accumulation with or without significant cytoplasmatic staining. In addition, IGF2 demonstrated to be a good marker to distinguish ACC from ACA with an AUC of 0.863 [19]. The other study found a higher number of ACC with elevated IGF2 expression when compared to ACA. Wang et al., aiming to validate the diagnostic accuracy of IGF2, evaluated its expression in 15 borderline tumors, i.e., tumors with a Weiss score of 2 or 3. However, this marker could not predict the malignant potential accurately [12]. A different scoring system was adopted by Zhu et al., comprising the combination of the percentage of cells with positive staining (score 0 to 3) and the intensity of the staining, using intensity grades of 0 (absence) to 3 (strong). IGF2 staining was observed in 25% of the benign versus 70.83% of malignant ACT cases [21]. Similarly, Babinska et al., presented IGF2 expression as H-score values, which translates in the product of the percentage of cells with positive reactivity (0–100%) and the intensity of reactivity (0–3). Both ACC and ACA showed a median H-score of 100. In benign ACT, the 25th and 75th percentile range spanned from 0–110, while for malignant ACT ranged from 50 to 100. In addition, a unit increase in H-score was associated with 22% higher odds ratio of an ACC diagnosis, adjusted for age, gender, tumor size, and hormonal activity [22].
On an opposed approach, IGF2 expression was reported as the percentage of stained area quantified using a morphometric analysis tool. Pereira et al., found that the percentage of IGF2 stained area was significant higher in ACC when compared to ACA, including non-functioning ACA (ACAn) and ACA with Cushing’s Syndrome (ACAc). IGF2 demonstrated to be a good marker to differentiate ACC from ACA [20]. In addition, IGF2 expression was also found to be significant higher in ACC comparing to ACAn. Indeed, this IHC marker showed an excellent discriminative power between these two entities, with 100% of sensitivity and specificity for a cut-off value of 27.1% stained area [23].
To summarize, regardless the immunostaining evaluation method adopted, the studies unanimously described the presence of IGF2 expression in most of ACC when compared to ACA, suggesting the specificity for malignant ACT. However, due to the differential immunostaining analysis methods employed within the studies, it was not feasible to conduct a meta-analysis to assess the accuracy of IGF2 in identifying malignant ACT.
3.4 Evaluation of Ki-67 for ACC diagnosis: a descriptive approachTumor proliferation activity was assessed by Ki-67 IHC in benign and malignant ACT in twenty-four studies (Table 2). Most of the studies quantified Ki-67 expression proliferation index by calculating the percentage of positive cells by manual or automated count of the hot spot or random areas [22]. Specifically, this involved counting almost or at least 500 cells, minimum or about 500 [29, 45] or 1000 cells [18, 26, 28, 32], or 2000 cells [24, 40] and therefore presenting the proliferation activity of the tumors as LI. All included studies found a higher Ki-67 expression in ACC when compared to ACA [12, 18,19,20, 22, 24,25,
Comments (0)