
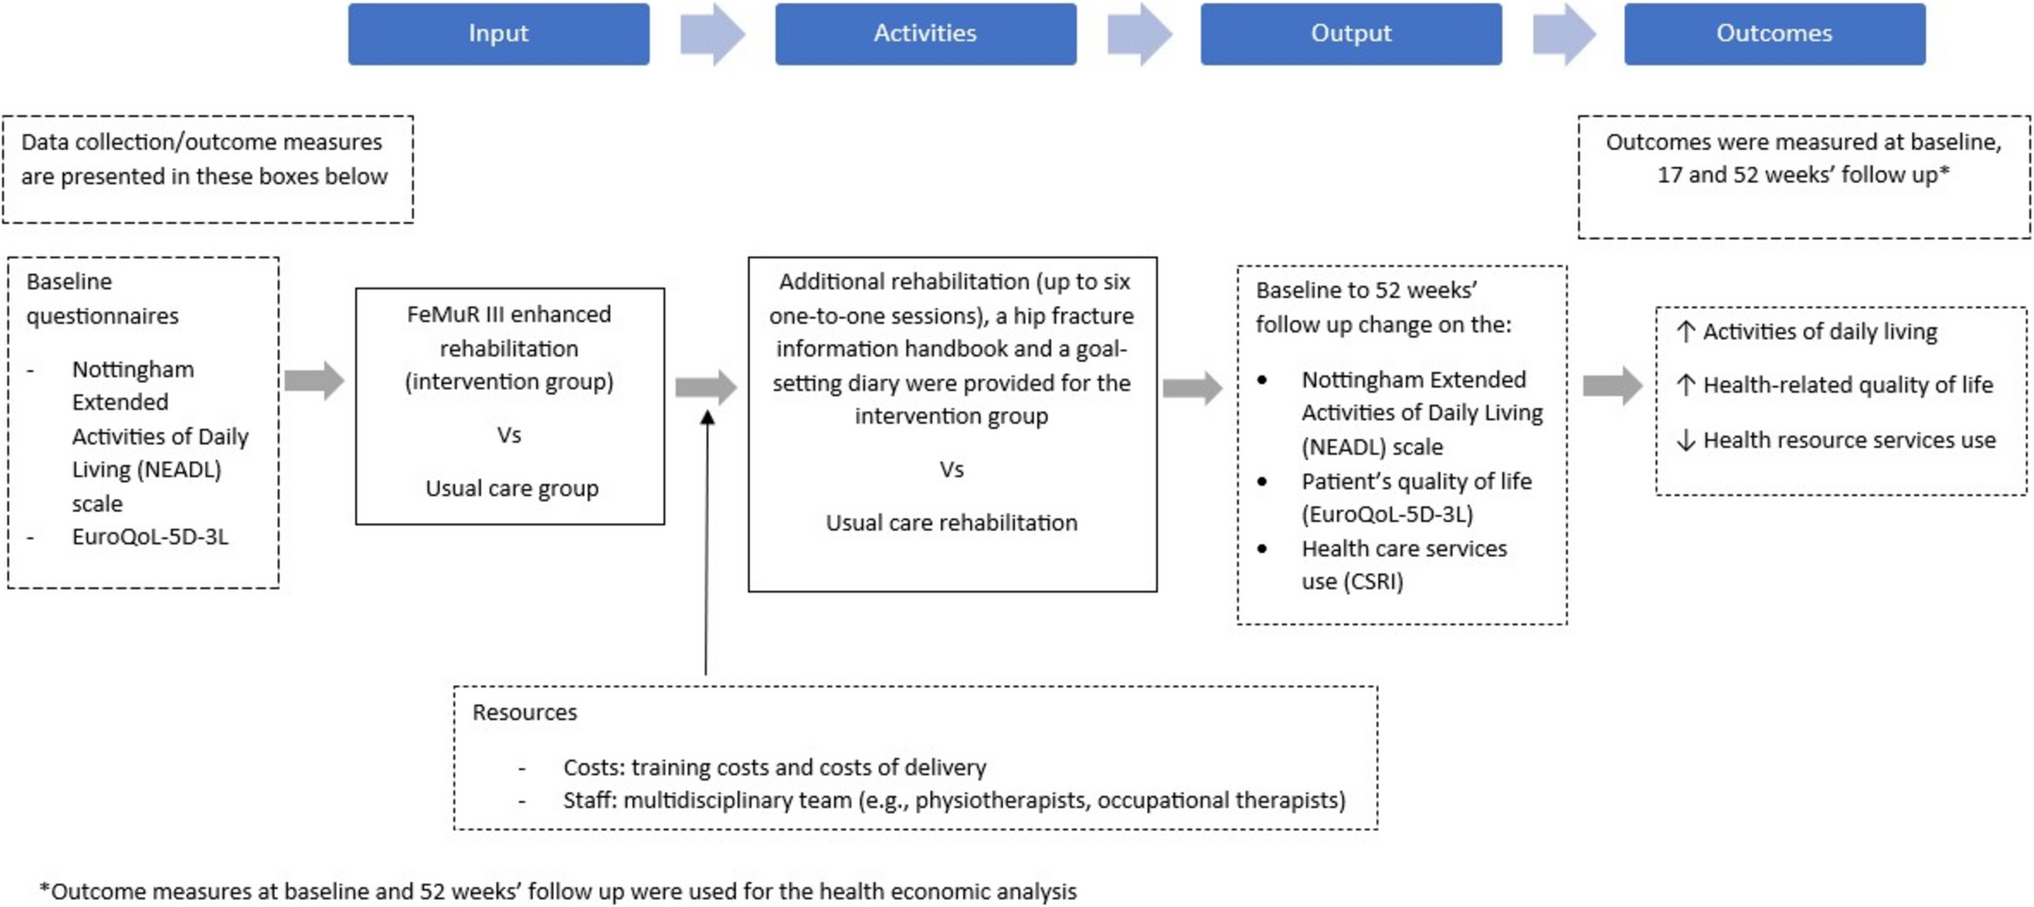
Remember me


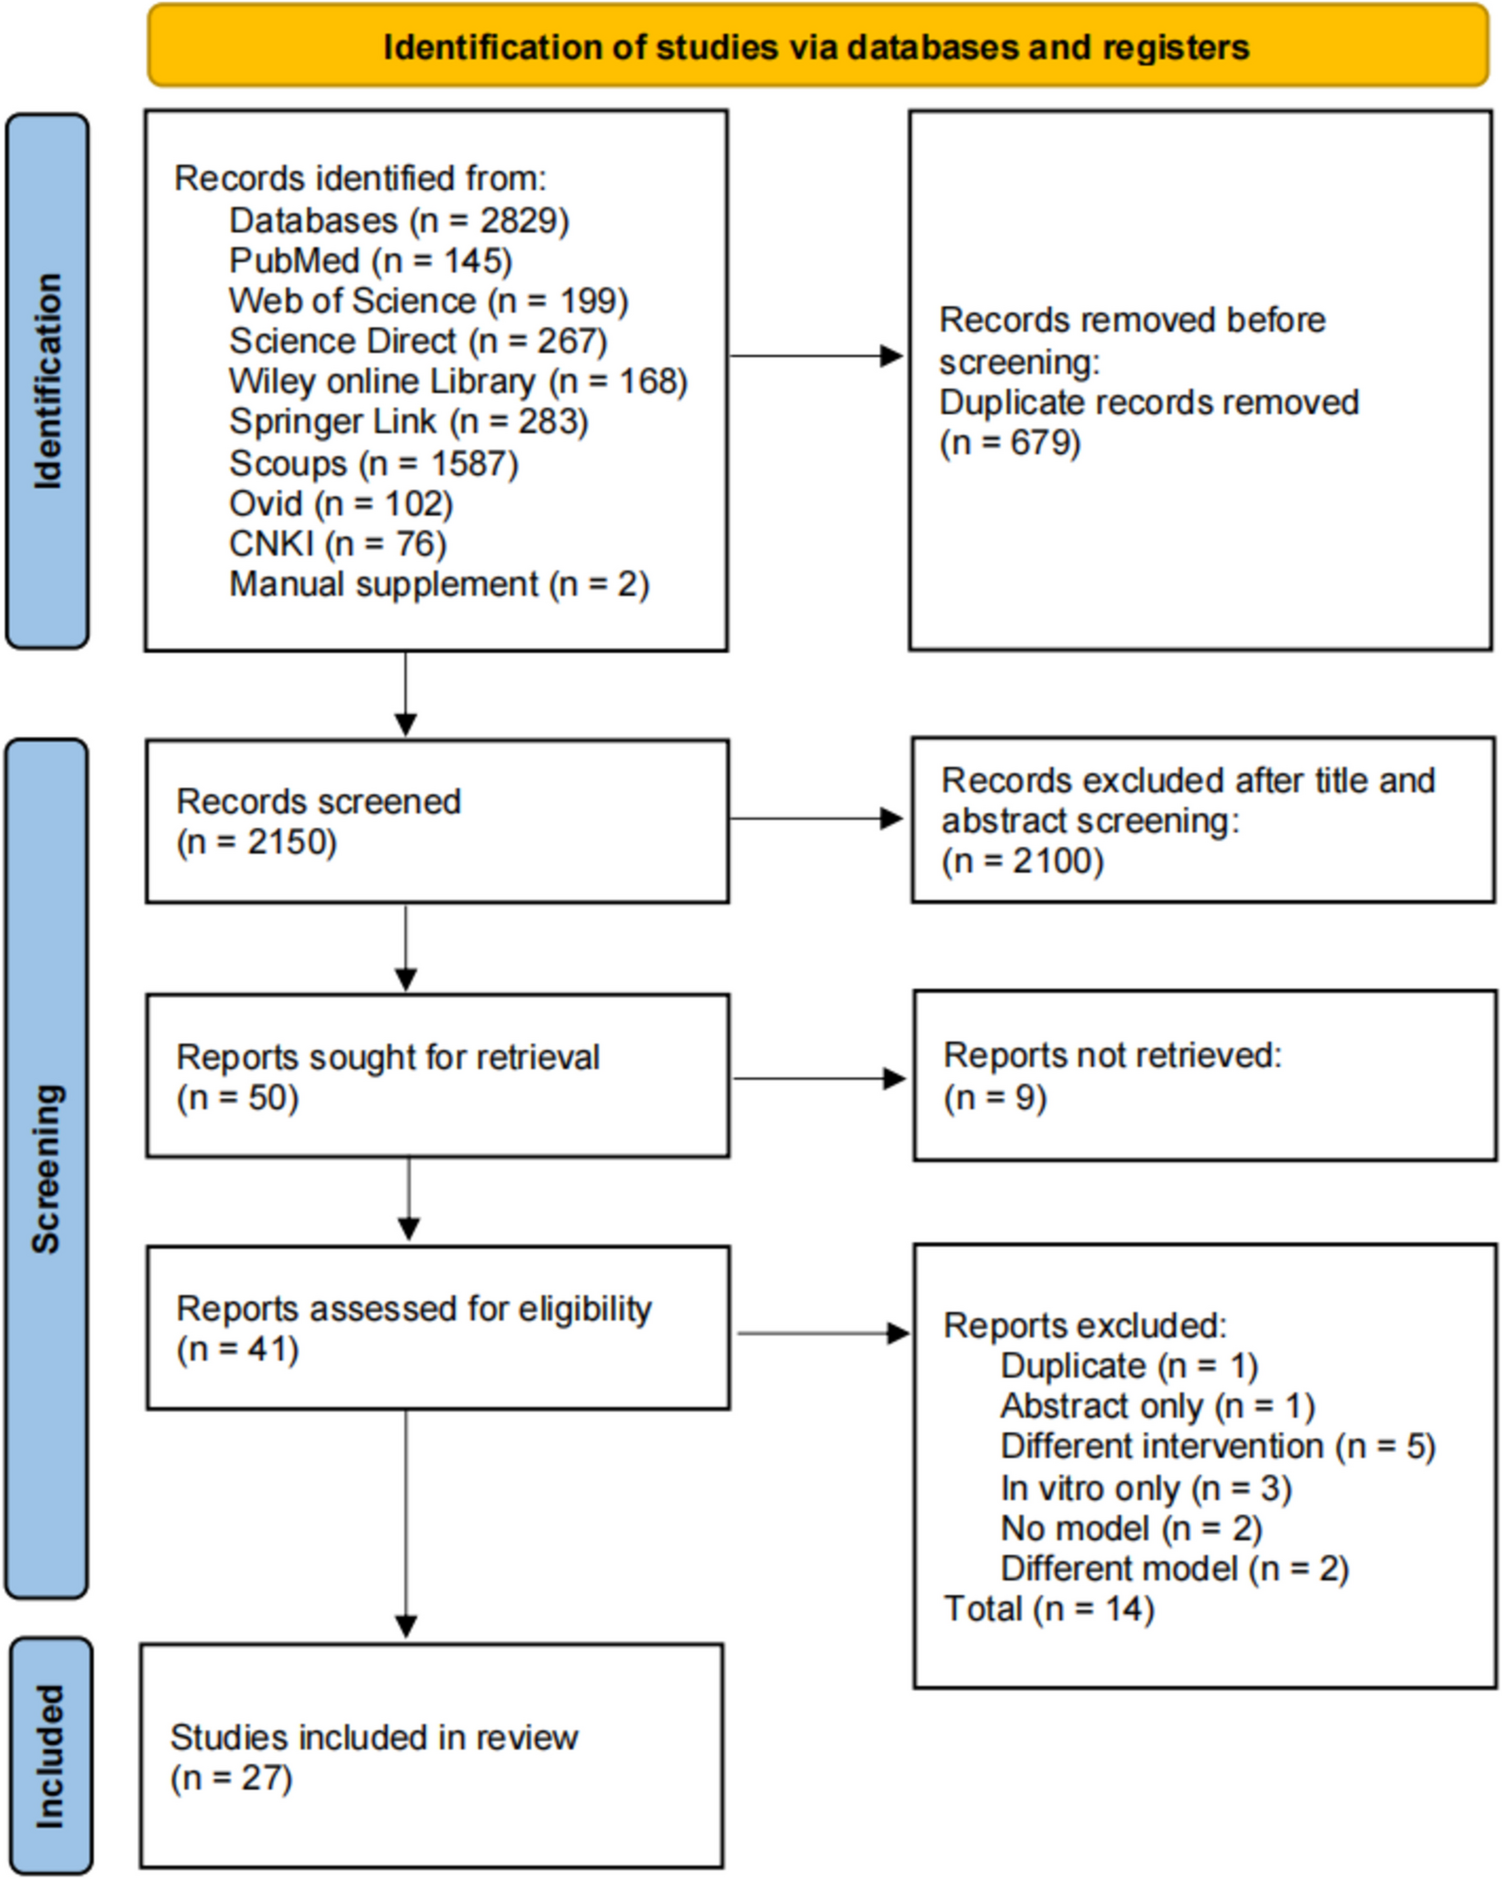
Two hundred five participants were recruited to the FEMuR III trial. However, two participants had error in randomisation. Therefore, 203 were included in this trial. One hundred were allocated to the usual care group and 103 were allocated to the intervention group. Twenty participants died during the trial. The mean age of participants in the usual care and intervention groups were 84.7 years and 84.9 years, respectively. Baseline characteristics of participants from both groups were comparable (Table 1).
Table 1 Baseline characteristics of participants (n = 203)Health-related quality of lifeOverall, 122 participants completed the EQ-5D-3L at both baseline and 52-week follow-up. The 20 participants who died were included in this complete case sample. This sample represents 70% of the full trial sample. Baseline characteristics of this subsample were comparable to the overall sample (n = 203) (Supplementary File).
At baseline, mean EQ-5D-3L index scores were slightly higher in the intervention group (0.53 intervention, 0.51 usual care). Participants in the intervention group (0.65) had a greater improvement in EQ-5D-3L index scores at 52-weeks compared to usual care (0.59) (Table 2). The mean EQ-5D scores for both groups at baseline were lower than the UK population norm for those aged 75 years or over (0.73).
Table 2 The EQ-5D-3L at baseline and 52-week follow-up for complete cases (n = 142)At 52-week follow-up, participants from the intervention group gained higher QALYs than usual care by 0.02 (95% CI: − 0.036, 0.076). However, this difference was neither statistically significant (p-value = 0.312) nor clinically meaningful. Participants in the intervention group reported greater improvement of VAS score at 52-week follow-up than the usual care group by 1.84 (p-value = 0.796) (Table 2).
In the imputed case sample, participants in the intervention group showed lower improvements in QALYs than participants in the usual care group by 0.01 (95% CI: − 0.056, 0.030). However, this difference was neither statistically significant (p-value = 0.645) nor clinically meaningful (Table 3).
Table 3 The EQ-5D-3L at baseline and 52-week follow-up for imputed cases (n=203)FEMuR III intervention training costsIn each of the 13 sites, two trainers delivered the FEMuR III training. One trainer was a physiotherapist (Band 7) (£63 per working hour), and the other was an academic general medical practitioner (£63 per working hour). These trainers had to travel to each site to deliver the training. The average travel and accommodation costs were £100 per session. Each training session lasted 4 h and was delivered typically to two physiotherapists (Band 6) (£53 per working hour).
The mean training cost of FEMuR III per site was £1,028 (Eq. 1):

(1)
where £232 is the sum cost per working hour for 2 × Band 6 physio, 1 × Band 7 physio, and 1 × Consultant.
Multiplying the mean training costs by 13 for the number of sites, the total FEMuR III training costs were £13,364.
Intervention delivery costsThe mean total rehabilitation sessions provided were 7 (SD: 5.67) for the intervention group and 5 (SD: 7.30) for the usual care group. The median number of rehabilitation sessions were 6 [IQR: 3] and 3 [IQR: 4] for the intervention and usual care groups, respectively. Mean delivery costs per participant were £444 (SD: 336.76) for the intervention group and £157 (SD: 189.89) for the usual care group.
Health resource useDue to the high percentage of missing data in health resource use (around 40%), we decided to present complete cases only.
Complete cases sample (n = 115)The most commonly used health resource in community-based services for both groups was the district nurse. The intervention group had higher frequency of district nurse and general practitioner (GP) visits than usual care. The usual care group had a higher frequency of visiting practice nurses at a GP clinic.
Regarding hospital service use, both groups reported similar frequency of total admissions, outpatient, and accident and emergency attendances. The average inpatient length of stay (LOS) was approximately 5 days longer for the intervention group (Table 4).
Table 4 Health resource use over 52-week follow-up, mean (SD)Health resource use costsComplete cases (n = 115) NHS perspectiveOne hundred fifteen participants had complete cost data. This figure includes 20 participants who died before 52-week follow-up, 56 participants from the intervention group, and 59 participants from the usual care. These complete cases represent 57% of the full trial sample size. The baseline characteristics of this sample are presented in Supplementary file.
At 52-week follow-up, inpatient stay costs were the highest contribution of total health care cost for both groups. There was a statistically significant difference in the mean total hospital inpatient stay costs between groups (p = 0.043). In the intervention group, hip-related hospital inpatient stay costs accounted for 40% of the total inpatient stay cost. The other 60% of costs were attributable to non-hip related conditions. For the usual care group, only 13% of total inpatient stay costs were attributed to hip-related inpatient stays (Supplementary file).
The mean total health resource use costs were £3,332 (SD: 5,343.94) for the intervention group and £1,713 (SD: 4,191.25) for the usual care at 52-week follow-up (Table 5). After removing outliers, the mean total health resource use costs for complete cost data were still higher for the intervention group, £1,358 (SD: 2,639.00) than usual care, £679 (SD: 1,245.39) (Supplementary file).
Table 5 The cost-consequences balance sheet (complete cases) Wider societal perspectiveThe mean total health resource use costs were £3,346 (SD: 5,342.97) for the intervention group and £1,734 (SD: 4,224.39) for usual care at 52-week follow-up (Table 5). Inpatient stay costs are the costliest element, as was the case from the NHS perspective. No statistically significant difference in the mean total hospital inpatient stay costs was found (p-value = 0.057) (Supplementary file).
From both perspectives, the intervention group had greater health service use costs. This was due to high non-hip-related inpatient stay costs and longer average LOS for the intervention group (Table 5).
Comments (0)