Ethical considerations
This study was approved by the Ethics Committee of the National Defense Medical College (approval number 4845) and was conducted in accordance with the principles of the Declaration of Helsinki. Since the patients involved in this study were children, the research contents were explained in writing and verbally to the parents, and a signed informed consent was obtained.
Establishment of hiPSC
hiPSCs were generated from two unrelated individuals harboring DNM1L mutation. The hiPSC lines were established as previously reported.39 Briefly, we obtained fibroblasts from patients and reprogrammed them by transfecting Oct3/4, Sox2, Klf4, L-Myc, Lin28, mp53DD, and EBNA1 with episomal vectors into hiPSCs. Three colonies were created in patient 1 and two in patient 2. Of these, one colony from each patient was selected for stable proliferation cell line which differentiated into cardiomyocytes more effectively. hiPSCs established from peripheral blood mononuclear cells of healthy female Asians were purchased from Phenocell (Provence-Alpes-Côte d’Azur, France) and used as a control. The control iPSCs does not have DNM1L mutations assessed by Sanger sequencing (data not shown).
hiPSC passage and culture
We seeded 1.5–2.0 × 10⁵ hiPSCs/well into a 6-well plate pre-coated with Matrigel (CORNING, Corning, NY) and maintained in mTeSR1TM (Stem Cell Technologies, Vancouver, Canada) medium supplemented with 5 mM of the ROCK inhibitor Y-27632 (FUJIFILM WAKO, Osaka, Japan). On the following day, the medium was replaced with fresh mTeSR1 TM without Y-27632. The medium was changed daily, and at 70–80% confluence, the cells were passaged.
Cardiomyocyte differentiation and purification
Cadiomyocyte differentiation was induced with glycogen synthase kinase-3 (GSK3) and Wnt inhibitors as previously reported40 with slight modification. Briefly, hiPSCs were dissociated with accutase (Innovative Cell technologies, San Diego, CA) and replated on wells on a 12-well plate pre-coated with Matrigel in 1.5 ml/well mTeSR1TM medium supplemented with 5 μM of Y-27632 (FUJIFILM WAKO) at a density of 0.5–2.5 × 10⁵ cells per each well on 4 days before the initiation of cardiomyocyte differentiation (Day-4). On Day-3, Day-2, Day-1, the medium was replaced with fresh mTeSR1TM without Y-27632. On Day 0, to initiate cardiomyocyte induction, the medium was replaced with 1.5 ml/well RPMI-1640 (Thermo Fisher Scientific, Waltham, MA) with B27 supplement (RPMI/B27) without insulin (Thermo Fisher Scientific), supplemented with 8 μM CHIR99021 (GSK3 inhibitor) (Selleckchem, Houston, TX). On day 1, the medium was replaced with fresh 1.5 ml/well RPMI/B27 without insulin. On Day 3, the medium was changed with 1.5 ml/well RPMI/B27 without insulin, supplemented with 5 μM IWP2 (Wnt inhibitor) (Tocris Bioscience, Bristol, UK). On Day 5, the medium was replaced with fresh 1.5 ml/well RPMI/B27 without insulin. On Day 7 and every 2 days thereafter, the medium was changed with 1.5 ml/well RPMI/B27 with insulin. By around day 14, the cells were beating spontaneously.
To purify hiPS-CMs, hiPS-CMs at 20–30 days of the differentiation were cultured in lactate medium, containing 4 mM lactate (FUJIFILM WAKO) in glucose-free DMEM (Sigma Aldrich, St. Louis, MO), for 7 days.41 The lactate medium was changed every 2–3 days to remove dead cells. We confirmed the purity of hiPS-CMs by the positivity of cardiac troponin T by fluorescence-activated cell sorting (FACS) analysis (see Supplementary Methods). Only hiPS-CMs that reached a purity of 80% or higher were used for further experiments. After purification, hiPS-CMs were cultured in the maintenance medium; DMEM-F12 (Sigma Aldrich) with 2% fetal bovine serum (Thermo Fisher Scientific) containing GlutamaxTM (Thermo Fisher Scientific), non-essential amino acids (Thermo Fisher Scientific), 2-mercaptoethanol (Sigma Aldrich), and penicillin/streptomycin (Thermo Fisher Scientific). All hiPS-CMs used in the experiments had been differentiated for more than 60 days.
Mitochondrial staining of hiPS-CMs
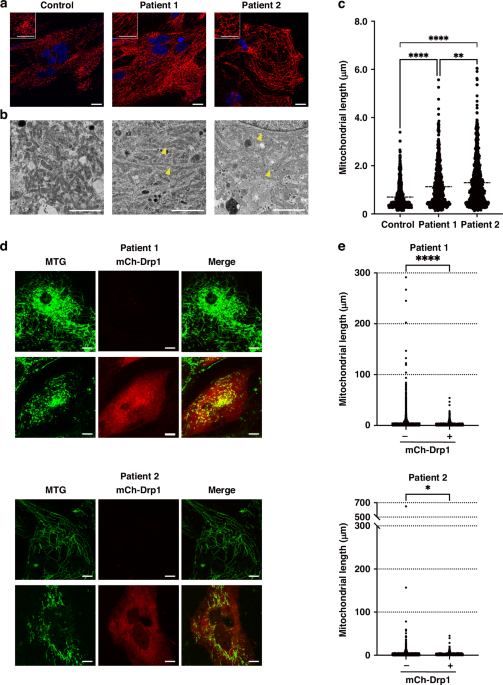
Mitochondrial morphology was visualized using MitoTracker Red (MTR) (Thermo Fisher Scientific). The hiPS-CMs were seeded on 35-mm glass-bottom tissue culture plates (Iwaki, Shizuoka, Japan) in the maintenance medium without phenol red and incubated at 37 °C, 5% CO2 for 4–7 days. Subsequently, the cells were incubated with 200 nM MTR for 30 min at 37 °C, 5% CO2 in the dark. Nuclei were stained with NucBlue (Thermo Fisher Scientific). Live imaging of hiPS-CMs was performed using fluorescence confocal microscopy (TCS SP8X, Leica, Wetzlar Germany) at 40× magnification. Fluorescence images were obtained under the following conditions: frame size: 1024 × 1024, excitation: 578 nm (MTR) and 405 nm (NucBlue), emission filter set: 588–655 nm (MTR) and 423-485 nm (NucBlue), and laser power: 0.15% (MTR) and 0.2% (NucBlue).
Transmission electron microscopy
The hiPS-CMs were fixed with 2% paraformaldehyde and 2.5% glutaraldehyde, post-fixed with 2% osmium tetroxide, and embedded in epoxy resin. Ultrathin sections were cut, stained with uranyl acetate, and observed under a transmission electron microscope (JEM-1400Plus, JEOL, Tokyo, Japan). Mitochondrial length was measured by scaling the longitudinal length of the mitochondria using the ImageJ software (NIH, Bethesda, MD).
Transfection of patient-derived hiPS-CMs with mCherry-Drp1 plasmid
Patient-derived hiPS-CMs were seeded on triple-well glass-bottom tissue culture plates (Iwaki) in the maintenance medium and incubated at 37 °C, 5% CO2 for 4–7 days. Subsequently, cells were transfected with the complex of mCherry-Drp1 (mCh-Drp1) plasmid (plasmid #49152, Addgene, Watertown, MA) and TransporterTM 5 Transfection Reagent (Polysciences, Warrington, PA) at 37 °C, 5% CO2 for 24-48 h. After washing with phosphate-buffered saline, cells were incubated with 200 nM MitoTracker Green (MTG) (Thermo Fisher Scientific) in a fresh medium for 30 min at 37 °C, 5% CO2 in the dark. Live imaging of transfected hiPS-CMs was performed using fluorescence confocal microscopy at 40× magnification with 3× zoom under the following conditions: frame size: 1024 × 1024, excitation: 490 nm (MTG) and 588 nm (mCh-Drp1), emission filter set: 505–555 nm (MTG) and 597-690 nm (mCh-Drp1), and laser power: 4.0% (MTG) and 2.0% (mCh-Drp1). Mitochondrial length was measured by scaling the longitudinal length of the mitochondria using Mitochondria Analyzer, a plugin for ImageJ software.
Analysis of mitochondrial membrane potential
Mitochondrial membrane potential (ΔΨm) was estimated using JC-1 (Dojindo, Kumamoto, Japan). The hiPS-CMs were seeded on 35-mm glass-bottom tissue culture plates in the maintenance medium and incubated at 37 °C, 5% CO2 for 4–7 days. Subsequently, the cells were incubated with 4 μM JC-1 for 30 min at 37 °C, 5% CO2 in the dark. The hiPS-CMs were visualized using fluorescence confocal microscopy (TCS SP8X) at 40× objective. Fluorescence images were obtained under the following conditions: frame size: 1024 × 1024, excitation: 535 nm (red) and 488 nm (green), emission filter set: 560–610 nm (red) and 500–550 nm (green), and laser power: 0.03% (red) and 0.8% (green). The ratio of red/green fluorescence intensity of JC-1 was measured using the ImageJ software.
Measurement of oxygen consumption rate
Oxygen consumption rate (OCR) was measured using a high-resolution respirometry (Oxygraph-2k, Oroboros, Innsbruck, Austria). The hiPS-CMs were detached from the 24-well plates using 1 mg/dL collagenase B (Roche, Roswell, GA) and Accumax (Innovative Cell Technologies, San Diego, CA). The number of cells was counted using an automatic cell counter (Thermo Fisher Scientific). The cells were washed twice with maintenance medium and suspended with MiR05 mitochondrial respiration medium (3 mM MgCl2, 60 mM K+-lactobionate, 20 mM taurine, 10 mM KH2PO4, 20 mM HEPES, 110 mM D-sucrose, 0.5 mM EGTA, pH adjusted to 7.1 with KOH at room temperature, and 1 g/L bovine serum albumin, essentially free of fatty acids). We measured the real-time OCR of hiPS-CMs using the Oroboros Oxygraph SUIT protocol with slight modification.42 Cell membranes of hiPS-CMs were permeabilized with 5 μg/mL digitonin, and mitochondrial respiration was established by adding 5 mM pyruvate and 2 mM malate, followed by 2.5 mM ADP, to measure the oxidative phosphorylation (OXPHOS) capacity of complex I (OXPHOS complex I), driven by the NADH-related substrates. To measure maximal OXPHOS capacity (OXPHOS complex I + II), 10 mM succinate was added. The OCR was estimated as pmol/ (s × million cells). Subsequently, 0.5 μM rotenone was added to inhibit complex I and measure complex II-linked OXOPHOS capacity. Finally, 2.5 μM antimycin A was added to inhibit complex III and measure mitochondrial residual oxygen consumption.
Measurement of ATP production
To transfect hiPS-CMs with the expression vector for mitochondrial targeting MaLionR (MitoMAR),43 the hiPS-CMs were seeded on 35-mm glass-bottom tissue culture plates in the maintenance medium and incubated at 37 °C, 5% CO2 for 4–7 days. Subsequently, cells were transfected with the complex of expression vector and polyethylenimine (Polysciences) at 37 °C and 5% CO2 for 6 h. After washing with phosphate-buffered saline, the cells were cultured in a fresh medium at 30 °C for 48 h. Red fluorescence derived from MitoMAR was observed at 37 °C under a confocal microscope (FV1200, Olympus, Tokyo, Japan) equipped with a 60× oil-immersed lens in the time-lapse mode. During the observation, the cells were stimulated with oligomycin at a final concentration of 25 μM. Fluorescence images were obtained under the following conditions: frame size: 512 × 512, excitation: 561 nm, emission filter set: 575–675 nm, laser power: 1.5%, time per picture: 1.64 s, interval: 10 s, and number of pictures: 250.
Ca2+ imaging of hiPS-CMs
The hiPS-CMs were seeded to 22-mm slide-glass dishes, incubated in the maintenance medium at 37 °C, 5% CO2 for 4–7 days and loaded with 5 μM Fluo-4 AM (DOJINDO, Kumamoto, Japan) dissolved in the maintenance medium in the dark for 30 min. The maintenance medium contains 120 mM NaCl, 14.3 mM NaHCO3, 0.45 mM NaH2PO4, 0.5 mM Na2HPO4, 4.2 mM KCl, 1.2 mM CaCl2, 0.5 mM MgCl2, 0.4 mM MgSO4, and 15 mM HEPES (pH 7.4). The cells were stimulated using platinum field-stimulation electrodes at pacing intervals of 600 ms and 400 ms (beating rates of 100 and 150 bpm, respectively), and calcium fluorescent signals were recorded using a fluorescence microscope (Keyence BZ-X710, Osaka, Japan). F/F0, the ratio of the peak-to-base fluorescence intensity, and 50% time to decay (T50) were calculated.44
Motion analysis of hiPS-CMs
The hiPS-CMs were seeded in a 24-well plate with iCell cardiomyocyte maintenance medium (FUJIFILM Cellular Dynamics, Tokyo, Japan) and incubated for 4–7 days. Contractile and diastolic function were quantified using a high-precision live imaging system (SI8000, SONY, Tokyo, Japan). The plate seeded with cardiomyocytes was placed in a shooting unit and allowed to stand for 30 min until the samples stabilized. Following stabilization, motion images were recorded for 10 s. Subsequently, isoproterenol was administered (0.03, 0.1, 0.3, and 1.0 μM). Each concentration of isoproterenol was applied for 5 min, and video images were recorded for 10 s. Phase-contrast video imaging was performed using a 4× objective at 150 frames/s and a resolution of 2048 × 2048 pixels. The beating of cardiomyocytes was captured and the contraction and relaxation speeds during the beat were plotted at steady state and in tachycardia state induced with isoproterenol. We obtained a series of hiPS-CMs parameters from the motion waveforms, as previously reported.45 The parameters were maximum contraction speed (MCS), which represented contractile properties; maximum relaxation speed (MRS), which represented relaxation properties; and beating rate.
Statistical analysis
Data are presented as mean ± standard error of the mean (SEM). The normality of data distribution was evaluated using the Shapiro-Wilk test to determine whether parametric or nonparametric tests should be performed. Normally distributed were analyzed using one-way analysis of variance followed by Tukey’s multiple comparisons test. Meanwhile, non-normally distributed data were analyzed using the Kruskal–Wallis test followed by Dunn’s multiple comparison test. Mixed-effects analysis was used for repeated measures. All statistical analyses were performed using GraphPad Prism version 9.5.1 (GraphPad Software, San Diego, CA). Results were considered statistically significant at p < 0.05.


Comments (0)