
Remember me
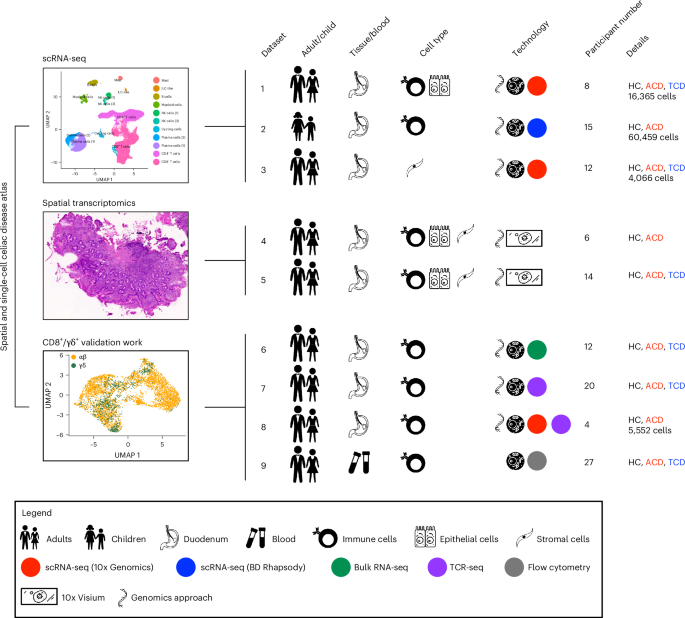
We generated scRNA-seq profiles of duodenal epithelial, immune and parenchymal populations from 35 participants: 21 with CD (16 children, 5 adults) and 14 controls (5 children, 9 adults; Fig. 1 and Supplementary Table 1). We used complementary single-cell techniques for adult and pediatric datasets, with 86,442 cells sequenced. In adults (datasets 1 and 3), we performed scRNA-seq (10x Genomics) on epithelial, immune (Supplementary Fig. 1a,b), stromal and endothelial cells. In children (dataset 2), we performed targeted scRNA-seq (BD Rhapsody; 504 targeted gene primer pairs) and surface protein expression (79 oligonucleotide-conjugated antibodies) on intestinal immune cells (Supplementary Fig. 1c,d and Supplementary Tables 2 and 3).
Fig. 1: Study schematic.
Schematic of scRNA-seq, RNA-seq, TCR-seq, spatial transcriptomics, and flow cytometry experiments and datasets. Dataset 1: ECs and total mucosal CD45+ cells were isolated from intestinal biopsy samples before scRNA-seq library preparation using the 10x Genomics platform. Dataset 2: total mucosal CD45+ cells were isolated from intestinal biopsy samples before combined targeted scRNA-seq and multiplex surface antibody characterization using the BD Rhapsody platform. Dataset 3: scRNA-seq (10x Genomics) was performed on intestinal stromal and endothelial cells. Datasets 4 and 5: OCT-embedded frozen duodenal biopsy samples were sectioned and used for spatial transcriptomics (10x Visium). Datasets 6 and 7: mucosal CD8+ T cells were isolated before bulk RNA-seq and TCR-seq. Dataset 8: mucosal CD8+ and γδ+ T cells were isolated before scRNA-seq library preparation using the 10x Genomics platform. Dataset 9: flow cytometry of circulating CD8+ T cells. Study participant numbers and disease characteristics, as well as cell numbers after the quality-control pipeline, are indicated. ILC, innate lymphoid cell; HC, healthy controls; ACD, active celiac disease; TCD, treated celiac disease.
The duodenal epithelial compartment in CDWe analyzed EPCAM+ epithelial populations from dataset 1. Nine transcriptionally distinct epithelial cell (EC) clusters were identified, representing progenitor, secretory and absorptive lineages along the developmental progression of the crypt–villus axis (Fig. 2a,b, Extended Data Fig. 1a and Supplementary Table 4). BEST4 enterocytes (BEST4+CA7+CPA2+), first identified in the colon35, were seen, expressing CFTR and showing chloride channel activity (Fig. 2b and Extended Data Fig. 1a). Goblet cells (ITLN1+MUC2+SPINK4+) and tuft cells (PLCG2+TRPM5+IRAG2+) were also identified.
Fig. 2: ECs in CD.
a, UMAP plot of small intestinal epithelial EPCAM+ cells in HCs (n = 3) and in participants with CD (n = 5). b, Bubble plot showing the expression of selected genes defining specific cluster identities. Scaled gene expression indicated by color; proportion of cells expressing the gene indicated by bubble size. c, Local neighborhood enrichment of EPCAM+ cells in ACD versus HCs. Color indicates enrichment (log fold change (FC)) of cells in ACD versus HCs in that UMAP neighborhood; size of dot indicates false discovery rate (FDR)-adjusted −log10 values. d, TA cells (left) and early enterocytes (right) in HCs and CD, as a proportion of total EPCAM+ cells. e, Pseudotime trajectory of gene expression of EPCAM+ ECs, colored by pseudotime axis (left), cluster identity (middle) and lineage (right). Arrows indicate putative direction of cell differentiation. f, Density of cells along pseudotime trajectory axis split by disease state: ACD (red), TCD (blue) and HCs (gray). g, Smoothed heat map showing expression of selected genes related to intestinal absorption along pseudotime trajectories relating to secretory (toward left) and absorptive (toward right) lineage. h, Volcano plot displaying differentially expressed gene transcripts between HCs and ACD in total ECs. d, Unpaired two-tailed t-test. Data are presented as mean values ± s.e.m.
A LYZ+ Paneth cell-like population (MMP7+REG1A+SOD3+PLA2G2A+) was also identified (Fig. 2a,b), although defensin gene expression was not detected. This population expressed PGC, mucins including MUC5AC, MUC1 and MUC6 and AQP5, suggesting it also contained Brunner’s gland cells or ectopic gastric pyloric gland cells. This cell type was enriched in active celiac disease (ACD; Fig. 2c,d), perhaps in response to IFNγ. Thus, this population could represent inflammation-driven gastric cell metaplasia36.
Transit-amplifying (TA) cells were increased in CD, along with enrichment of uniform manifold approximation and projection (UMAP) areas corresponding to EC progenitors (stem cells, TA cells and early enterocytes; Fig. 2c,d). This persisted in treated celiac disease (TCD; Extended Data Fig. 1b,c). In parallel, more actively cycling ECs were observed in ACD and TCD (Extended Data Fig. 1d,e).
Pseudotime analyses identified epithelial developmental trajectories, from undifferentiated progenitor states toward absorptive and secretory lineages (Fig. 2e). In CD, ECs were shifted to earlier pseudotime states, with loss of mature ECs (Fig. 2f). CCL25, encoding the ligand for CCR9 (implicated in CD pathogenesis37), was expressed predominantly by progenitor cells (Fig. 2b and Extended Data Fig. 1f).
We examined putative EC functions through functional gene-set analysis (Extended Data Fig. 1a), identifying functions of secretory Paneth-like/Brunner’s gland cells (secreted protein and vesicle pathways), BEST4 enterocytes (chloride/anion channel activity), tuft cells (taste perception) and enteroendocrine cells (EECs; peptide hormone processing/secretion). Mature enterocytes expressed key metabolic and macronutrient catabolic pathways, and active transport and absorption mechanisms. Early ECs and TA cells did not express these pathways. Absorptive function genes were limited to cell states at the end of absorptive epithelium pseudotime trajectories, consistent with EC development along the crypt–villus axis (Fig. 2g). Notably, gene sets related to lipid, carbohydrate, cholesterol, vitamin and iron processing and absorption were all downregulated in mature enterocytes in ACD (Extended Data Fig. 1g–i). These transcriptional changes normalized in TCD, although some pathways, including fructose metabolism and lipid catabolism, remained reduced (Extended Data Fig. 1h). Overall, absorptive capacity is reduced in ACD not simply by reduction in villus surface area, but through a relative increase of EC progenitors lacking absorptive machinery, and pathway downregulation in mature enterocytes.
ECs in ACD upregulated multiple antigen-presentation molecules, including classical HLA class I and class II genes (except HLA-DQ) and nonclassical genes including HLA-E and HLA-F (Fig. 2h). Interferon-stimulated genes (types I and II) dominated the epithelial response, including STAT1 (Fig. 2h and Supplementary Table 5). The major disease-associated responses were observed in all EC lineages (Extended Data Fig. 1j–l), including antigen-presentation pathways, type I/II interferon responses, lymphocyte-mediated immunity and cytotoxicity and cell adhesion regulation (Extended Data Fig. 1m,n).
Some transcriptional changes were cell-type specific. IL32 was highly expressed in ACD by mature enterocytes (Extended Data Fig. 1k), perhaps regulated by interferons. The reduction of fatty acid catabolism/transport (APOA1, FABP2), metal ion transport (iron: FTH1, FTL; zinc: SLC39A4) and carbohydrate metabolism (ALDOB, PCK1) was restricted to absorptive lineages, mainly mature enterocytes (Extended Data Fig. 1k,n). Progenitor cells upregulated genes associated with cell division and differentiation, and downregulated those associated with tissue repair and homeostasis (Extended Data Fig. 1m,n). Secretory lineages showed increased expression of gut hormone genes, LYZ, and chemokines (CXCL17, CXCL2; Extended Data Fig. 1l).
The duodenum, where CD inflammation predominates, has sensory and neurohormonal functions. We extended EEC clustering, revealing multiple transcriptional states, including NEUROG3+ progenitors and EEC subtypes, which showed similar CD-related transcriptional changes to other ECs (Extended Data Fig. 2). EEC proportions altered in CD, with increases in NEUROG3+ progenitor cells and somatostatin-producing D cells (Extended Data Fig. 2i–k).
Intestinal TFH-like CD4+ T cells are increased in CDIn adults (dataset 1), CD4+ T cells formed subsets dominated by TH1-polarized and IL-17-producing helper T (TH17)-polarized effectors, as well as small naive and FOXP3+ regulatory populations (Fig. 3a–c and Supplementary Table 6). There was a cluster of TFH-like CD4+ T cells expressing PDCD1, BTLA, CD28, ICOS and intermediate CXCR5. Dataset 2 (pediatric) contained analogous subsets (Extended Data Fig. 3a), including CD31+CR2+ recent thymic emigrants38, a CCR7+ TFH-like subset and the TFH-like subset expressing PD1, ICOS, CTLA4, BTLA and CD161 at the protein level (Fig. 3d,e).
Fig. 3: CD4+ T cells in CD.
a–c, Intestinal CD4+ T cells in health and CD in dataset 1 (adult—10x Genomics). a, UMAP plot of intestinal CD4+ T cells in health and CD (n = 8). b, Bubble plot showing the expression of selected genes defining specific cluster identities. Scaled gene expression indicated by color; proportion of cells expressing the gene indicated by bubble size. c, CD4+ T cell UMAP plots overlaid with expression of TNFSF8, PDCD1, TOX2, CXCR3, CXCL13, CD200, CXCR5 and TRBV7-2. Intestinal CD4+ T cells in health and CD in dataset 2 (pediatric—BD Rhapsody; d–f). d, UMAP plot of intestinal CD4+ T cells in health and CD (n = 15). e, Bubble plot showing the expression of selected genes and proteins defining specific cluster identities. Scaled gene/protein expression indicated by color; proportion of cells expressing the gene/protein indicated by bubble size. f, Local neighborhood enrichment of CD4+ cells in ACD versus HCs (dataset 1). Color indicates enrichment (log fold change) of cells in ACD versus HCs in that UMAP neighborhood; size of dot indicates −log10FDR. g, Scatterplot of mean proportion (± s.e.) of CD4+ T cell clusters in HCs (n = 3) versus ACD (n = 5) in dataset 1. Clusters above the line of unity are enriched in ACD. h,i, Treg (h) and TFH (i) CD4+ T cell populations in HCs and CD, as a proportion of total CD4+ T cells in dataset 1 (HCs n = 3, ACD n = 5) and dataset 2 (HCs n = 5, ACD n = 10). j, UMAP plot of CD4+ T cells in dataset 2, overlaid with IL21 and IFNG expression. k, UMAP plot of CD4+ T cells in dataset 1, overlaid with CXCL13, IL21, IFNG and TNFSF8 expression. h,i, Two-sided Mann–Whitney test. Data are presented as mean values ± s.e.m. Ab, antibody; Tc17, IL17+CD8+ T cells; DP, CD4+CD8+ double positive cells.
This TFH-like population in adults and children showed similar phenotypic profiles to those of gut-resident gluten-specific CD4+ T cells in CD12 (Extended Data Fig. 3b), and expressed TOX2, CD200, IL21 and CXCL13. The cluster showed enrichment of TRBV7-2, a V-gene enriched in gluten-specific CD4+ T cell HLA-DQ2.5+ TCR repertoires39. Treg and TFH-like CD4+ T cells were increased in ACD in adults and children (Fig. 3f–i).
T cell populations showed distinct cytokine and chemokine expression patterns (Extended Data Fig. 3c). The CD-associated TFH-like population, showed high CXCL13 and IL21 expression, with IFNG and IL21 coexpression (Fig. 3j,k), similarly to gluten-specific T cells12,40. TFH-like cells expressed TNFSF8, CCL1, CCL22 and CXCL10, as well as IL17F (Extended Data Fig. 3c). IL17F expression was not seen in the IL17A+RORC+IL23R+CCR6+ TH17 population, nor did the TH17 cluster show TRBV7-2 enrichment (Extended Data Fig. 3b,d).
Oral gluten challenge in CD drives rapid circulating cytokine responses, including IL-2, CXCL8, CXCL10 and IL-6 (ref. 41). CXCL8 expression was highest in CCR7+ TFH CD4+ T cells, CXCL10 was detected in TFH-like CD4+ T cells, while IL6 was detected in Treg cells (Extended Data Fig. 3c). IL2 expression was low within the CD4+ compartment, as expected without gluten challenge.
We examined transcription factor (TF), and regulon expression within CD4+ subsets, with canonical TFs and regulons of TH17 and Treg cell function expressed as expected (Extended Data Fig. 3e–g). IKZF1 and its regulon were upregulated in TFH-like cells, with intermediate expression of RUNX1, BATF and IRF3.
Myeloid and B cell lineages in CDWe examined B cell lineages in dataset 2 (pediatric; Extended Data Fig. 4a,b). Both IgA+ and IgM+ plasma cells were increased in CD42,43 (Extended Data Fig. 4c–f). A population of CXCR5+ B cells (MS4A1+CD19+CD20+) were present, with a shift toward the CD27+ memory B cell phenotype in CD.
Gene signatures of age-related B cells (an inflammation-associated population in autoimmune disease44), including ITGAM, ITGAX, CD86 and BATF, were expressed most highly in CD27+ B cell populations, while a key age-related B cell TF, TBX21, was highly expressed in cycling B cells (Extended Data Fig. 4b). HLA class II gene and protein expression, specifically HLA-DQ, was highest in CD27+ and cycling B cells (Extended Data Fig. 4g,h).
Intestinal myeloid cell populations are impacted by CD and may be involved in antigen presentation and oral tolerance5. Myeloid cells (dataset 2) formed 11 transcriptionally distinct clusters, including macrophages, conventional dendritic cells and plasmacytoid dendritic cells (Supplementary Fig. 2a–c). HLA-DQ expression was highest on macrophage populations, particularly CD163+ cells. In contrast to prior studies45, CD163+ macrophages were reduced in ACD, with expansion of a conventional dendritic cell 2 population, which showed increased IL-1B expression (Supplementary Fig. 2d,e).
Tissue-resident memory CD8+ T cells in CDIntestinal CD8+ T cells showed considerable heterogeneity in transcriptional states, with multiple tissue-resident memory CD8+ T (TRM) cells, including an ITGAE−IL7R+ population, a CCL4+CD69+ITGAE+ population and two subsets of ITGAE+ TRM cells (Fig. 4, Extended Data Fig. 5a and Supplementary Table 7). These aligned with gene signatures defining subsets of bona fide human TRM cells46. FGFBP2+ effectors aligned with previously described ITGB2+ITGAE− TRM cells, while TRM(1), TRM(2) and cycling subsets aligned with CD103+ TRM cells (Extended Data Fig. 5b). CCL4+ and IL7R+ populations likely represent intermediate states in TRM cell development. Small natural IEL and cycling MKI67+ populations were seen (Extended Data Fig. 5b,c). Analogous CD8+ T cell subsets were seen in dataset 2 (Fig. 4d,e and Extended Data Fig. 5a), with additional resolution for tissue-resident γδ T cells, and innate-like T cells (mucosal-associated invariant T cells and Vδ2Vγ9+ cells).
Fig. 4: CD8+ T cells in CD.
a–c, Dataset 1 intestinal CD8+ T cells in health and CD (adult—10x Genomics). a, UMAP plot of intestinal CD8+ T cells in health and CD (n = 8). b, Bubble plot showing the expression of selected genes defining specific cluster identities. Scaled gene expression indicated by color; proportion of cells expressing the gene indicated by bubble size. c, UMAP plots overlaid with expression of IL7R, GZMK, ITGAE, CXCR6, GZMA, LAYN, ENTPD1, TNFRSF9, TIGIT and HLA-DRB1. Dataset 2 intestinal CD8+ T cells in health and CD (pediatric—BD Rhapsody; d–f). d, UMAP plot of intestinal CD8+ T cells in health and CD (n = 15). e, Bubble plot showing the expression of selected genes and proteins defining specific cluster identities. Gene/protein expression indicated by color; proportion of cells expressing the gene/protein indicated by bubble size. f, Local neighborhood enrichment of CD8+ cells in ACD versus HCs (dataset 1). Color indicates enrichment (log fold change) of cells in ACD versus HCs in that UMAP neighborhood; size of dot indicates −log10FDR. g, Scatterplot of mean proportion (± s.e.) of CD8+ T cell clusters in HCs (n = 3) versus ACD (n = 5). Clusters above the line of unity are enriched in ACD. h,i, TRM(2) (h) and cycling (i) CD8+ T cell phenotype populations in HCs and CD, as a proportion of total CD8+ T cells in dataset 1 (HCs n = 3, ACD n = 5) and dataset 2 (HCs n = 5, ACD n = 10). h,i, Two-sided Mann–Whitney test. Data are presented as the mean values ± s.e.m. nIEL, natural intraepithelial lymphocyte.
We analyzed subsets relevant to CD, including natural killer (NK)-receptor expressing IELs17,18 and killer-cell immunoglobulin-like receptor (KIR)-positive CD8+ T cells47. KLRC1 (NKG2A) was expressed by CCL4+ cells, while KLRC2 (NKG2C) was expressed by resident IL7R+, TRM(1) and TRM(2) subsets (Extended Data Fig. 5c,d). Inhibitory KIR molecule expression was confined to a small FGFBP2+ effector population.
TRM(2) and cycling populations were enriched in ACD, but not TRM(1) cells (Fig. 4f,g). TRM(2) cells were rare in health, but increased to form 20–40% of CD8+ T cells in ACD, which persisted in TCD (Fig. 4h). Natural IELs were reduced in ACD (Extended Data Fig. 5e). Cycling CD8+ T cells increased to form 2–4% of cells in ACD (Fig. 4i). Most cycling cells showed a TRM(2) phenotype (Extended Data Fig. 5f).
As TRM(2) CD8+ T cells were increased in proportion and proliferating in ACD, we profiled them in depth (Fig. 5a–e and Extended Data Fig. 6). TRM(2) CD8+ T cells showed a CD103+ tissue-resident phenotype, high GZMA and absent GZMK expression, along with high expression of CXCR6, activation markers (HLA-DR) and genes expressing co-stimulatory and co-inhibitory molecules (TIGIT, TNFRSF9 (4-1BB), ENTPD1 (CD39) and LAYN (Fig. 4b,c). Comparison of TRM(2) cells in ACD versus TCD showed increased expression of activation markers and increased effector function with IFNG, GZMB and IL32 expression (Extended Data Fig. 5g).
Fig. 5: CD8+ T cells in CD.
a, Pseudotime trajectory of gene expression of tissue-resident CD8+ T cell clusters (dataset 1—adult), colored by pseudotime axis (left) and cell cluster (right). Arrows indicate direction of differentiation. b, Pseudotime trajectory, split by disease state, and colored by differentiation branch. The proportion of CD8+ TRM cells differentiating down branches 1 and 2 in each disease state is indicated. c, Bubble plot of expression of chemokine, cytokine and TNF family member genes by CD8+ T cell clusters in dataset 2 (pediatric). Scaled gene expression indicated by color; proportion of cells expressing the gene indicated by bubble size. d, UMAP plots of CD8+ T cells in dataset 2 (pediatric), overlaid with IFNG, CCL20 and FASLG expression. e, TCR clonal overlap (Morisita–Horn) between CD8+ T cell clusters in dataset 1. f, Volcano plot of TRBV segment usage within the TCR repertoire of TRM(2) cells between HCs and CD. Black, high-frequency TRBV segments used by >1% of total clones; gray, low-frequency TRBV segments used by <1% of total clones. g, Volcano plot of TRBV segment gene expression (left) and normalized expression of TRBV28 (right) in bulk RNA-seq data from sorted intraepithelial CD8+ T cells (dataset 3; HCs n = 3, ACD n = 4, TCD n = 3, potential CD n = 2). h, Volcano plot of TRBV segment usage (left), and proportion of unique CDR3β clonotypes (right above) and proportion of top 100 most common clonotypes (right, below) using the TRBV28 V segment in bulk TCR-seq of CD8+ mucosal T cells in HCs and CD (dataset 4; HCs n = 8, ACD n = 7, TCD n = 5). f, Negative binomial model without multiple comparisons. g, Negative binomial model with Benjamini–Hochberg multiple testing. h, One-way analysis of variance with Holm–Sidak’s multiple-comparisons test.
We examined pseudotime trajectories of tissue-resident clusters with TCR repertoire clonal sharing (TRM(1), TRM(2), IL7R+ and CCL4+ effectors) to infer putative differentiation pathways (Fig. 5a,b,e). The pseudotime trajectory showed two branches, formed predominantly of TRM(1) cells in branch 1 and TRM(2) cells in branch 2, developing from IL7R+ and CCL4+ populations (Fig. 5a). While branch 1 cells were seen in both controls and CD, strikingly, branch 2 was almost totally restricted to ACD and TCD (Fig. 5b).
We examined cytokine, chemokine and TF expression by CD8+ T cell subsets. The predominant CD8+ sources of IFNG were CD8+ TRM(2) and cycling clusters (Fig. 5c,d and Extended Data Fig. 5g–i). These populations also expressed the chemokine CCL5, CD70 and FASLG. Natural IELs (reduced in ACD), produced CCL2, CXCL2, CXCL3, IL12, IL18 and type I interferon. TRM(1) and TRM(2) CD8+ subsets showed distinct TF and regulon profiles; TRM(2) cells were associated with the TF regulons BACH1, CEBPZ, CREM, IRF4 and NR3C1 and TF expression of RORA, PRDM and FOXO1 (Extended Data Fig. 5j–l).
CD8+ TCR repertoires are altered in CDCD8+ T cell-induced epithelial damage is thought to be mediated via TCR-independent mechanisms. We hypothesized that CD8+ T cell TCR repertoires would be similar in health and disease. Single-cell TCR sequences were examined, which showed expected clonal overlap between tissue-resident populations (Fig. 5e and Extended Data Fig. 6a). Cluster TRBV gene usage was examined between health and CD. Several high-frequency TRBV segments (>1% total clones) were overrepresented in CD (Fig. 5f and Extended Data Fig. 6b). However, statistical power was limited due to low clonotype numbers.
Consequently, we sorted intraepithelial CD8+ T cells from 12 adults with and without CD (dataset 3) and performed bulk RNA-seq. This showed significant enrichment of one TRBV segment, TRBV28, enriched in ACD and TCD, but not controls (Fig. 5g). TRBV28 was the high-frequency V segment with the highest fold change for enrichment in CD within the TRM(2) population (Fig. 5f).
We validated this by performing bulk TCR repertoire sequencing on 1,068,814 mucosal CD8+ T cells from 20 donors with and without CD (dataset 4). Again, TRBV28 was highly upregulated in CD, forming 10% of unique CDR3 sequences in ACD and TCD, versus 2% in controls (Fig. 5h). TRBV28 was also enriched within the top 100 most expanded clonotypes. No association with TRAV usage was seen. Clonotypes containing TRBV28 in CD paired with multiple TRBJ segments, and showed altered CDR3 amino acid usage, with enrichment of germline-encoded and non-germline-encoded leucine residues (Extended Data Fig. 6c–e).
We examined bulk TCR repertoires of intestinal CD8+ T cells of colonic and small intestinal biopsy samples from three separate studies examining non-CD inflammatory gastrointestinal conditions48,49,50. There was no signal for enrichment of TRBV28 gene usage in these disease settings (Extended Data Fig. 6f–h).
We hypothesized that differences in mucosal CD8+ TCR repertoire/phenotype may be mirrored within gut-homing CD8+ T cells in the circulation, as seen following gluten challenge30. We examined TRBV28 usage by circulating CD8+ T cells using flow cytometry (dataset 9). Using TCR sequencing (TCR-seq), we validated the specificity of the TRBV28-specific antibody clone (JOVI.3; Extended Data Fig. 7a–c). As expected, there was no difference in the fraction of TRBV28+ cells in total peripheral CD3+ or CD8+ T cell compartments in participants with and without CD. However, within CD8+ T cell populations expressing gut-specific chemokines (CCR9) or integrins (CD103/β-integrin), the fraction of TRBV28+ cells was increased in ACD and TCD (Extended Data Fig. 7d–h).
γδ T cell populations and TCR repertoires are altered in CDIntraepithelial duodenal γδ T cells are increased in CD, although their role is unclear32,51. We analyzed a further dataset of 5,552 sorted intestinal CD8+ αβ+ and γδ+ T cells (dataset 8; Extended Data Fig. 8). Clustering of cell transcriptional states recapitulated the key populations described above (Extended Data Fig. 8a,b). As previously, the TRM(2) population (in this case split into IFNG+ and IKZF2+ subpopulations) was increased in ACD, along with cycling T cells (Extended Data Fig. 8c).
γδ T cells showed overlapping transcriptional profiles with mucosal CD8+ αβ T cells, albeit with enrichment within specific clusters (Extended Data Fig. 8d,e). γδ T cells were most enriched within a natural IEL phenotype cluster and the GZMK+/FGFBP2+ effector populations, and were also present in the CCL4+ effector and IKZF2+ TRM(2) population. γδ T cells were uncommon within IFNG+ TRM(2) and cycling clusters. TRDV1 and TRDV3 expression was higher in the CCL4+, IKZF2+ TRM(2) and natural IEL populations, with TRDV3 in particular enriched in the natural IEL cluster (Extended Data Fig. 8f).
We analyzed the TCR repertoire of CD8+ T cells in this dataset. The TRM and IL7R+ clusters showed greatest clonal expansion (Extended Data Fig. 8g). In all participants with CD, TRBV28-containing clonotypes were more clonally expanded than their non-TRBV28 counterparts. TRBV28+ clonotypes were enriched in the top quintile of expanded clones, which were almost exclusively found within the TRM(2) and cycling clusters (Extended Data Fig. 8h,i).
We validated these findings through bulk RNA-seq of sorted intestinal αβ+ CD8+ and γδ T cells from participants with and without CD (dataset 6). Gene-set enrichment analysis of CD8+ T cell gene expression in ACD showed upregulation of TCR activation gene sets, and enrichment of cluster marker gene sets from TRM(2) and cycling populations (Supplementary Fig. 3a–c), with upregulation of CXCR6, ENTPD1 and MKI67 (Supplementary Fig. 3d). CD8+ T cells showed upregulation of IFNG and IL26 (Supplementary Fig. 3e). There was a shift from KLRC1 (NKG2A) to KLRC2 (NKG2C) expression, but KLRK1 (NKG2D) expression was not increased. Inhibitory KIRs were upregulated in this dataset, consistent with recent findings47. Gene expression between health and CD was different in γδ+ and αβ+ CD8+ T cells (Supplementary Fig. 3f,g). IFNG and MKI67 expression were not increased to the same extent in γδ+ T cells, nor were TRM(2) IFNG+ cluster markers like ENTPD1. There were also differences in NK cell receptor changes, KIRs, PDCD1 and TYROBP, a natural IEL marker (Supplementary Fig. 3h).
Bulk γδ TCR repertoire sequencing (dataset 7) revealed a skewed TRGV repertoire, with reduced TRGV4 and increased TRGV3 use in ACD (Supplementary Fig. 4a,b), which persisted after treatment, as previously described51. Most TRD CDR3 sequences were private; however, increased sequence sharing was noted between ACD repertoires (Supplementary Fig. 4c), with longer shared CDR3 sequences in ACD (Supplementary Fig. 4d). Previously reported CD-associated TRDV CDR3 motifs30, were increased in ACD; however, we were unable to replicate the previously described association between the TRDV H-J1 motif and CD51 (Supplementary Fig.
Comments (0)