
Remember me


This study involved 75 children with a median age of 13 years (range, 6–18 years); 64% of them were male and 36% were female. The patients’ median disease duration was 12 years (range, 5–17.5 years). The first blood transfusion was administered at a median age of 6 months (range, 1.5–36 months), and the median frequency of blood transfusions was 20 (range, 12–24) per year. Regarding chelation therapy, it was initiated at a median age of 1 year (range, 0.5–5 years), with 96% of children demonstrating good compliance. Chelation therapy was administered in the form of deferasirox to all patients at a dose of 10–28 mg/kg/day, and deferoxamine was added to 28% of patients with severe iron overload at a dose of 40–50 mg/kg/day.
Of all the children, 8% presented with cardiac symptoms, including dyspnea, chest pain, dizziness, and syncope; 8% presented with thalassemic complications, including hepatitis C virus and diabetes mellitus; and 16% underwent splenectomy. The severity of thalassemia was classed as moderate in 88% of patients and severe in 12% of patients. With respect to the laboratory results, the median hemoglobin level was 9.1 (range, 8.0–10.30) g/dl. Serum ferritin level was < 2500 ng/ml in 52% of patients, between 2500 and 5000 ng/ml in 28% of patients and >5000 ng/ml in 20% of patients. As regards vitamin D levels, 18.7% of patients had insufficient vitamin D (20–29.9 ng/ml), while 81.3% had deficient levels (< 20 ng/ml).
Association of vitamin D level with patients’ characteristics before interventionSeveral key associations between vitamin D levels before intervention and demographic data, disease characteristics, laboratory measurements, and magnetic resonance imaging (MRI) findings are highlighted in Table 1.
Table 1 Association of vitamin D level with patients’ characteristics before interventionSpearman correlation analysis between Vitamin D and baseline patients’ characteristics showed a strong negative correlations of vitamin D level with age (rs = −0.527, p < 0.001) and disease duration (rs = −0.453, p < 0.001) and substantial positive associations with onset of blood transfusion (rs = 0.26, p = 0.024) and onset of chelation therapy (rs = 0.284, p = 0.014).
Association of vitamin D level with echocardiographic parameters before interventionWhen comparing vitamin D deficient and insufficient groups regarding the parameters of the conventional echocardiography, only the deceleration time was considerably higher in the vitamin D deficient group than the insufficient group (p = 0.042). Regarding the STE parameters, the values of apical (AP) 4, 3, and 2 longitudinal (L) and the global longitudinal strains (GLS) were worse in the deficient than in the insufficient group (p = 0.034, 0.002, 0.027, and 0.005, respectively), as displayed in Table 2.
Table 2 Association of vitamin D level with echocardiographic parameters of left ventricle before interventionOn Spearman correlation analysis between vitamin D and conventional echocardiography, vitamin D level had an inverse relationship with left ventricular end-diastolic diameter (LVEDD) (rs = −0.403, p < 0.001) and deceleration time (rs = −0.338, p = 0.003). For the STE parameters, vitamin D level was positively correlated to the absolute value of GLS (rs = 0.438, p < 0.001).
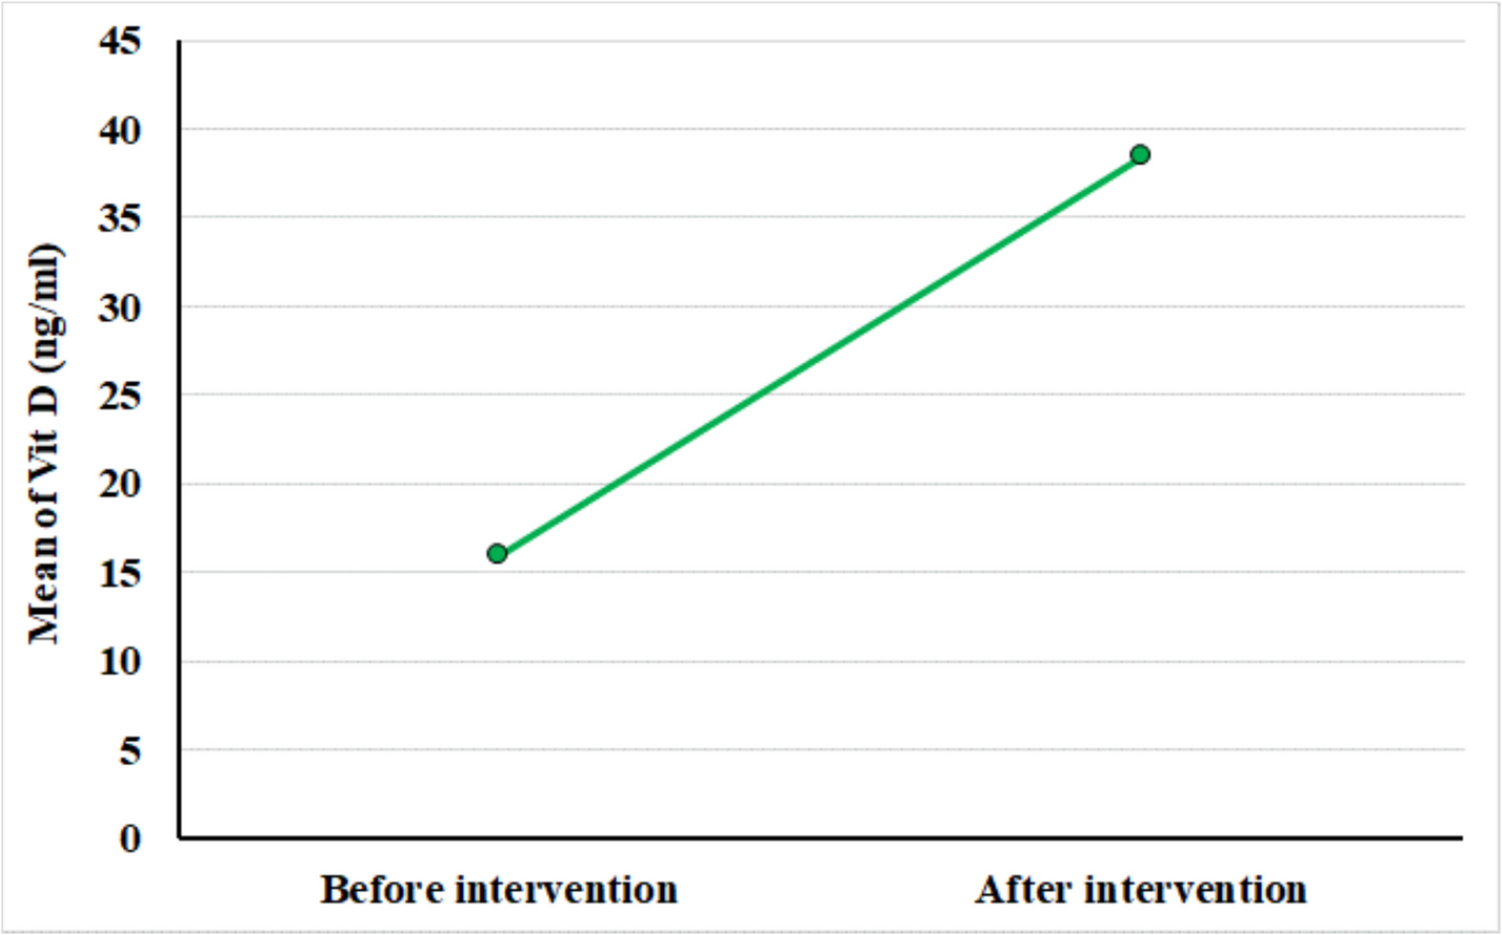
Comparison of vitamin D level and echocardiographic parameters before and after interventionThe mean Vitamin D level surged from 15.93 ± 3.61 (range, 9–22) ng/ml before intervention to 38.39 ± 3.95 (range, 31–45) ng/ml after intervention, showing a highly significant substantial improvement (p < 0.001) (Figure 1).
Fig. 1
Line chart for vitamin D level before and after intervention
For the conventional and tissue Doppler echocardiography, the post-intervention data show significant improvement in multiple echocardiographic parameters. A noticeable improvement in STE parameters after vitamin D intervention is observed in Table 3.
Table 3 Comparison between left ventricular echocardiographic parameters before and after interventionPredictors of GLS impairment before intervention in β-TM childrenThe univariate linear regression analysis identified patient’s age, disease duration, and vitamin D deficiency as significant predictors of GLS impairment (p < 0.001, p < 0.001, and p = 0.005). However, in the multivariate analysis, the patient’s age remained the only strong predictor (p < 0.001), as shown in Table 4.
Table 4 Linear regression for prediction of GLS impairment before intervention
Comments (0)